
Houses for sale & to rent in Killay South, Swansea
House Prices in Killay South
Properties in Killay South have an average house price of £268,581.00 and had 127 Property Transactions within the last 3 years¹.
Killay South is an area in Swansea, Abertawe - Swansea with 1,046 households², where the most expensive property was sold for £1,200,000.00.
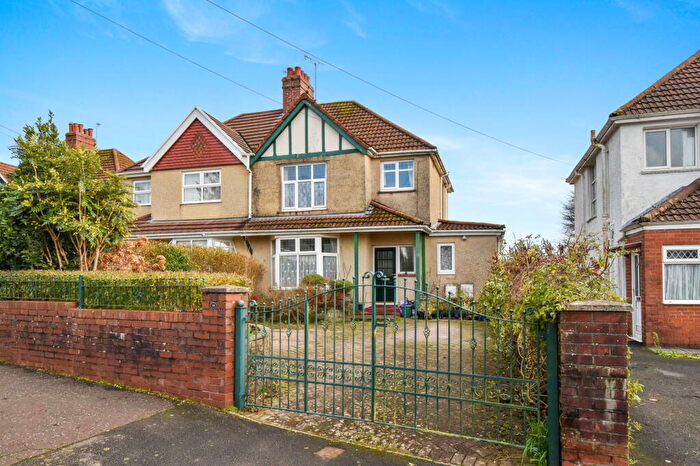
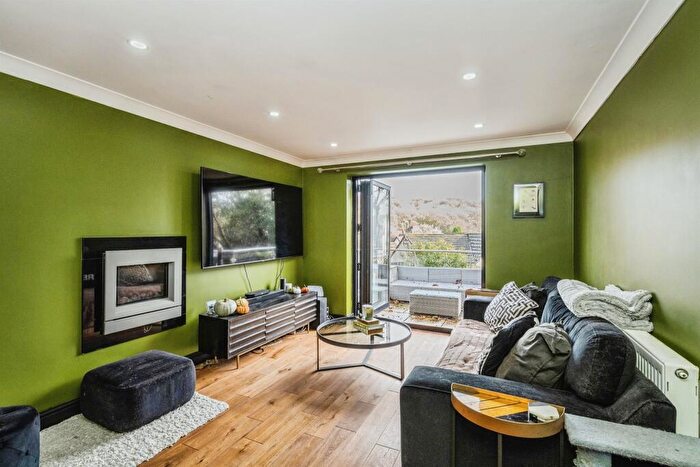
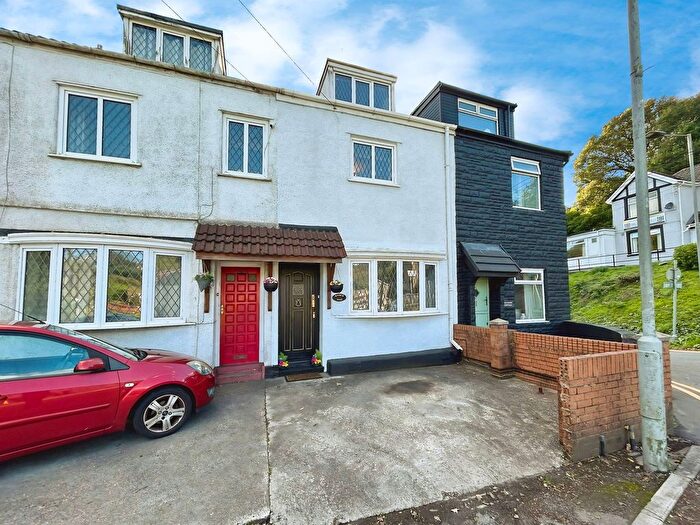
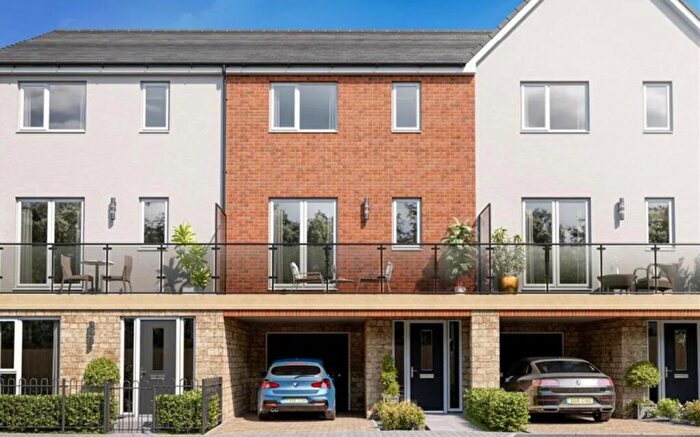
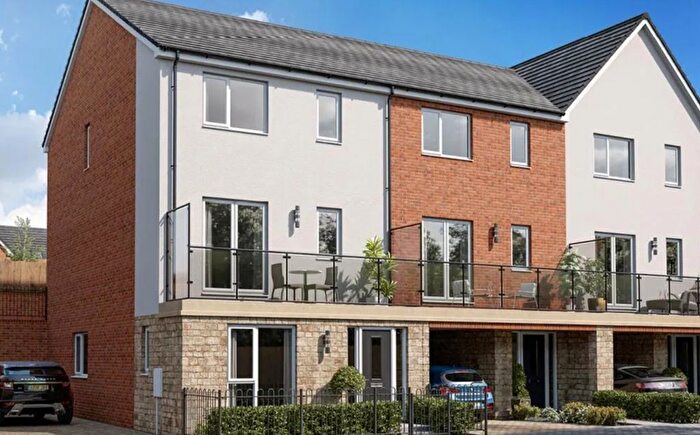
Properties for sale in Killay South
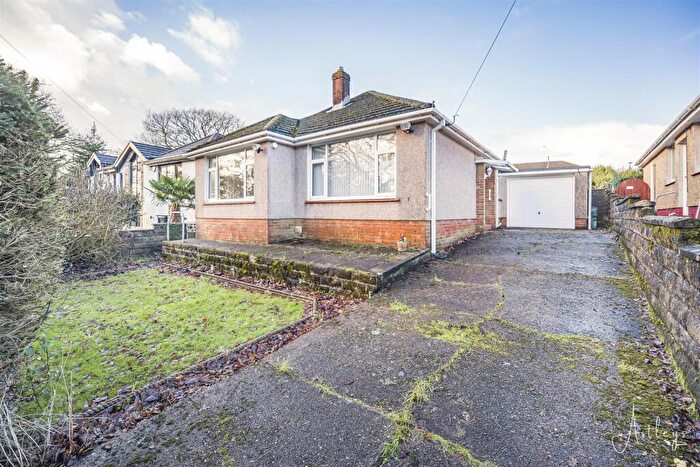

![]()
If you are looking to sell your house, let it out, or receive a property valuation, an expert can help you.
Click the button below to get started.


Roads and Postcodes in Killay South
Navigate through our locations to find the location of your next house in Killay South, Swansea for sale or to rent.
| Streets | Postcodes |
|---|---|
| Ash Grove | SA2 7QY SA2 7QZ SA2 7RA |
| Broadacre | SA2 7RU |
| Broadmead | SA2 7EE SA2 7EJ SA2 7RJ |
| Clyn Cwm Gwyn | SA2 7AQ |
| Clyne Valley Cottages | SA2 7DU |
| Clyne Valley Road | SA2 7DT |
| Clyne View | SA2 7EA |
| Cygnet Close | SA2 7BB SA2 7BD |
| Goetre Fawr Road | SA2 7QS SA2 7QT |
| Gower Road | SA2 7AH SA2 7AJ SA2 7AN SA2 7DS SA2 7DY SA2 7DZ SA2 7AL |
| Heaseland Place | SA2 7EQ |
| Kennington Close | SA2 7EF |
| Lime Grove | SA2 7EG |
| Millwood Gardens | SA2 7BE |
| Oakdene | SA2 7RX |
| Olchfa Lane | SA2 8QQ |
| Ridgeway | SA2 7AP SA2 7AS SA2 7AT |
| Rowan Close | SA2 7DW |
| St Aiden Drive | SA2 7AX |
| St Christopher Drive | SA2 7AR |
| St David Drive | SA2 7EN |
| St Hilary Drive | SA2 7EH |
| St Nicholass Court | SA2 7AD SA2 7AG |
| St Rhidian Drive | SA2 7EL |
| The Dell | SA2 7DX |
| The Precinct | SA2 7BA |
| Wimmerfield Avenue | SA2 7BT SA2 7DA |
| Woodcote | SA2 7AU SA2 7AY SA2 7AZ |
| Woodside Avenue | SA2 7ED |
| Woodside Close | SA2 7EB |
Transport near Killay South

- FAQ
- Price Paid By Year
- Property Type Price
Frequently asked questions about Killay South
What is the average price for a property for sale in Killay South?
The average price for a property for sale in Killay South is £268,581. This amount is 24% higher than the average price in Swansea. There are 862 property listings for sale in Killay South.
What streets have the most expensive properties for sale in Killay South?
The streets with the most expensive properties for sale in Killay South are Olchfa Lane at an average of £1,200,000, Woodside Close at an average of £855,000 and Millwood Gardens at an average of £530,000.
What streets have the most affordable properties for sale in Killay South?
The streets with the most affordable properties for sale in Killay South are Broadmead at an average of £187,947, Kennington Close at an average of £200,936 and Woodcote at an average of £201,177.
Which train stations are available in or near Killay South?
Some of the train stations available in or near Killay South are Gowerton, Swansea and Bynea.
Property Price Paid in Killay South by Year
The average sold property price by year was:
| Year | Average Sold Price | Price Change |
Sold Properties
|
|---|---|---|---|
| 2025 | £389,285 | 35% |
14 Properties |
| 2024 | £252,000 | 1% |
42 Properties |
| 2023 | £250,722 | -3% |
33 Properties |
| 2022 | £257,948 | 4% |
38 Properties |
| 2021 | £248,756 | 3% |
46 Properties |
| 2020 | £240,686 | 20% |
31 Properties |
| 2019 | £191,922 | -9% |
37 Properties |
| 2018 | £209,522 | 8% |
53 Properties |
| 2017 | £192,657 | 14% |
50 Properties |
| 2016 | £165,544 | -8% |
41 Properties |
| 2015 | £178,111 | 6% |
31 Properties |
| 2014 | £166,748 | 8% |
26 Properties |
| 2013 | £153,324 | -21% |
32 Properties |
| 2012 | £185,720 | -2% |
37 Properties |
| 2011 | £189,855 | 15% |
38 Properties |
| 2010 | £160,791 | 10% |
29 Properties |
| 2009 | £145,270 | -14% |
34 Properties |
| 2008 | £166,000 | -1% |
17 Properties |
| 2007 | £168,301 | -5% |
32 Properties |
| 2006 | £176,197 | -2% |
53 Properties |
| 2005 | £179,346 | -14% |
42 Properties |
| 2004 | £204,661 | 31% |
52 Properties |
| 2003 | £141,041 | 38% |
43 Properties |
| 2002 | £87,246 | 15% |
39 Properties |
| 2001 | £74,060 | 16% |
45 Properties |
| 2000 | £62,393 | -4% |
28 Properties |
| 1999 | £64,734 | 10% |
60 Properties |
| 1998 | £58,436 | -2% |
33 Properties |
| 1997 | £59,531 | 11% |
43 Properties |
| 1996 | £53,013 | -3% |
38 Properties |
| 1995 | £54,404 | - |
37 Properties |
Property Price per Property Type in Killay South
Here you can find historic sold price data in order to help with your property search.
The average Property Paid Price for specific property types in the last three years are:
| Property Type | Average Sold Price | Sold Properties |
|---|---|---|
| Semi Detached House | £240,215.00 | 82 Semi Detached Houses |
| Detached House | £351,736.00 | 36 Detached Houses |
| Terraced House | £209,500.00 | 5 Terraced Houses |
| Flat | £175,562.00 | 4 Flats |