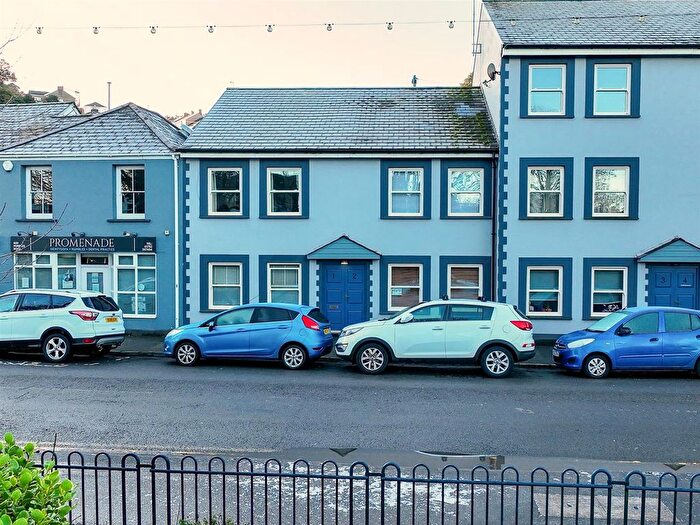
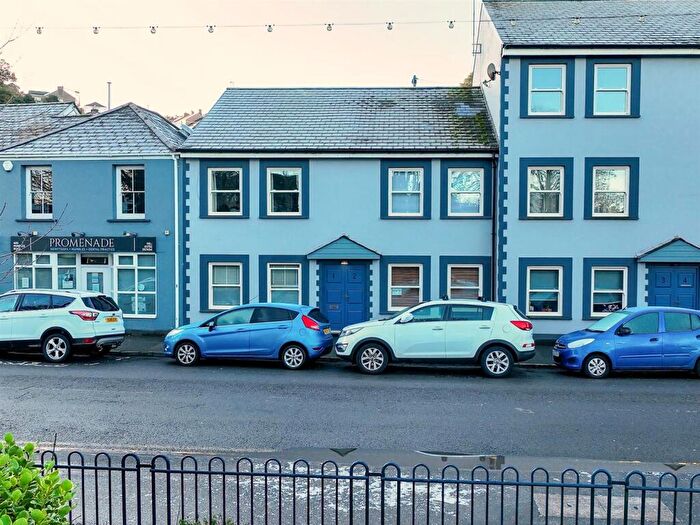
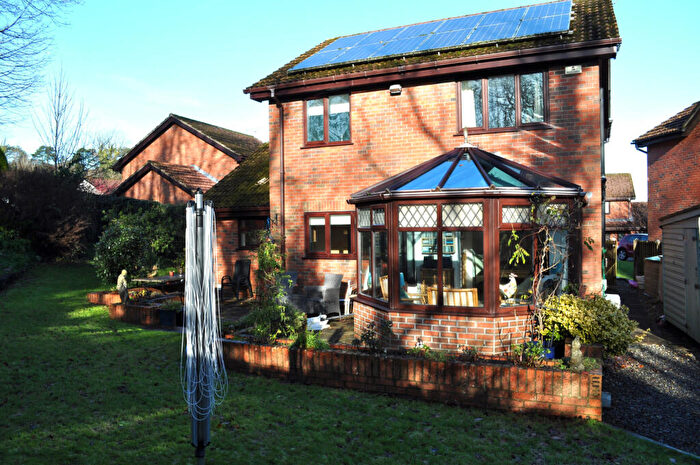
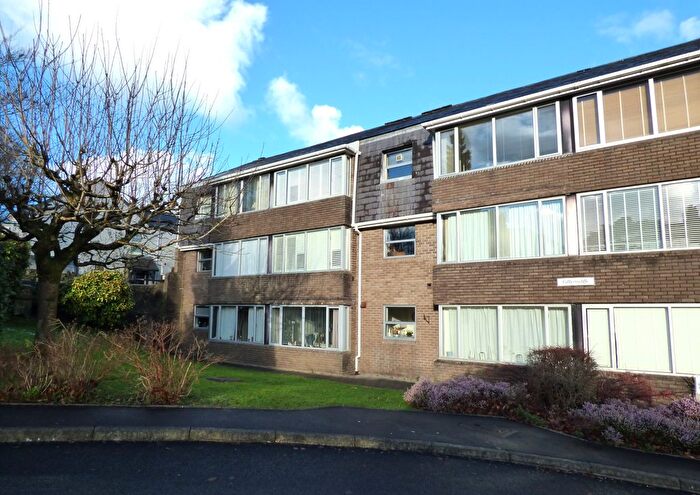
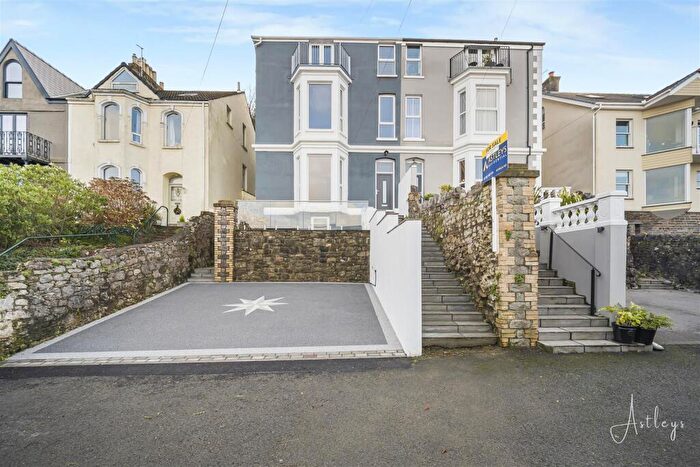
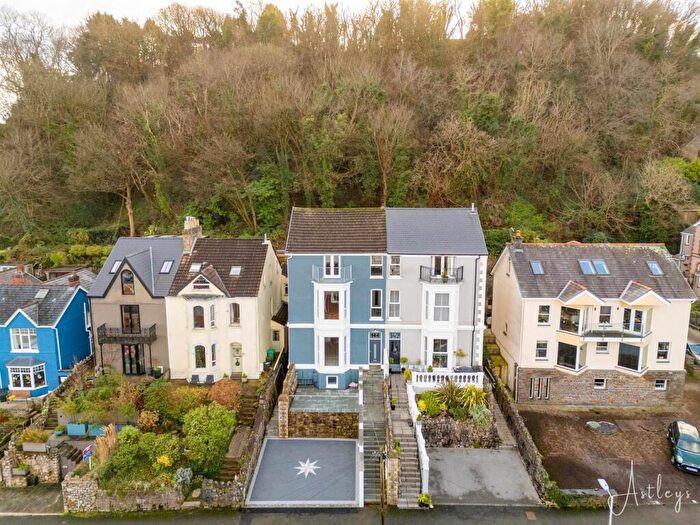
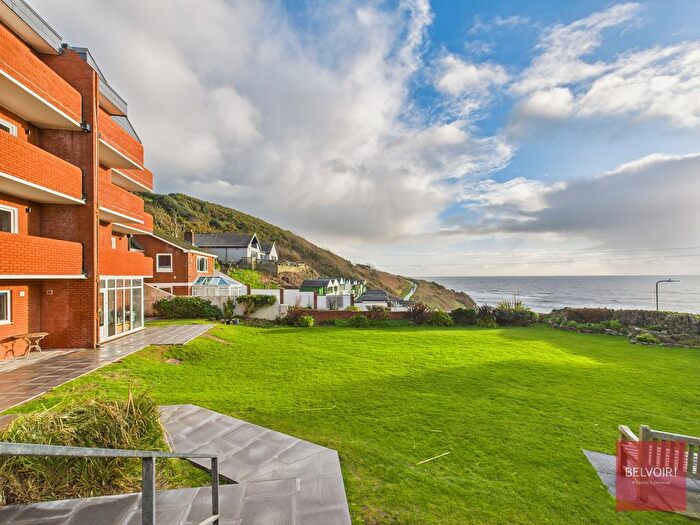
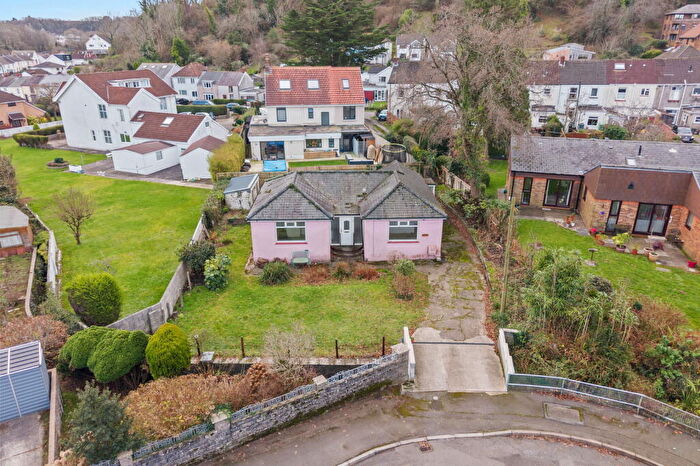
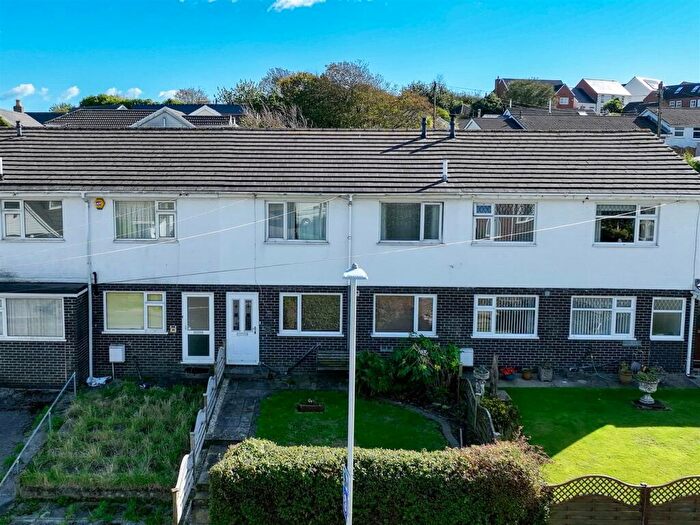
Houses for sale & to rent in Oystermouth, Swansea
House Prices in Oystermouth
Properties in Oystermouth have an average house price of £383,276.00 and had 277 Property Transactions within the last 3 years¹.
Oystermouth is an area in Swansea, Abertawe - Swansea with 1,977 households², where the most expensive property was sold for £1,335,000.00.
Properties for sale in Oystermouth
Roads and Postcodes in Oystermouth
Navigate through our locations to find the location of your next house in Oystermouth, Swansea for sale or to rent.
| Streets | Postcodes |
|---|---|
| Aelybryn | SA3 4JS |
| Albert Place | SA3 4LE |
| Amberley Drive | SA3 4PJ |
| Beaufort Avenue | SA3 4NU SA3 4PB |
| Beaufort Close | SA3 4PA |
| Berma Close | SA3 4JX |
| Brandy Cove Close | SA3 4HN |
| Bridle Mews | SA3 4JP |
| Broadview Close | SA3 4LW |
| Broadview Lane | SA3 4LN |
| Bryn Terrace | SA3 4HD |
| Cambridge Close | SA3 4PF |
| Cambridge Gardens | SA3 4PP |
| Cambridge Road | SA3 4PE SA3 4PQ |
| Castle Avenue | SA3 4BA |
| Castle Crescent | SA3 4AY |
| Castle Road | SA3 5TA |
| Castle Square | SA3 4BJ |
| Castle Street | SA3 4BH |
| Channel View | SA3 4PL |
| Chapel Street | SA3 4NH |
| Church Park | SA3 4DE SA3 4DF |
| Church Park Lane | SA3 4BZ |
| Cleveland Avenue | SA3 4JD |
| Clifton Terrace | SA3 4EJ |
| Cornwall Place | SA3 4DP |
| Devon Place | SA3 4DR |
| Dickslade | SA3 4EG |
| Dunns Close | SA3 4AF |
| Dunns Lane | SA3 4AA |
| George Bank | SA3 4EP SA3 4EQ |
| Glengower Close | SA3 5SU |
| Glenville Road | SA3 5TE |
| Gloucester Place | SA3 4LF SA3 4LQ |
| Gower Place | SA3 4AB |
| Greenslade | SA3 4QU |
| Hall Bank | SA3 4DY |
| Hallbank Terrace | SA3 4DZ |
| Harbour Winds Court | SA3 4ER |
| Heatherslade Close | SA3 4HP |
| Helwick Close | SA3 5SZ |
| Higher Lane | SA3 4HQ SA3 4NS SA3 4NT SA3 4PD SA3 4PS |
| Hill Street | SA3 4EF |
| Hillcrest | SA3 4PW |
| John Street | SA3 4LH |
| Kings Road | SA3 4AJ SA3 4AL |
| Lambswell Close | SA3 4HJ |
| Langcliffe Park | SA3 4JF |
| Langland Close | SA3 4LY |
| Langland Road | SA3 4LU SA3 4LX SA3 4ND |
| Langland Villas | SA3 4NA |
| Libby Way | SA3 4LB |
| Limeslade Court | SA3 4JW |
| Limeslade Drive | SA3 4JR |
| Michaels Field | SA3 4JB |
| Mumbles Hill | SA3 4HZ |
| Mumbles Road | SA3 4BX SA3 4BY SA3 4DH SA3 4DL SA3 4EA SA3 4EE SA3 4EH SA3 4EL SA3 4BU SA3 4DN SA3 4EN SA3 4ES SA3 4JT |
| Myrtle Terrace | SA3 4DT |
| New Villas | SA3 4HT |
| Newton Road | SA3 4AT SA3 4BE SA3 4BL SA3 4BN SA3 4BQ SA3 4SL SA3 4AR SA3 4AS SA3 4AU SA3 4AX SA3 4BD |
| Nicholl Court | SA3 4LZ |
| Oakland Road | SA3 4AH SA3 4AQ |
| Old Plunch Lane | SA3 4HG |
| Overland Close | SA3 4LR |
| Overland Road | SA3 4EU SA3 4LL SA3 4LP SA3 4LS |
| Oystermouth Court | SA3 5TD |
| Park Avenue | SA3 4DU |
| Park Street | SA3 4DA |
| Plunch Lane | SA3 4JE SA3 4JY |
| Promenade Terrace | SA3 4DS |
| Queens Road | SA3 4AN SA3 4AW |
| Rockhill | SA3 4ED |
| Rossers Field | SA3 4JQ |
| Sarlou Close | SA3 4JG |
| Sealands Drive | SA3 4JU |
| Silverhurst | SA3 4HS |
| Somerset Road | SA3 4PG |
| St Annes Close | SA3 4NX |
| Stanley Street | SA3 4NE |
| The Grove | SA3 4AP |
| Thistleboon Drive | SA3 4HY SA3 4BG |
| Thistleboon Gardens | SA3 4HH |
| Thistleboon Road | SA3 4HE SA3 4JA |
| Three Ships Court | SA3 4LD |
| Tichbourne Street | SA3 4HB |
| Trinity Close | SA3 5SX |
| Upper Church Park | SA3 4DD |
| Victoria Avenue | SA3 4NG SA3 4NQ |
| Village Lane | SA3 4EB SA3 4HA |
| Walters Crescent | SA3 4BB |
| Waverley Drive | SA3 5SY |
| Westbourne Place | SA3 4DB |
| Westcliff | SA3 4JN |
| Westcliff Mews | SA3 4JZ |
| Western Close | SA3 4HF |
| Western Lane | SA3 4DX SA3 4EW SA3 4EY |
| William Gammon Drive | SA3 4HR |
| William Street | SA3 4LJ |
| Windsor Place | SA3 4LG |
| Woodville Road | SA3 4AD SA3 4AE |
| Worcester Drive | SA3 4HL |
| Worcester Road | SA3 4PN |
| Wychwood Close | SA3 4PH |
| SA3 4EX |
Transport near Oystermouth
-
Swansea Station
-
Gowerton Station
-
Llansamlet Station
-
Bynea Station
-
Baglan Station
-
Briton Ferry Station
-
Llangennech Station
-
Skewen Station
-
Port Talbot Parkway Station
-
Llanelli Station
- FAQ
- Price Paid By Year
- Property Type Price
Frequently asked questions about Oystermouth
What is the average price for a property for sale in Oystermouth?
The average price for a property for sale in Oystermouth is £383,276. This amount is 76% higher than the average price in Swansea. There are 712 property listings for sale in Oystermouth.
What streets have the most expensive properties for sale in Oystermouth?
The streets with the most expensive properties for sale in Oystermouth are Hillcrest at an average of £1,105,000, Beaufort Avenue at an average of £856,666 and Harbour Winds Court at an average of £800,000.
What streets have the most affordable properties for sale in Oystermouth?
The streets with the most affordable properties for sale in Oystermouth are Bridle Mews at an average of £82,500, Sealands Drive at an average of £173,777 and William Street at an average of £196,250.
Which train stations are available in or near Oystermouth?
Some of the train stations available in or near Oystermouth are Swansea, Gowerton and Llansamlet.
Property Price Paid in Oystermouth by Year
The average sold property price by year was:
| Year | Average Sold Price | Price Change |
Sold Properties
|
|---|---|---|---|
| 2025 | £379,264 | 8% |
51 Properties |
| 2024 | £347,758 | -8% |
66 Properties |
| 2023 | £374,215 | -12% |
69 Properties |
| 2022 | £418,156 | 10% |
91 Properties |
| 2021 | £374,295 | 7% |
143 Properties |
| 2020 | £347,373 | 11% |
71 Properties |
| 2019 | £309,796 | -8% |
90 Properties |
| 2018 | £333,749 | 24% |
78 Properties |
| 2017 | £255,287 | -7% |
99 Properties |
| 2016 | £274,017 | 4% |
107 Properties |
| 2015 | £264,315 | -1% |
112 Properties |
| 2014 | £265,835 | -3% |
100 Properties |
| 2013 | £273,075 | -3% |
76 Properties |
| 2012 | £280,713 | 7% |
68 Properties |
| 2011 | £261,130 | 4% |
65 Properties |
| 2010 | £250,000 | -6% |
64 Properties |
| 2009 | £264,747 | 11% |
90 Properties |
| 2008 | £235,444 | -10% |
66 Properties |
| 2007 | £259,236 | -0,1% |
97 Properties |
| 2006 | £259,403 | 11% |
132 Properties |
| 2005 | £231,047 | 12% |
126 Properties |
| 2004 | £204,164 | 25% |
98 Properties |
| 2003 | £153,873 | 19% |
124 Properties |
| 2002 | £123,945 | 19% |
159 Properties |
| 2001 | £100,519 | 9% |
143 Properties |
| 2000 | £91,967 | 10% |
137 Properties |
| 1999 | £83,153 | 1% |
136 Properties |
| 1998 | £82,725 | 5% |
154 Properties |
| 1997 | £78,961 | 10% |
164 Properties |
| 1996 | £71,375 | 12% |
102 Properties |
| 1995 | £63,000 | - |
91 Properties |
Property Price per Property Type in Oystermouth
Here you can find historic sold price data in order to help with your property search.
The average Property Paid Price for specific property types in the last three years are:
| Property Type | Average Sold Price | Sold Properties |
|---|---|---|
| Semi Detached House | £354,740.00 | 52 Semi Detached Houses |
| Detached House | £572,164.00 | 73 Detached Houses |
| Terraced House | £324,250.00 | 121 Terraced Houses |
| Flat | £216,740.00 | 31 Flats |

