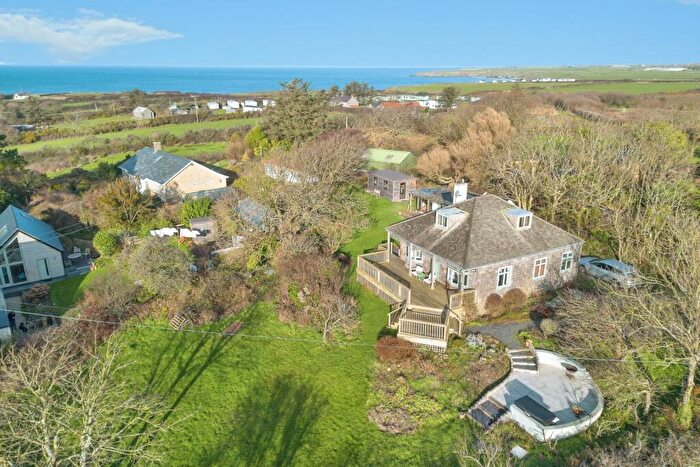
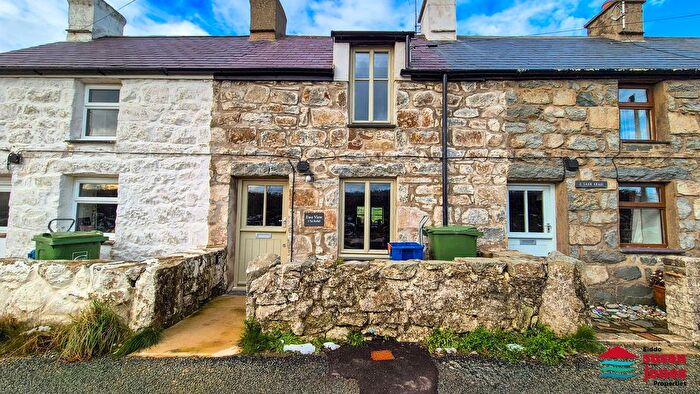
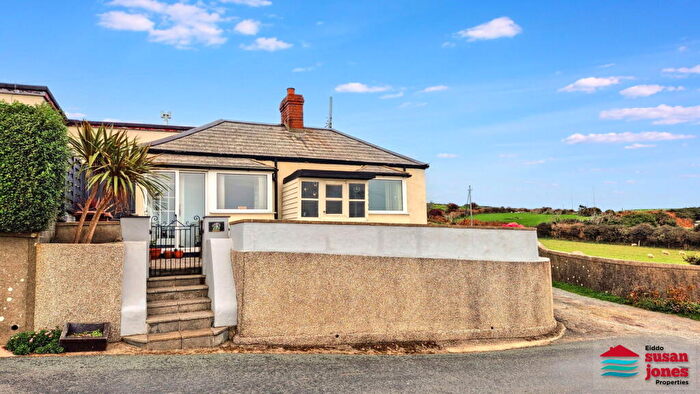
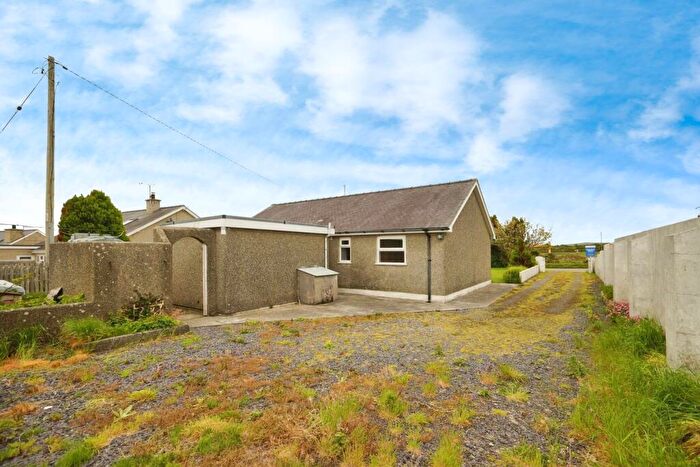
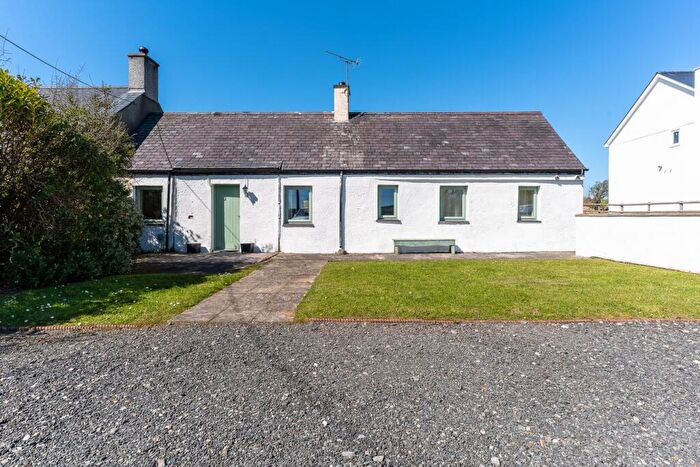
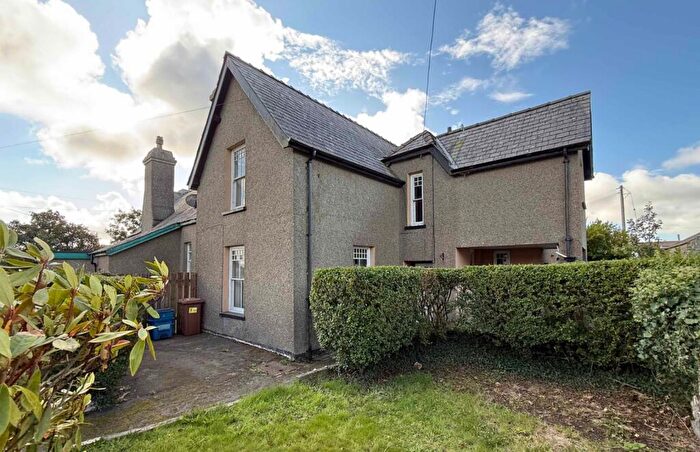
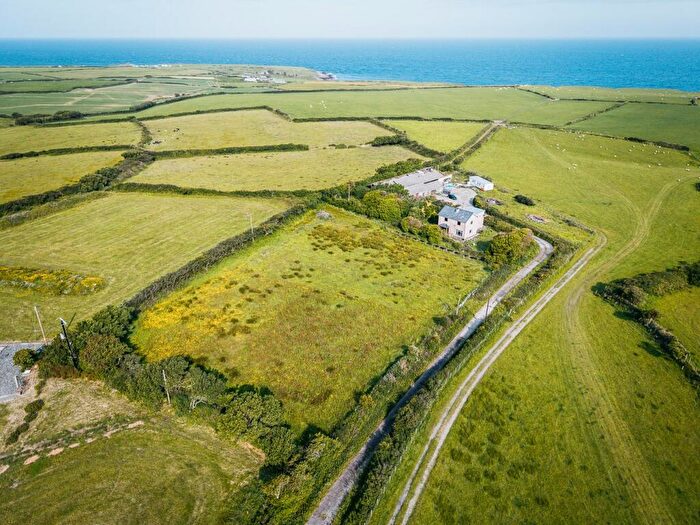
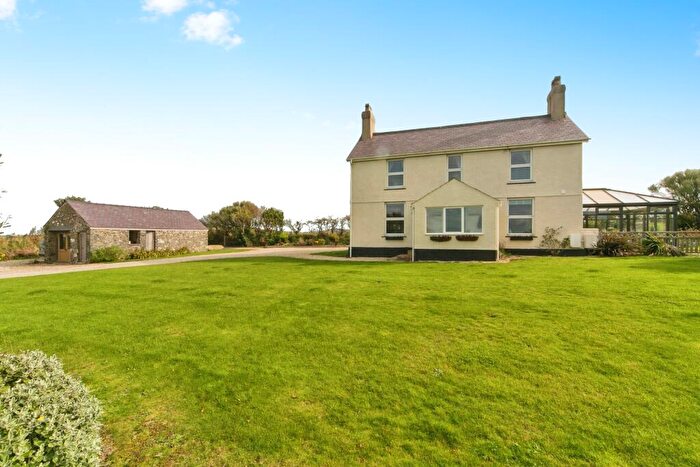
Houses for sale & to rent in Aberdaron, Pwllheli
House Prices in Aberdaron
Properties in Aberdaron have an average house price of £332,208.00 and had 24 Property Transactions within the last 3 years¹.
Aberdaron is an area in Pwllheli, Gwynedd - Gwynedd with 410 households², where the most expensive property was sold for £565,000.00.
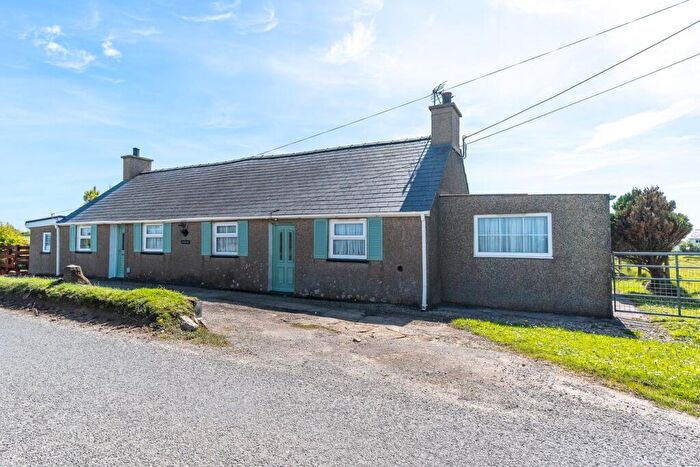
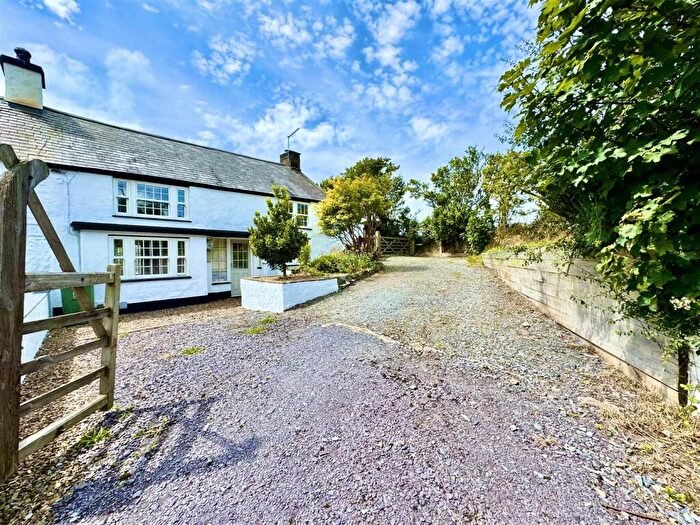
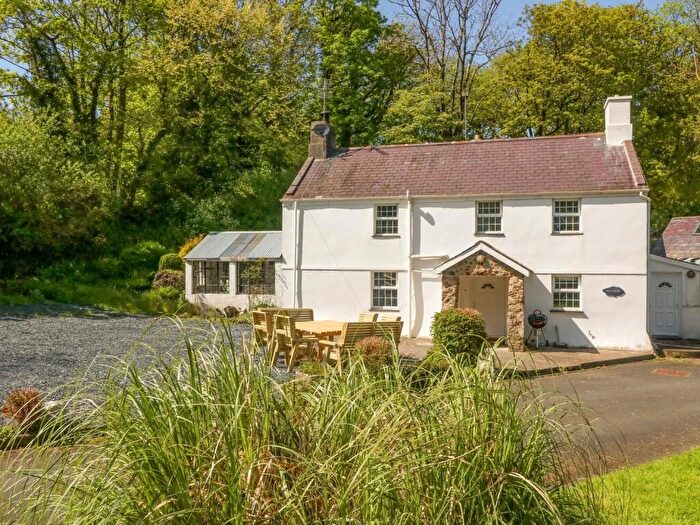
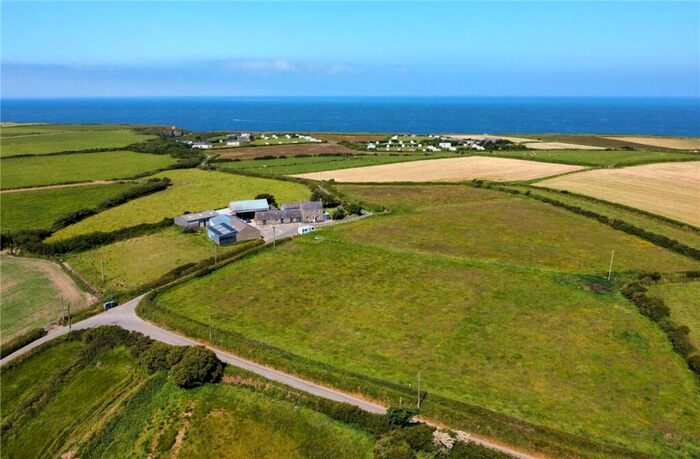
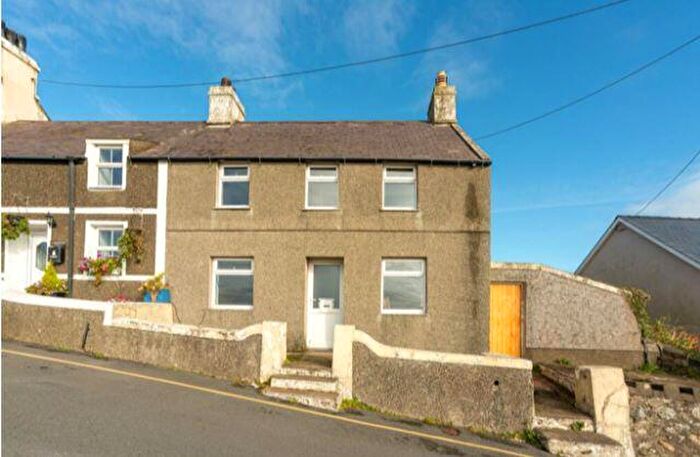
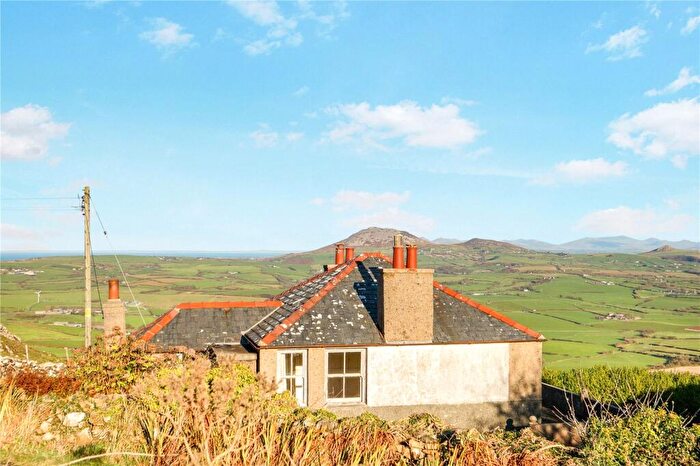
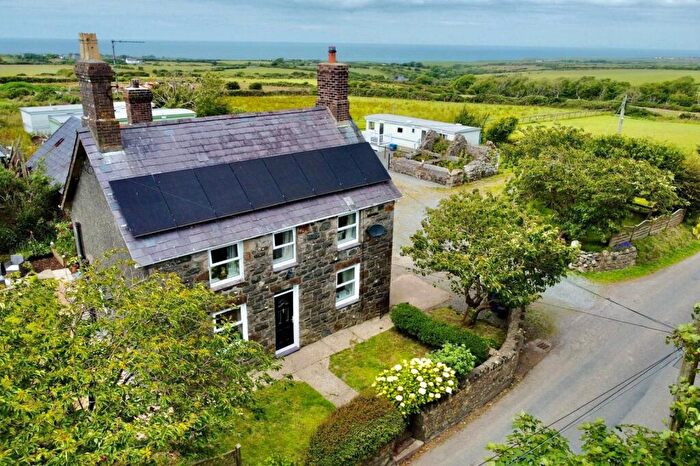
Properties for sale in Aberdaron
Previously listed properties in Aberdaron
Roads and Postcodes in Aberdaron
Navigate through our locations to find the location of your next house in Aberdaron, Pwllheli for sale or to rent.
| Streets | Postcodes |
|---|---|
| Anelog | LL53 8BT |
| Bardsey Island | LL53 8DE |
| Follet Close | LL53 8HH |
| LL53 8AB LL53 8AD LL53 8AE LL53 8AF LL53 8AG LL53 8AH LL53 8AL LL53 8AR LL53 8AS LL53 8AT LL53 8AU LL53 8AW LL53 8BD LL53 8BE LL53 8BG LL53 8BL LL53 8BN LL53 8BP LL53 8BS LL53 8BU LL53 8BW LL53 8BY LL53 8DA LL53 8DB LL53 8DD LL53 8HN LL53 8HR LL53 8HT LL53 8HW LL53 8LB LL53 8LD LL53 8LE LL53 8LF LL53 8LH LL53 8LL LL53 8LP LL53 8LW LL53 8AA LL53 8AN LL53 8AP LL53 8BH LL53 8HP LL53 8HS LL53 8HU LL53 8HY LL53 8LA LL53 8LG LL53 8LN |
Transport near Aberdaron
- FAQ
- Price Paid By Year
- Property Type Price
Frequently asked questions about Aberdaron
What is the average price for a property for sale in Aberdaron?
The average price for a property for sale in Aberdaron is £332,208. This amount is 7% higher than the average price in Pwllheli. There are 164 property listings for sale in Aberdaron.
Which train stations are available in or near Aberdaron?
Some of the train stations available in or near Aberdaron are Pwllheli, Abererch and Penychain.
Property Price Paid in Aberdaron by Year
The average sold property price by year was:
| Year | Average Sold Price | Price Change |
Sold Properties
|
|---|---|---|---|
| 2025 | £379,071 | 18% |
7 Properties |
| 2024 | £311,055 | -1% |
9 Properties |
| 2023 | £315,000 | -54% |
8 Properties |
| 2022 | £485,142 | 28% |
9 Properties |
| 2021 | £349,083 | 5% |
12 Properties |
| 2020 | £330,639 | 16% |
8 Properties |
| 2019 | £276,145 | 19% |
12 Properties |
| 2018 | £224,909 | -25% |
11 Properties |
| 2017 | £282,250 | 8% |
5 Properties |
| 2016 | £259,988 | 13% |
8 Properties |
| 2015 | £226,859 | -2% |
11 Properties |
| 2014 | £231,050 | 13% |
10 Properties |
| 2013 | £200,245 | -24% |
10 Properties |
| 2012 | £249,187 | 17% |
8 Properties |
| 2011 | £207,071 | -26% |
7 Properties |
| 2010 | £260,000 | -4% |
2 Properties |
| 2009 | £269,333 | 28% |
3 Properties |
| 2008 | £194,641 | -19% |
13 Properties |
| 2007 | £231,029 | 4% |
17 Properties |
| 2006 | £222,800 | 31% |
10 Properties |
| 2005 | £153,727 | -1% |
11 Properties |
| 2004 | £155,019 | 21% |
13 Properties |
| 2003 | £122,566 | 13% |
15 Properties |
| 2002 | £106,350 | 18% |
20 Properties |
| 2001 | £86,852 | 19% |
17 Properties |
| 2000 | £70,458 | 1% |
17 Properties |
| 1999 | £69,705 | 28% |
17 Properties |
| 1998 | £50,230 | 0,4% |
13 Properties |
| 1997 | £50,037 | 3% |
12 Properties |
| 1996 | £48,653 | 24% |
13 Properties |
| 1995 | £37,000 | - |
4 Properties |
Property Price per Property Type in Aberdaron
Here you can find historic sold price data in order to help with your property search.
The average Property Paid Price for specific property types in the last three years are:
| Property Type | Average Sold Price | Sold Properties |
|---|---|---|
| Detached House | £364,117.00 | 17 Detached Houses |
| Terraced House | £242,500.00 | 4 Terraced Houses |
| Semi Detached House | £271,000.00 | 3 Semi Detached Houses |

