
Houses for sale & to rent in Nantmel, Llandrindod Wells
House Prices in Nantmel
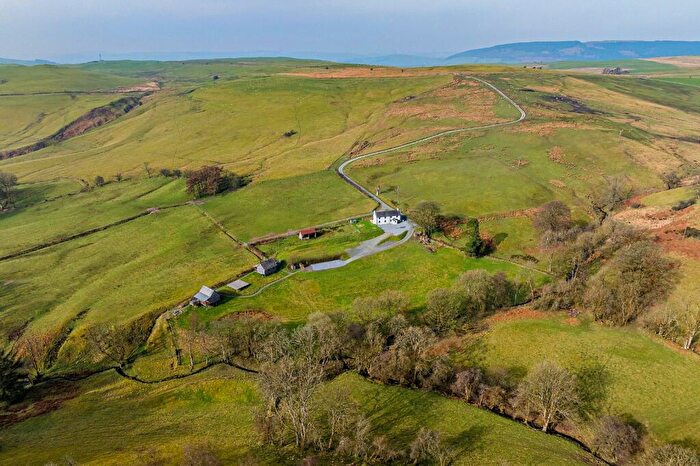
Properties in Nantmel have an average house price of £288k and had 19 Property Transactions within the last 3 years¹.
Nantmel is an area in Llandrindod Wells, Powys - Powys with 287 households², where the most expensive property was sold for £500k.
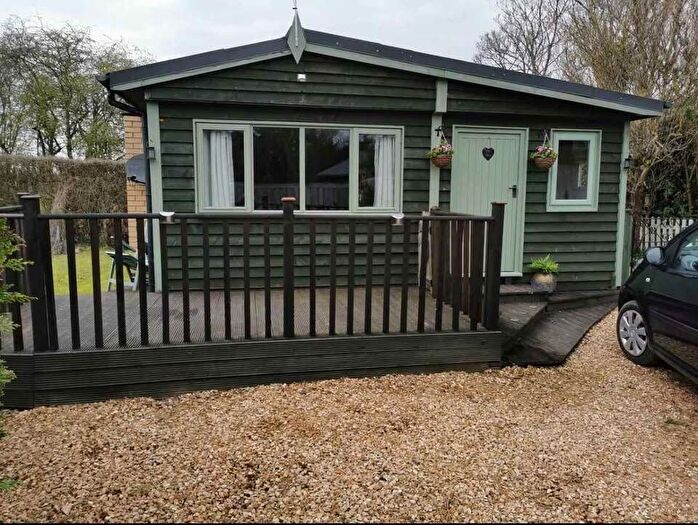
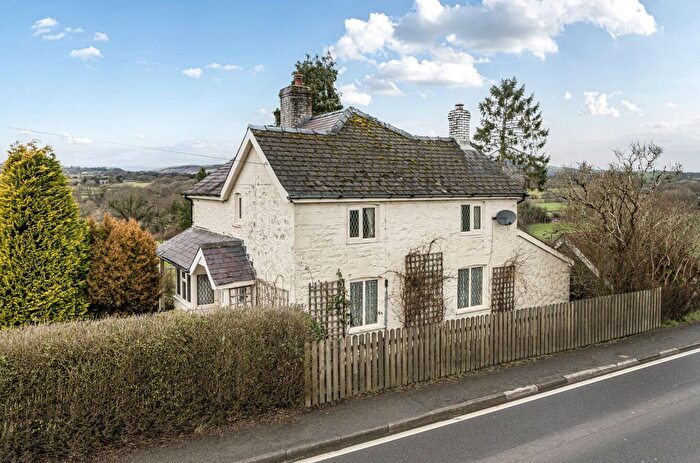
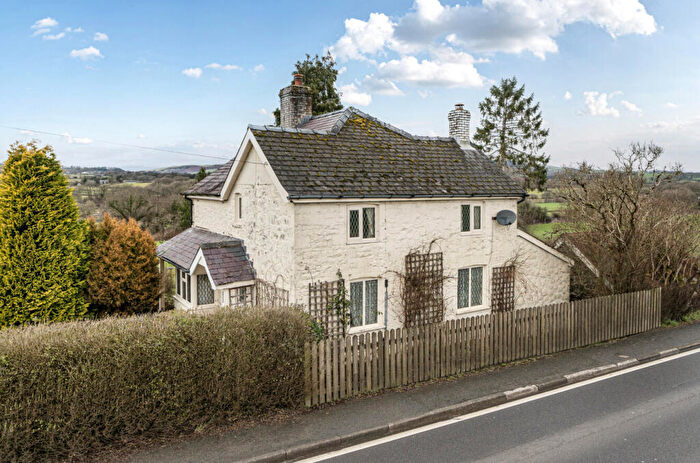
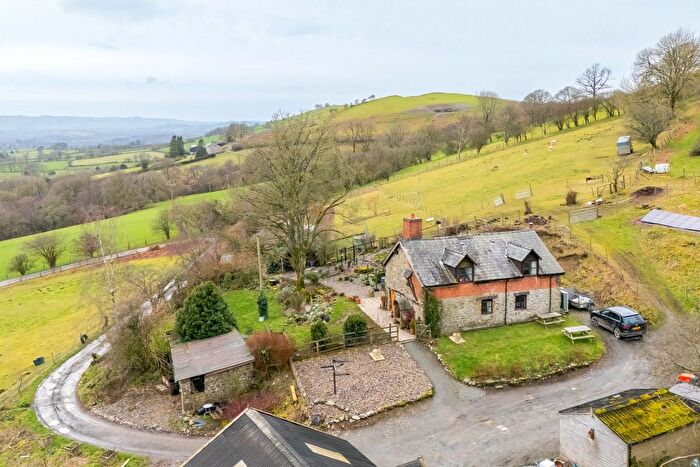
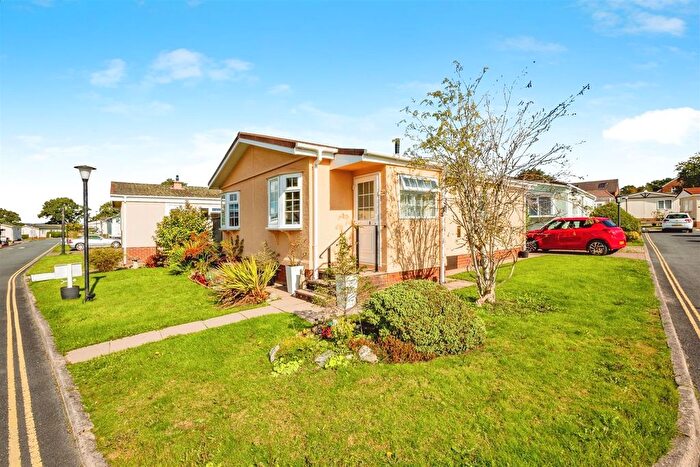
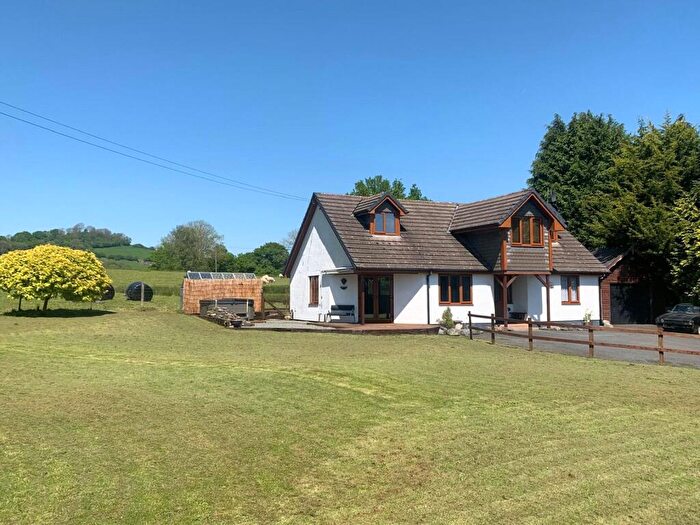
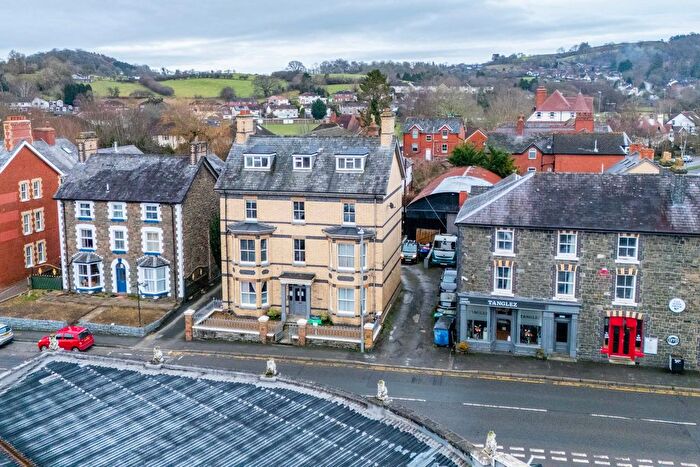
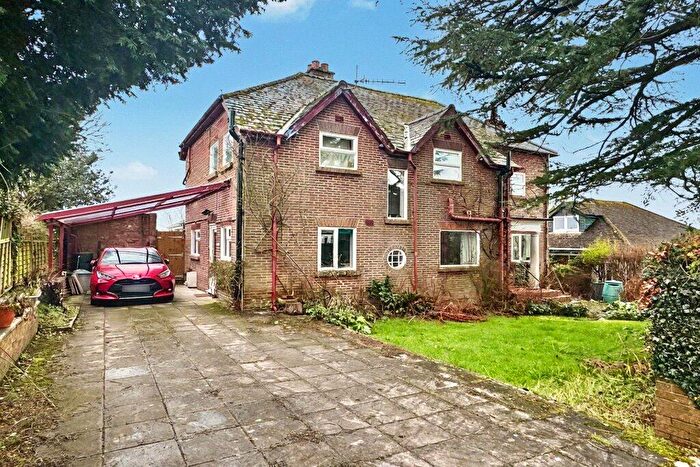
Properties for sale in Nantmel

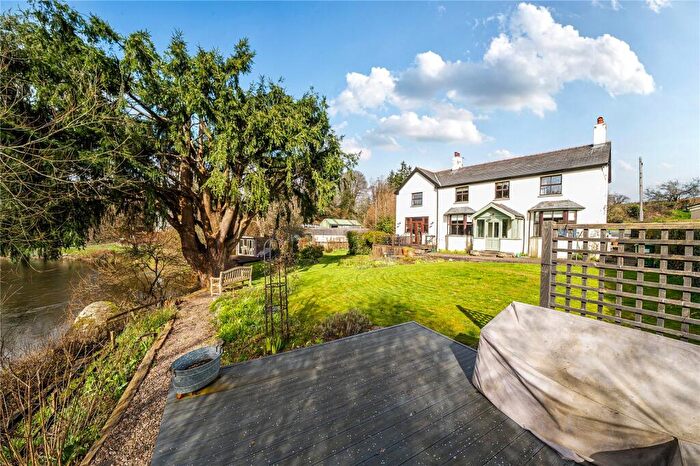
![]()
If you are looking to sell your house, let it out, or receive a property valuation, an expert can help you.
Click the button below to get started.

Roads and Postcodes in Nantmel
Navigate through our locations to find the location of your next house in Nantmel, Llandrindod Wells for sale or to rent.
| Streets | Postcodes |
|---|---|
| Argoed Mill | LD1 6HH |
| Brynicholas Road | LD1 6RW |
| Camlo Close | LD1 6RQ |
| Cornel Cottages | LD1 6NN |
| Cwmdu Cottage | LD1 6PP |
| Cwmhir Cottage | LD1 6PN |
| Gravel Road | LD1 6RG |
| Paddock Cottage | LD1 6PH |
| Talbot Place | LD1 6RL |
| LD1 6EH LD1 6EL LD1 6EN LD1 6EW LD1 6HF LD1 6PA LD1 6PB LD1 6PD LD1 6PG LD1 6PL LD1 6PS LD1 6RF LD1 6RH LD1 6RN LD1 6EG LD1 6NW LD1 6PR LD1 6PT LD1 6PU LD1 6PW |
Transport near Nantmel

- FAQ
- Price Paid By Year
- Property Type Price
Frequently asked questions about Nantmel
What is the average price for a property for sale in Nantmel?
The average price for a property for sale in Nantmel is £287,831. This amount is 26% higher than the average price in Llandrindod Wells. There are 1,225 property listings for sale in Nantmel.
What streets have the most expensive properties for sale in Nantmel?
The street with the most expensive properties for sale in Nantmel is Cornel Cottages at an average of £225,000.
What streets have the most affordable properties for sale in Nantmel?
The street with the most affordable properties for sale in Nantmel is Talbot Place at an average of £148,000.
Which train stations are available in or near Nantmel?
Some of the train stations available in or near Nantmel are Pen-Y-Bont, Llandrindod and Dolau.
Property Price Paid in Nantmel by Year
The average sold property price by year was:
| Year | Average Sold Price | Price Change |
Sold Properties
|
|---|---|---|---|
| 2025 | £271,350 | -4% |
8 Properties |
| 2024 | £282,000 | -14% |
6 Properties |
| 2023 | £321,200 | -25% |
5 Properties |
| 2022 | £402,666 | 8% |
9 Properties |
| 2021 | £371,062 | 9% |
8 Properties |
| 2020 | £337,000 | 20% |
9 Properties |
| 2019 | £269,777 | -6% |
9 Properties |
| 2018 | £286,318 | 16% |
11 Properties |
| 2017 | £241,250 | 3% |
6 Properties |
| 2016 | £232,916 | -6% |
6 Properties |
| 2015 | £247,945 | -3% |
10 Properties |
| 2014 | £254,571 | 13% |
7 Properties |
| 2013 | £222,500 | -5% |
2 Properties |
| 2012 | £234,500 | 27% |
4 Properties |
| 2011 | £171,625 | -44% |
4 Properties |
| 2010 | £247,400 | 0,2% |
5 Properties |
| 2009 | £247,000 | -2% |
6 Properties |
| 2008 | £251,000 | 15% |
3 Properties |
| 2007 | £212,540 | -31% |
11 Properties |
| 2006 | £279,391 | 18% |
9 Properties |
| 2005 | £228,125 | 18% |
4 Properties |
| 2004 | £186,045 | -7% |
11 Properties |
| 2003 | £199,859 | 16% |
11 Properties |
| 2002 | £167,850 | 43% |
5 Properties |
| 2001 | £95,200 | -4% |
5 Properties |
| 2000 | £98,835 | -1% |
10 Properties |
| 1999 | £99,428 | 21% |
7 Properties |
| 1998 | £78,500 | 12% |
3 Properties |
| 1997 | £68,991 | 14% |
6 Properties |
| 1996 | £59,312 | -19% |
4 Properties |
| 1995 | £70,333 | - |
3 Properties |
Property Price per Property Type in Nantmel
Here you can find historic sold price data in order to help with your property search.
The average Property Paid Price for specific property types in the last three years are:
| Property Type | Average Sold Price | Sold Properties |
|---|---|---|
| Semi Detached House | £229,375.00 | 4 Semi Detached Houses |
| Detached House | £303,420.00 | 15 Detached Houses |