
Houses for sale & to rent in Monmouth, Sir Fynwy - Monmouthshire
House Prices in Monmouth
Properties in Monmouth have an average house price of £372,990.00 and had 767 Property Transactions within the last 3 years.¹
Monmouth is an area in Sir Fynwy - Monmouthshire with 6,117 households², where the most expensive property was sold for £2,055,000.00.
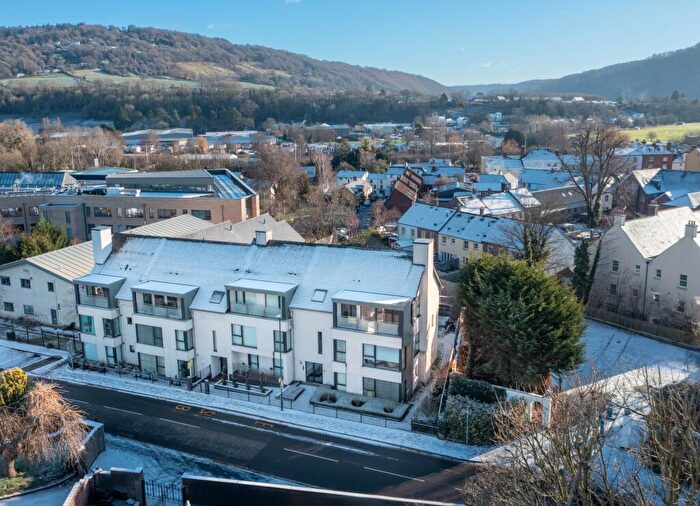
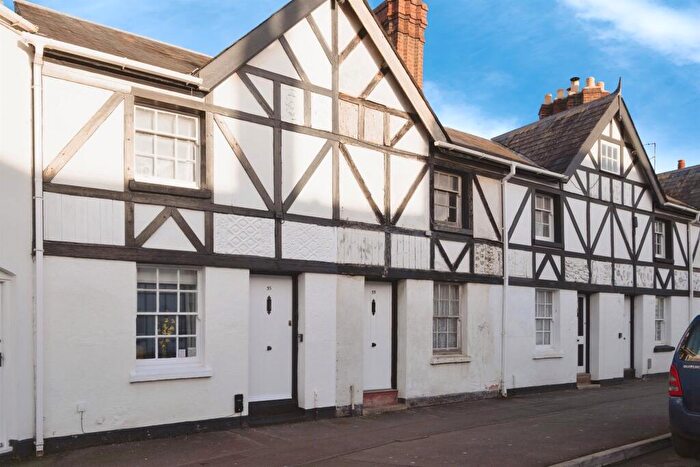
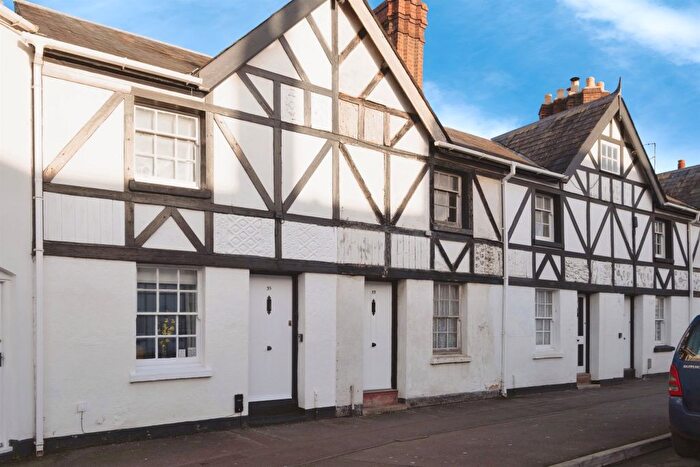
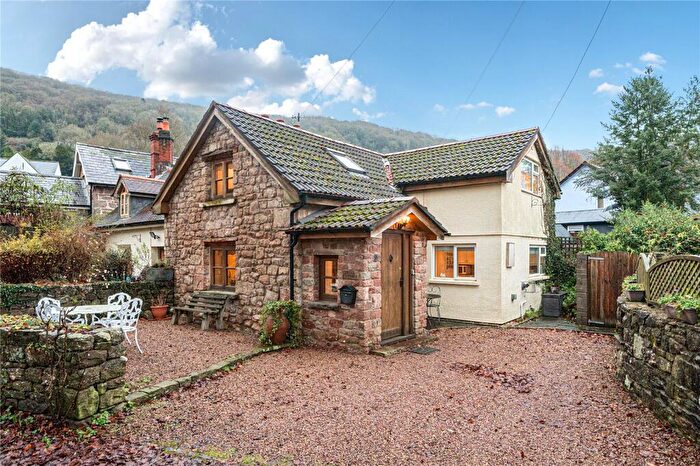
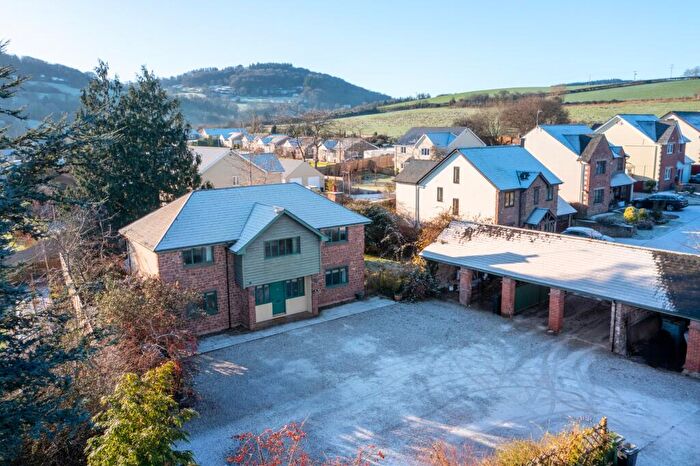
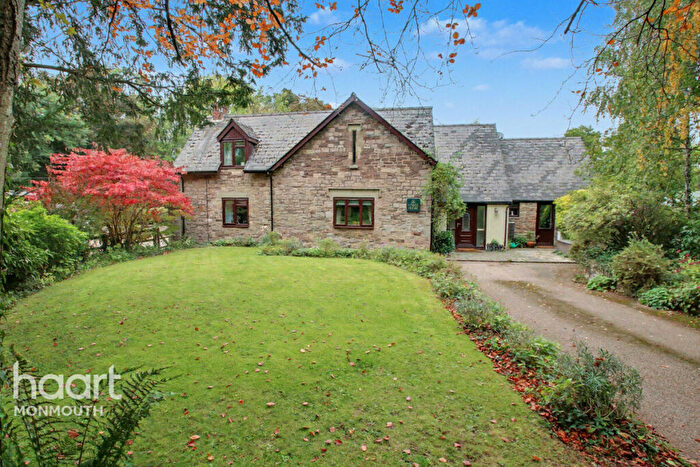
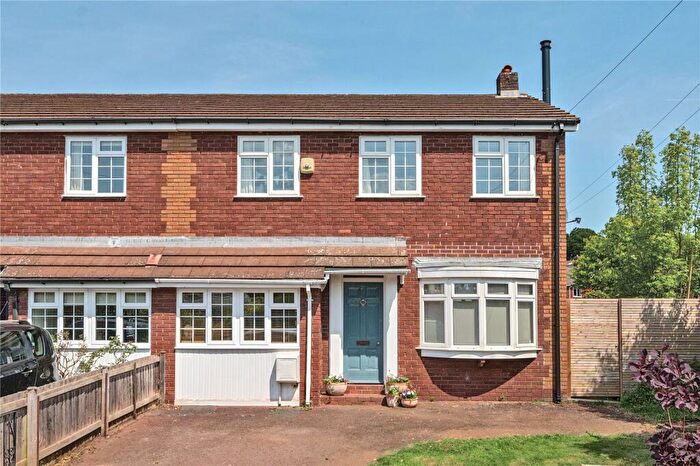
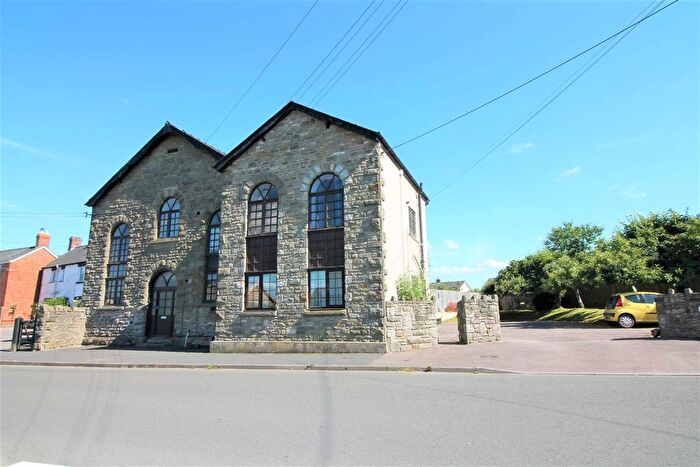
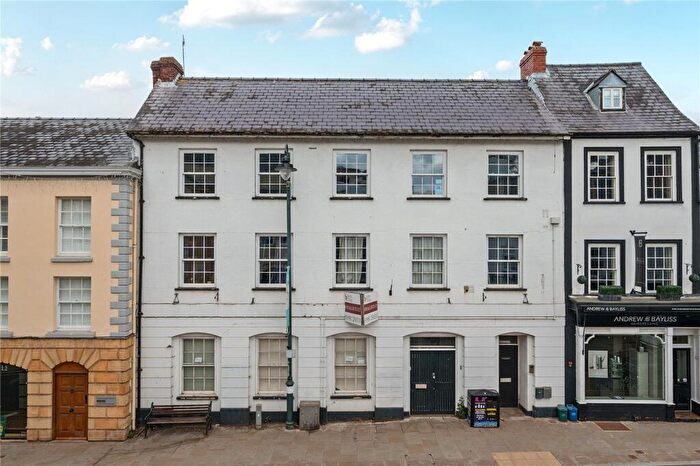
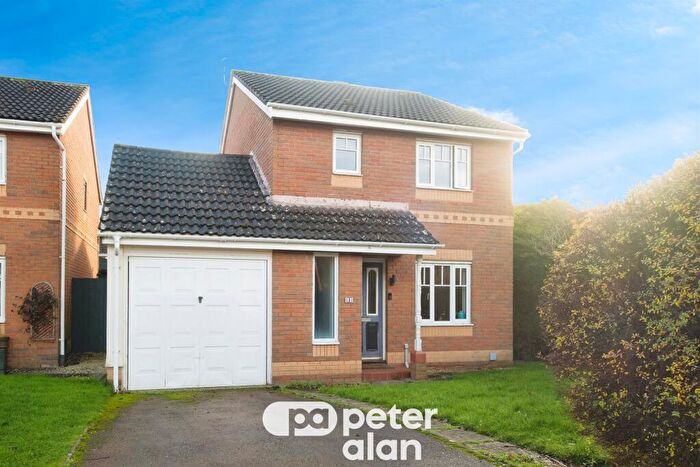
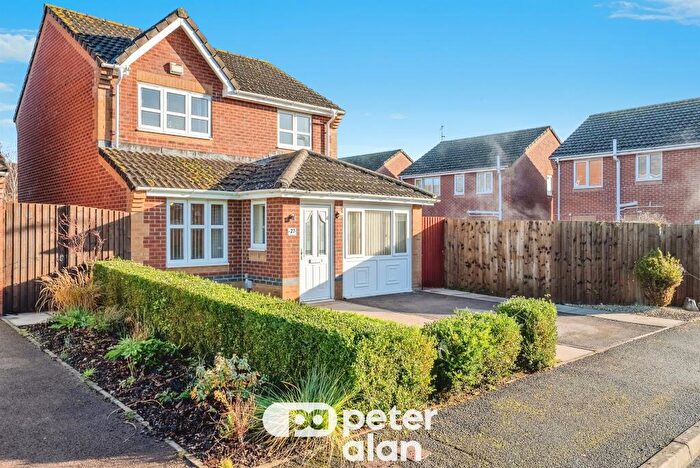
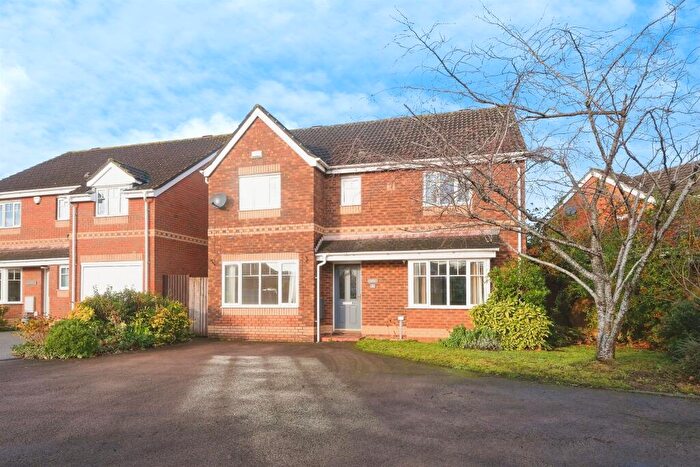
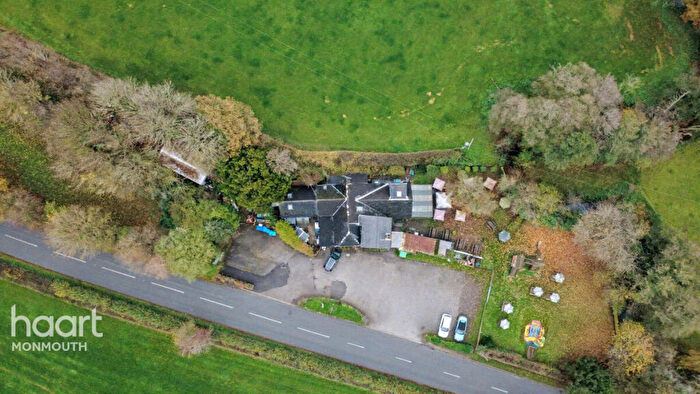
Properties for sale in Monmouth
![]()
If you are looking to sell your house, let it out, or receive a property valuation, an expert can help you.
Click the button below to get started.


Neighbourhoods in Monmouth
Navigate through our locations to find the location of your next house in Monmouth, Sir Fynwy - Monmouthshire for sale or to rent.
Transport in Monmouth
Please see below transportation links in this area:

- FAQ
- Price Paid By Year
- Property Type Price
Frequently asked questions about Monmouth
What is the average price for a property for sale in Monmouth?
The average price for a property for sale in Monmouth is £372,990. This amount is 5% higher than the average price in Sir Fynwy - Monmouthshire. There are 2,836 property listings for sale in Monmouth.
What locations have the most expensive properties for sale in Monmouth?
The locations with the most expensive properties for sale in Monmouth are Raglan at an average of £1,135,000, Llantilio Crossenny at an average of £720,062 and Trellech United at an average of £559,543.
What locations have the most affordable properties for sale in Monmouth?
The locations with the most affordable properties for sale in Monmouth are Overmonnow at an average of £218,598, Wyesham at an average of £274,473 and Drybridge at an average of £324,114.
Which train stations are available in or near Monmouth?
Some of the train stations available in or near Monmouth are Lydney, Chepstow and Abergavenny.
Property Price Paid in Monmouth by Year
The average sold property price by year was:
| Year | Average Sold Price | Price Change |
Sold Properties
|
|---|---|---|---|
| 2025 | £361,336 | -4% |
138 Properties |
| 2024 | £376,775 | -3% |
214 Properties |
| 2023 | £388,536 | 7% |
195 Properties |
| 2022 | £362,839 | 1% |
220 Properties |
| 2021 | £360,030 | 8% |
325 Properties |
| 2020 | £330,564 | 9% |
223 Properties |
| 2019 | £301,832 | 4% |
283 Properties |
| 2018 | £289,654 | 2% |
299 Properties |
| 2017 | £282,446 | -2% |
336 Properties |
| 2016 | £288,711 | 13% |
278 Properties |
| 2015 | £250,892 | -2% |
263 Properties |
| 2014 | £254,966 | 9% |
264 Properties |
| 2013 | £232,489 | 2% |
249 Properties |
| 2012 | £228,877 | -10% |
191 Properties |
| 2011 | £252,619 | 8% |
183 Properties |
| 2010 | £233,358 | -1% |
185 Properties |
| 2009 | £236,521 | -6% |
173 Properties |
| 2008 | £250,559 | 0,2% |
123 Properties |
| 2007 | £250,094 | 2% |
271 Properties |
| 2006 | £244,505 | 9% |
302 Properties |
| 2005 | £222,263 | 14% |
294 Properties |
| 2004 | £190,353 | 9% |
396 Properties |
| 2003 | £173,386 | 17% |
324 Properties |
| 2002 | £143,775 | 13% |
328 Properties |
| 2001 | £125,608 | 14% |
293 Properties |
| 2000 | £108,000 | 11% |
327 Properties |
| 1999 | £96,520 | 14% |
296 Properties |
| 1998 | £82,569 | 3% |
224 Properties |
| 1997 | £80,429 | 4% |
233 Properties |
| 1996 | £77,586 | 10% |
210 Properties |
| 1995 | £69,551 | - |
171 Properties |
Property Price per Property Type in Monmouth
Here you can find historic sold price data in order to help with your property search.
The average Property Paid Price for specific property types in the last three years are:
| Property Type | Average Sold Price | Sold Properties |
|---|---|---|
| Semi Detached House | £288,391.00 | 198 Semi Detached Houses |
| Detached House | £513,494.00 | 348 Detached Houses |
| Terraced House | £270,585.00 | 128 Terraced Houses |
| Flat | £168,290.00 | 93 Flats |