
Houses for sale & to rent in Chepstow, Sir Fynwy - Monmouthshire
House Prices in Chepstow
Properties in Chepstow have an average house price of £372,940.00 and had 882 Property Transactions within the last 3 years.¹
Chepstow is an area in Sir Fynwy - Monmouthshire with 7,422 households², where the most expensive property was sold for £1,610,000.00.
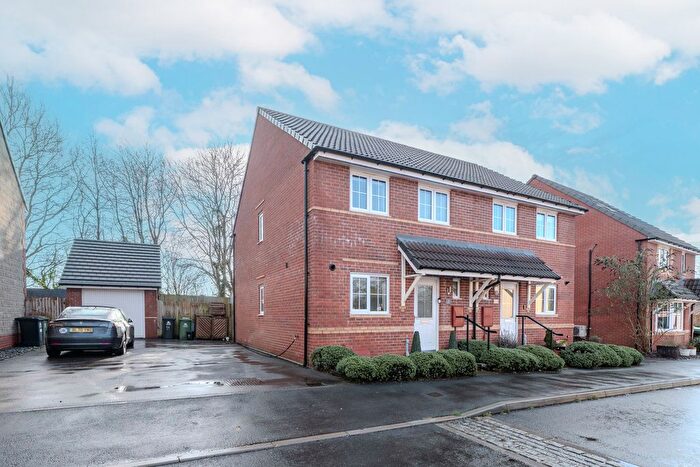
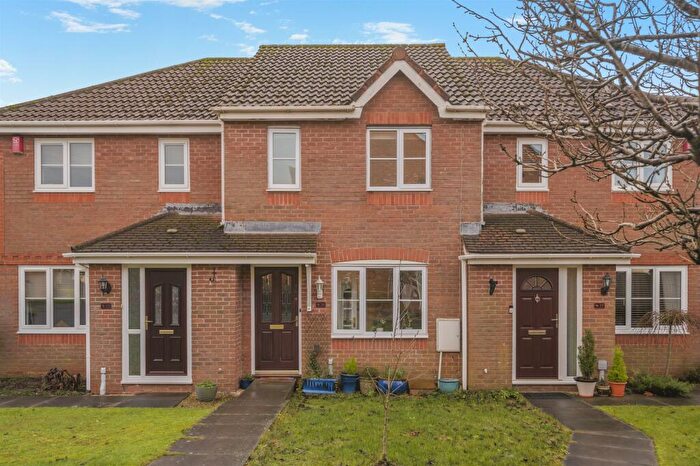
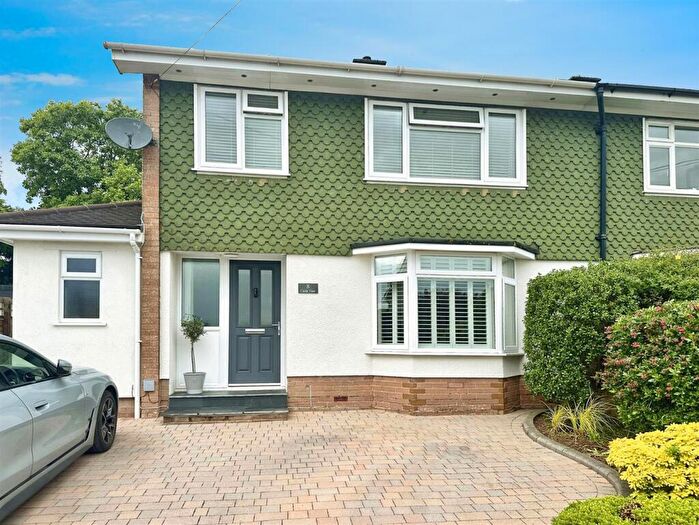
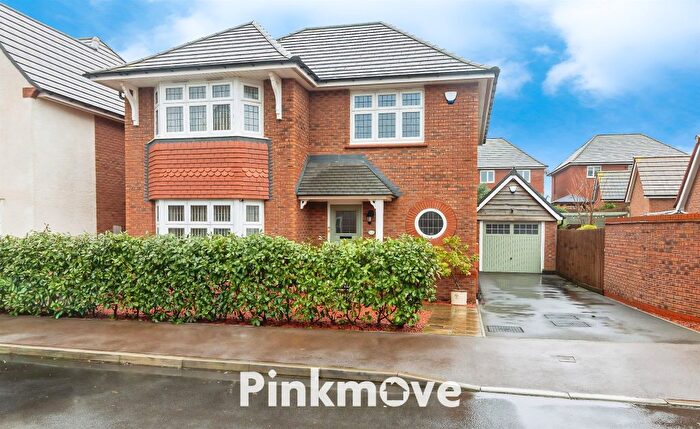
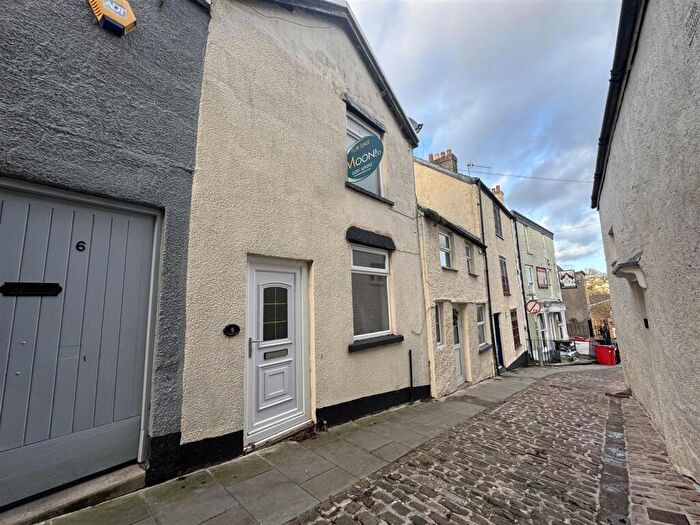
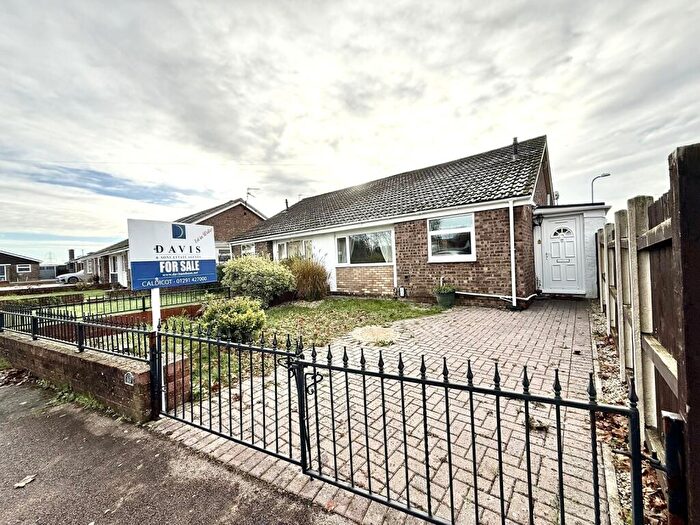
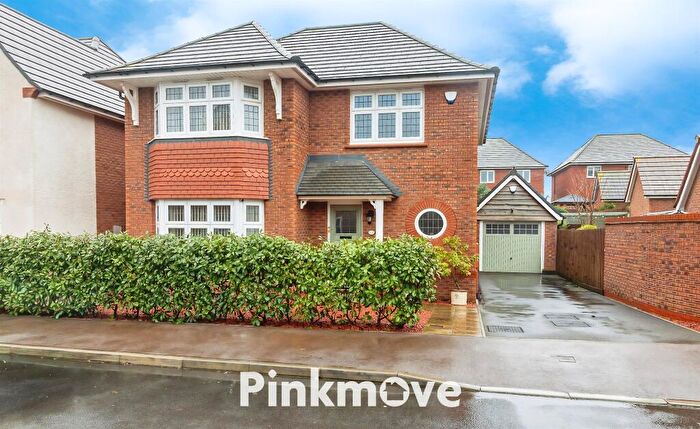
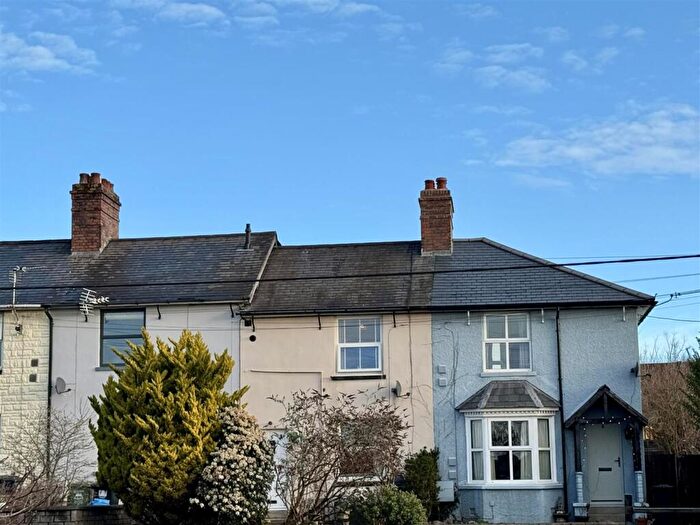
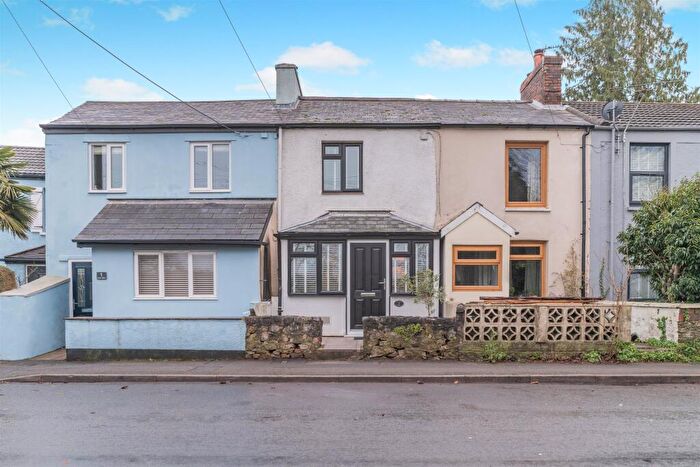
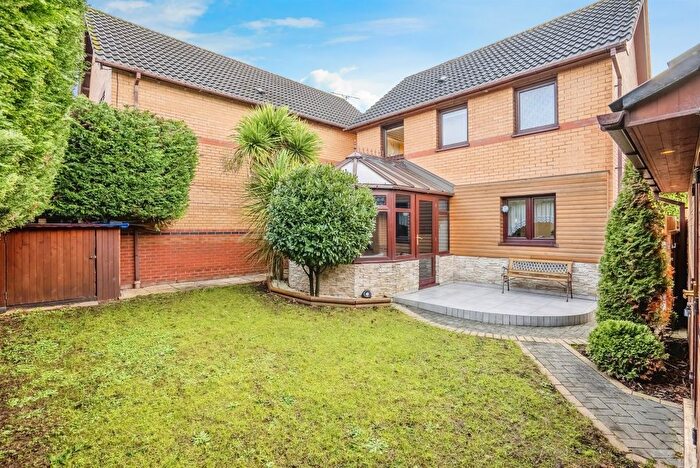
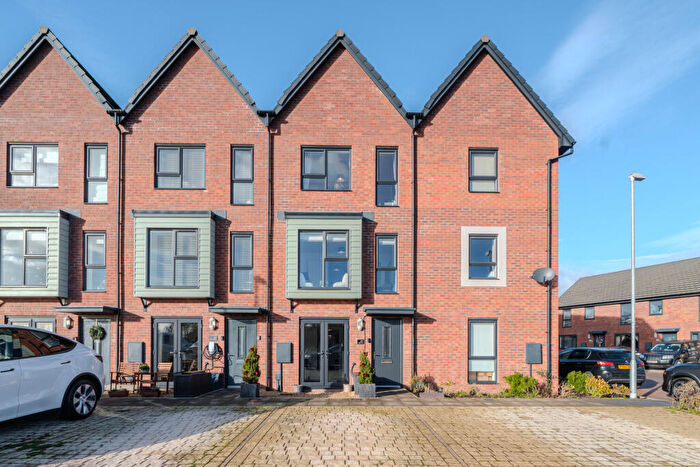
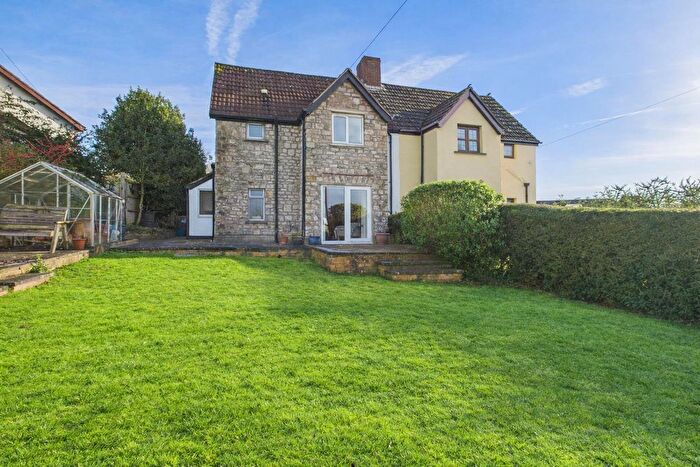
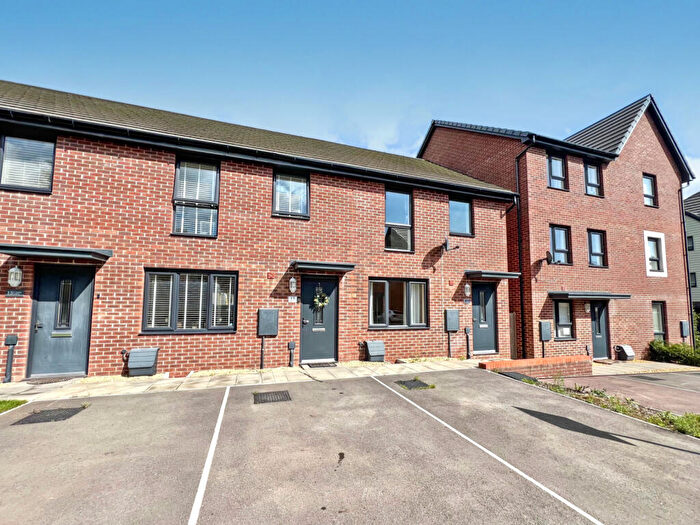
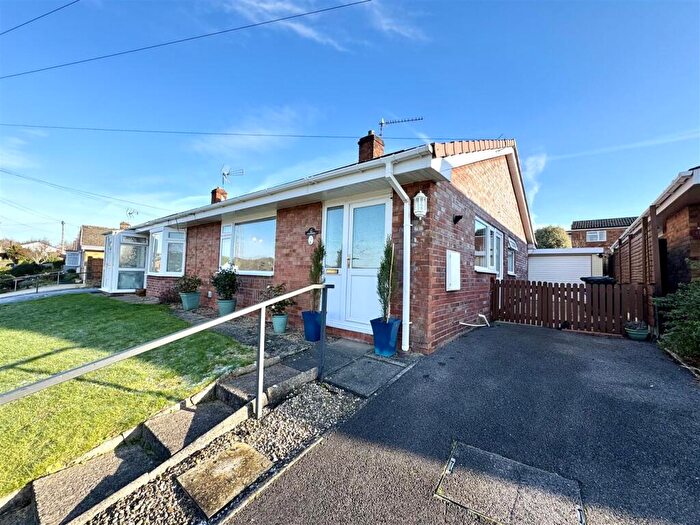
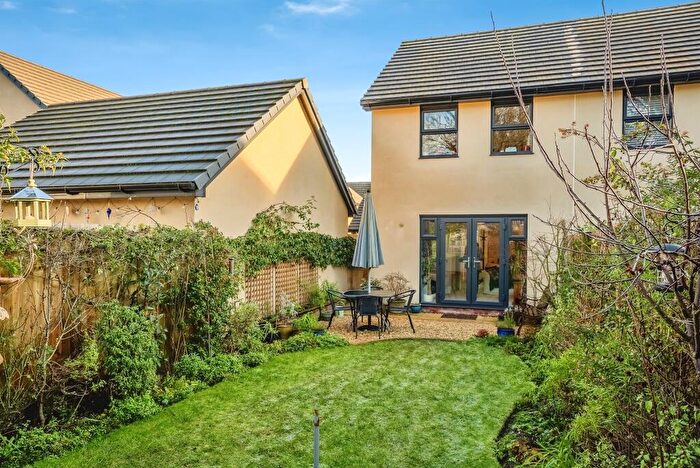
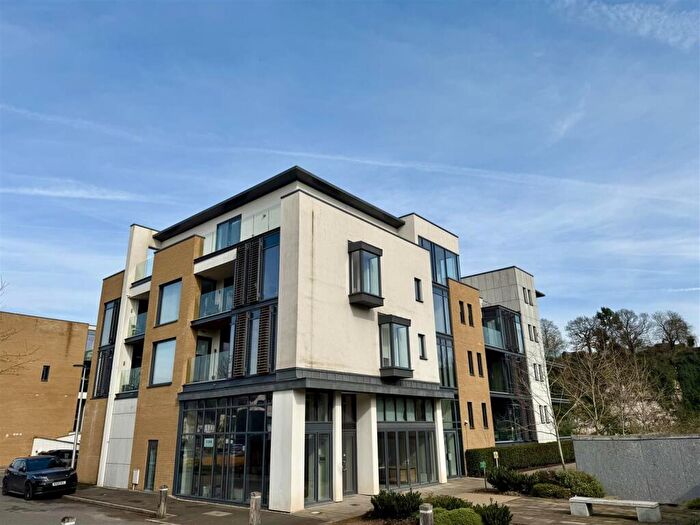
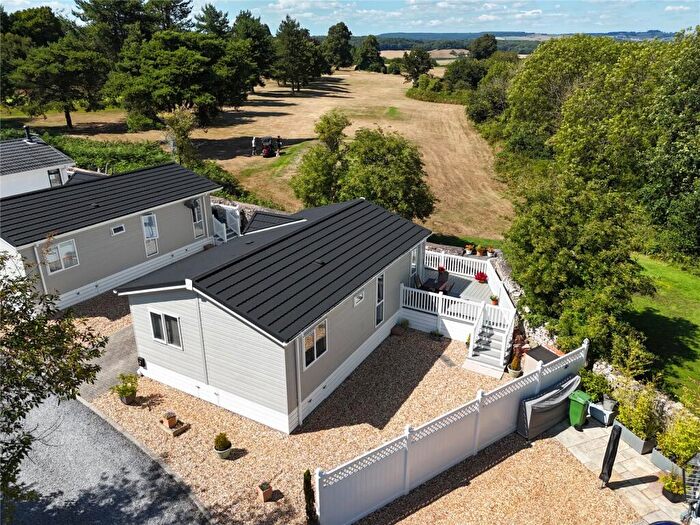
Properties for sale in Chepstow

![]()
If you are looking to sell your house, let it out, or receive a property valuation, an expert can help you.
Click the button below to get started.


Neighbourhoods in Chepstow
Navigate through our locations to find the location of your next house in Chepstow, Sir Fynwy - Monmouthshire for sale or to rent.
Transport in Chepstow
Please see below transportation links in this area:
-
 Chepstow Station
 -
Caldicot Station
-
Severn Tunnel Junction Station
-
Severn Beach Station
-
Pilning Station
-
Lydney Station
-
St.Andrew's Road Station
- FAQ
- Price Paid By Year
- Property Type Price
Frequently asked questions about Chepstow
What is the average price for a property for sale in Chepstow?
The average price for a property for sale in Chepstow is £372,940. This amount is 5% higher than the average price in Sir Fynwy - Monmouthshire. There are 4,220 property listings for sale in Chepstow.
What locations have the most expensive properties for sale in Chepstow?
The locations with the most expensive properties for sale in Chepstow are Devauden at an average of £627,153, Shirenewton at an average of £613,852 and Caerwent at an average of £588,245.
What locations have the most affordable properties for sale in Chepstow?
The locations with the most affordable properties for sale in Chepstow are St. Christophers at an average of £249,479, Thornwell at an average of £258,172 and St. Marys at an average of £273,998.
Which train stations are available in or near Chepstow?
Some of the train stations available in or near Chepstow are Chepstow, Caldicot and Severn Tunnel Junction.
Property Price Paid in Chepstow by Year
The average sold property price by year was:
| Year | Average Sold Price | Price Change |
Sold Properties
|
|---|---|---|---|
| 2025 | £380,043 | 5% |
157 Properties |
| 2024 | £362,064 | -2% |
231 Properties |
| 2023 | £368,435 | -4% |
230 Properties |
| 2022 | £382,157 | 11% |
264 Properties |
| 2021 | £340,343 | -4% |
394 Properties |
| 2020 | £355,249 | 17% |
190 Properties |
| 2019 | £295,627 | 3% |
228 Properties |
| 2018 | £286,590 | 3% |
252 Properties |
| 2017 | £278,335 | 4% |
287 Properties |
| 2016 | £267,021 | 6% |
359 Properties |
| 2015 | £250,829 | 8% |
329 Properties |
| 2014 | £231,417 | 5% |
293 Properties |
| 2013 | £219,689 | -3% |
251 Properties |
| 2012 | £226,526 | 1% |
215 Properties |
| 2011 | £223,878 | -7% |
241 Properties |
| 2010 | £239,141 | 10% |
224 Properties |
| 2009 | £214,154 | -5% |
183 Properties |
| 2008 | £225,484 | -2% |
193 Properties |
| 2007 | £230,602 | 6% |
377 Properties |
| 2006 | £215,704 | 2% |
378 Properties |
| 2005 | £210,896 | 7% |
309 Properties |
| 2004 | £196,619 | 10% |
432 Properties |
| 2003 | £176,475 | 15% |
451 Properties |
| 2002 | £150,274 | 18% |
563 Properties |
| 2001 | £122,892 | 14% |
421 Properties |
| 2000 | £106,122 | 9% |
390 Properties |
| 1999 | £96,511 | 8% |
443 Properties |
| 1998 | £89,143 | 16% |
323 Properties |
| 1997 | £75,090 | 10% |
401 Properties |
| 1996 | £67,871 | -4% |
320 Properties |
| 1995 | £70,576 | - |
260 Properties |
Property Price per Property Type in Chepstow
Here you can find historic sold price data in order to help with your property search.
The average Property Paid Price for specific property types in the last three years are:
| Property Type | Average Sold Price | Sold Properties |
|---|---|---|
| Semi Detached House | £297,142.00 | 175 Semi Detached Houses |
| Detached House | £522,558.00 | 370 Detached Houses |
| Terraced House | £258,681.00 | 260 Terraced Houses |
| Flat | £212,077.00 | 77 Flats |