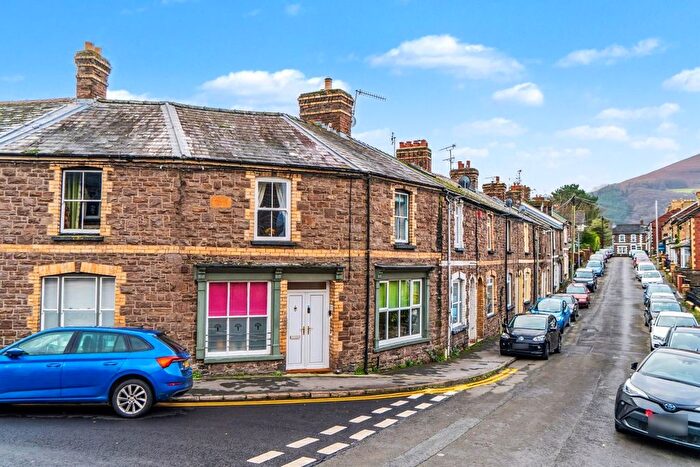
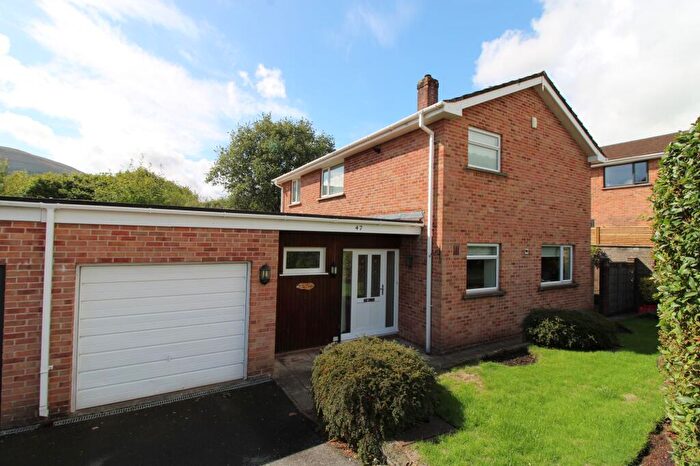
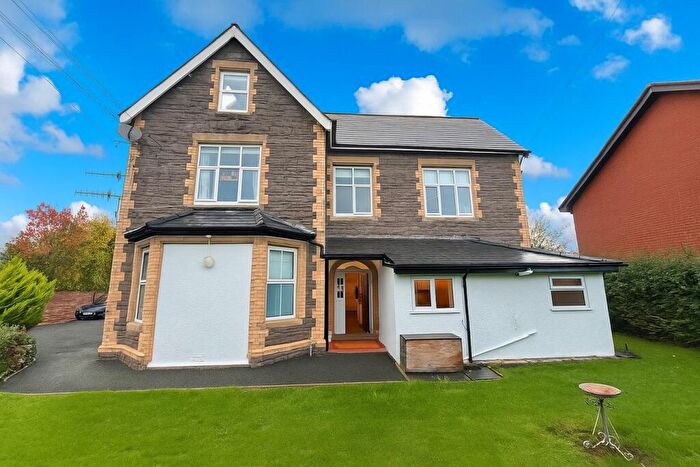
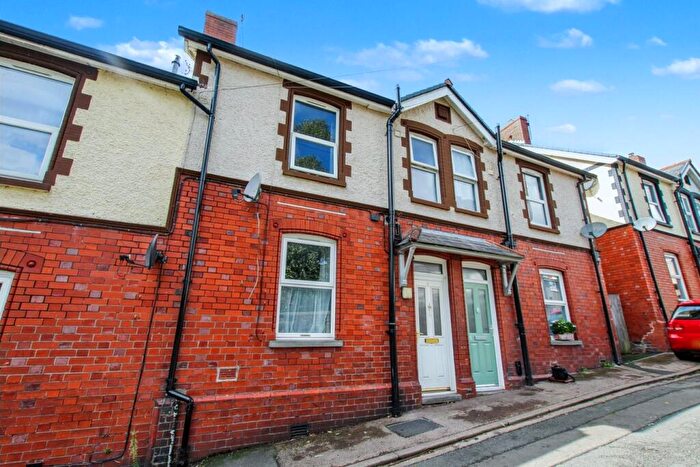
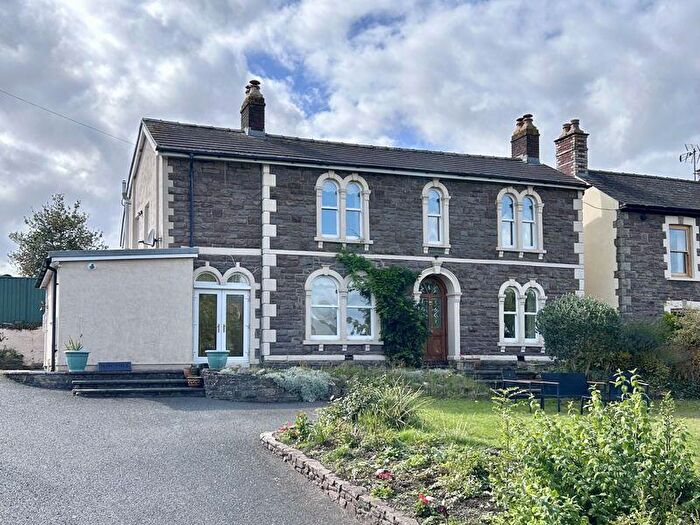
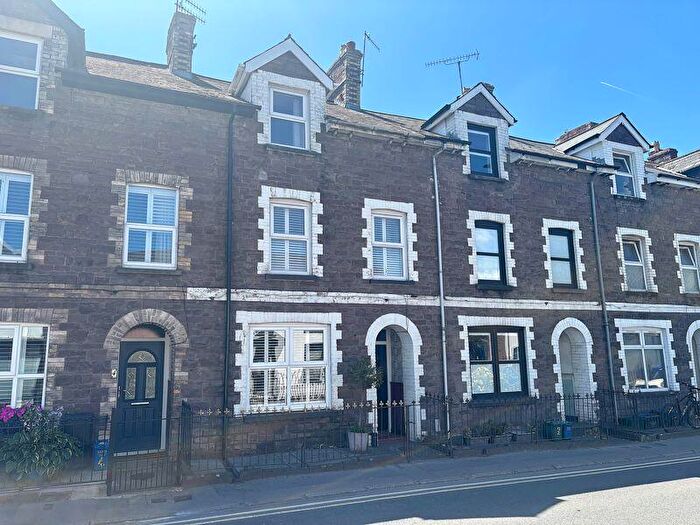
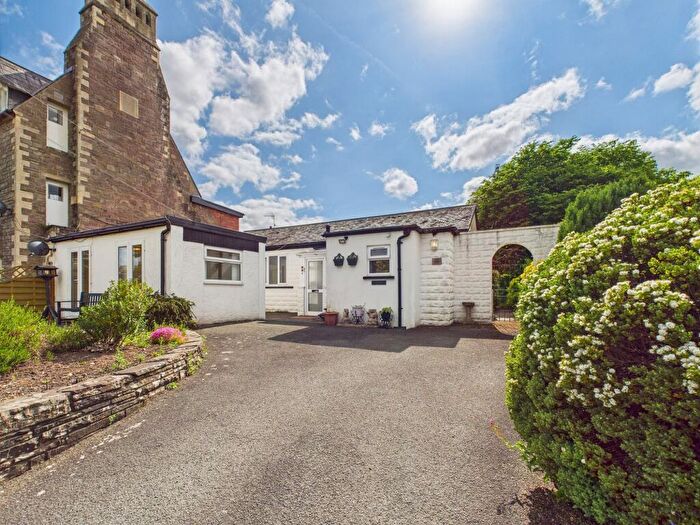
Houses for sale & to rent in Cantref, Abergavenny
House Prices in Cantref
Properties in Cantref have an average house price of £411,686.00 and had 130 Property Transactions within the last 3 years¹.
Cantref is an area in Abergavenny, Sir Fynwy - Monmouthshire with 898 households², where the most expensive property was sold for £1,471,800.00.
Properties for sale in Cantref
Roads and Postcodes in Cantref
Navigate through our locations to find the location of your next house in Cantref, Abergavenny for sale or to rent.
| Streets | Postcodes |
|---|---|
| Albany Road | NP7 7BD |
| Avenue Crescent | NP7 7DE |
| Avenue Road | NP7 7DA NP7 7DB NP7 7DD |
| Belgrave Close | NP7 7AP |
| Belgrave Road | NP7 7AG NP7 7AH NP7 7AL |
| Brecon Road | NP7 5UH NP7 7RA NP7 7RD NP7 7RE NP7 5AQ NP7 7RU |
| Cantref Road | NP7 7DL |
| Chain Close | NP7 7BR |
| Chain Lane | NP7 7HH |
| Chain Road | NP7 7BS NP7 7HL |
| Chapel Lane | NP7 7BT |
| Chapel Orchard | NP7 7BQ |
| Chapel Road | NP7 7BL NP7 7BN NP7 7DN NP7 7DP NP7 7DR NP7 7DS NP7 7DW |
| Cresta Road | NP7 7AT NP7 7AU |
| Delafield Road | NP7 7AW |
| Dingle Road | NP7 7AR |
| Frogmore Street | NP7 5AL |
| Harold Road | NP7 7DG |
| Haven Way | NP7 7BA |
| Knoll Gardens | NP7 7EJ |
| Knoll Road | NP7 7AE NP7 7AN |
| Linden Avenue | NP7 7DF |
| Meadow Lane | NP7 7AY |
| Mount Street | NP7 7DT |
| North Street | NP7 7EA NP7 7EB NP7 7ED |
| Orchard Close | NP7 7EE |
| Orchard Street | NP7 7DU NP7 7DY |
| Pen Y Pound | NP7 5UD NP7 7RN NP7 7RW |
| Pentre Lane | NP7 7HE |
| Pentre Road | NP7 7BE NP7 7BH NP7 7HF |
| Penypound Court | NP7 7RJ |
| St Michaels Road | NP7 5AY |
| Stanhope Street | NP7 7DH |
| Western Road | NP7 7AA NP7 7AB NP7 7AD |
| Windsor Road | NP7 7BB |
| NP7 7BW NP7 7EW NP7 7HG NP7 7HU NP7 7HY NP7 7EN NP7 7HA |
Transport near Cantref
-
Abergavenny Station
-
Ebbw Vale Town Station
-
Ebbw Vale Parkway Station
-
Pontypool and New Inn Station
-
Llanhilleth Station
- FAQ
- Price Paid By Year
- Property Type Price
Frequently asked questions about Cantref
What is the average price for a property for sale in Cantref?
The average price for a property for sale in Cantref is £411,686. This amount is 21% higher than the average price in Abergavenny. There are 112 property listings for sale in Cantref.
What streets have the most expensive properties for sale in Cantref?
The streets with the most expensive properties for sale in Cantref are Chapel Orchard at an average of £925,000, Avenue Crescent at an average of £721,666 and Windsor Road at an average of £650,000.
What streets have the most affordable properties for sale in Cantref?
The streets with the most affordable properties for sale in Cantref are Frogmore Street at an average of £170,000, Stanhope Street at an average of £246,590 and Mount Street at an average of £308,600.
Which train stations are available in or near Cantref?
Some of the train stations available in or near Cantref are Abergavenny, Ebbw Vale Town and Ebbw Vale Parkway.
Property Price Paid in Cantref by Year
The average sold property price by year was:
| Year | Average Sold Price | Price Change |
Sold Properties
|
|---|---|---|---|
| 2025 | £447,980 | -2% |
28 Properties |
| 2024 | £456,272 | 24% |
34 Properties |
| 2023 | £348,359 | -14% |
32 Properties |
| 2022 | £397,638 | 9% |
36 Properties |
| 2021 | £363,589 | 1% |
35 Properties |
| 2020 | £359,672 | 14% |
23 Properties |
| 2019 | £310,028 | -13% |
32 Properties |
| 2018 | £349,195 | 19% |
30 Properties |
| 2017 | £282,747 | -7% |
40 Properties |
| 2016 | £301,414 | 9% |
44 Properties |
| 2015 | £273,862 | -8% |
40 Properties |
| 2014 | £295,656 | 25% |
34 Properties |
| 2013 | £222,439 | -25% |
35 Properties |
| 2012 | £278,286 | 18% |
33 Properties |
| 2011 | £228,526 | -8% |
19 Properties |
| 2010 | £246,962 | -2% |
28 Properties |
| 2009 | £253,000 | 7% |
28 Properties |
| 2008 | £235,782 | -19% |
14 Properties |
| 2007 | £279,912 | 13% |
41 Properties |
| 2006 | £242,692 | 3% |
42 Properties |
| 2005 | £234,337 | 12% |
28 Properties |
| 2004 | £205,661 | 16% |
34 Properties |
| 2003 | £172,789 | 11% |
33 Properties |
| 2002 | £153,947 | 21% |
42 Properties |
| 2001 | £121,827 | 8% |
25 Properties |
| 2000 | £112,156 | 4% |
43 Properties |
| 1999 | £107,916 | 16% |
34 Properties |
| 1998 | £90,874 | -11% |
35 Properties |
| 1997 | £100,672 | 11% |
46 Properties |
| 1996 | £89,250 | 19% |
24 Properties |
| 1995 | £71,911 | - |
30 Properties |
Property Price per Property Type in Cantref
Here you can find historic sold price data in order to help with your property search.
The average Property Paid Price for specific property types in the last three years are:
| Property Type | Average Sold Price | Sold Properties |
|---|---|---|
| Semi Detached House | £414,922.00 | 33 Semi Detached Houses |
| Detached House | £540,556.00 | 52 Detached Houses |
| Terraced House | £292,413.00 | 30 Terraced Houses |
| Flat | £196,360.00 | 15 Flats |

