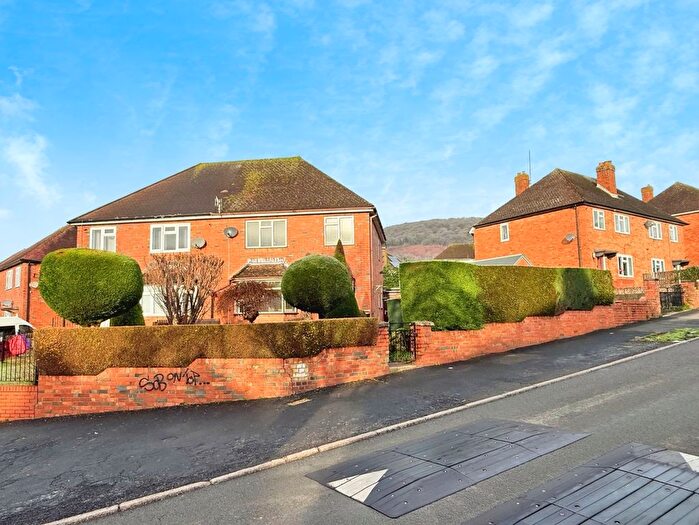
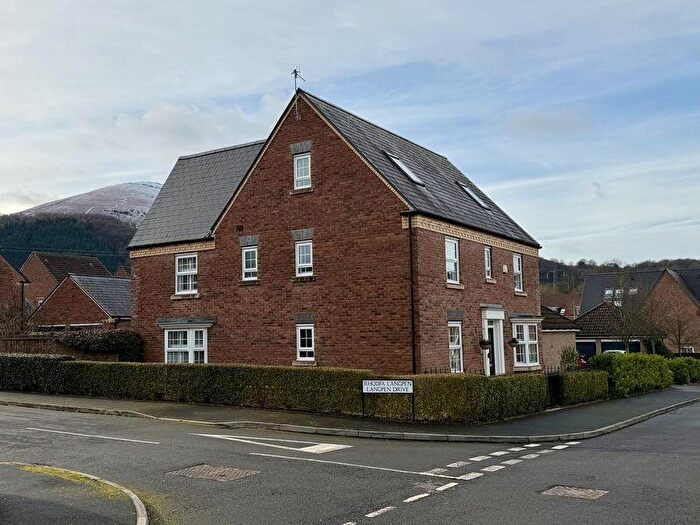
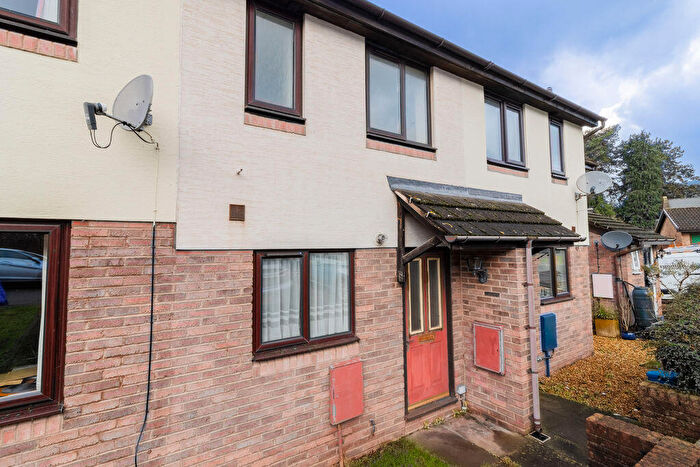
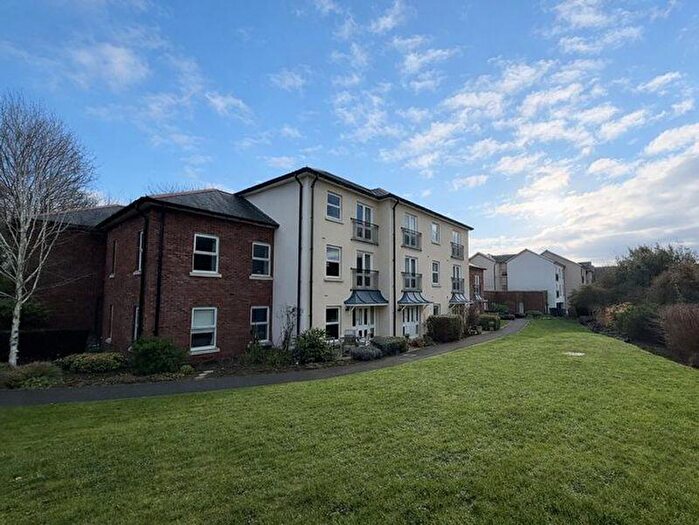
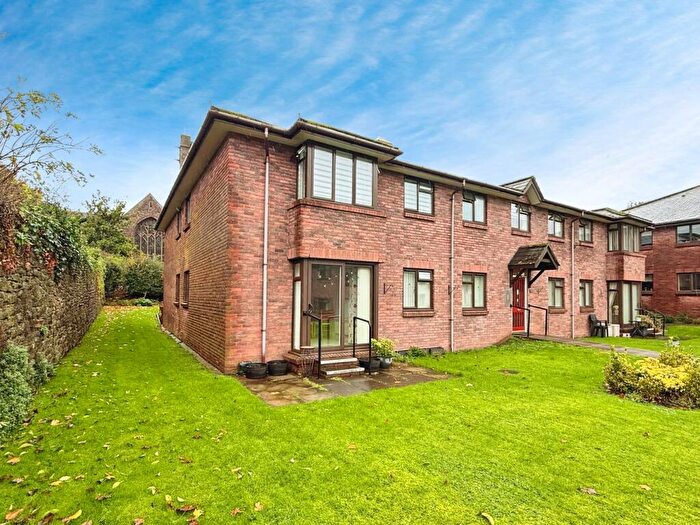
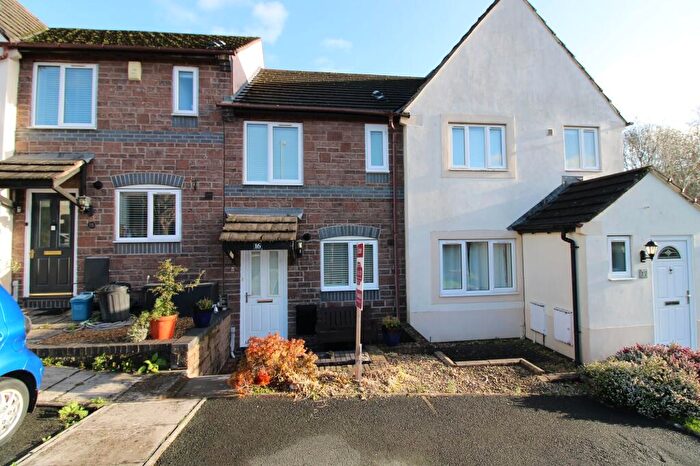
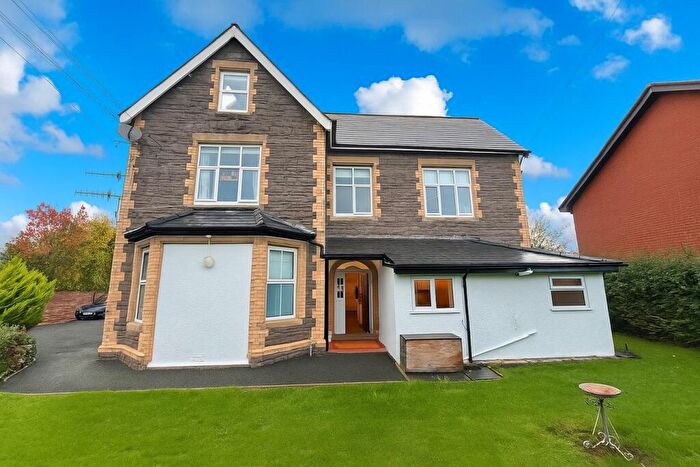
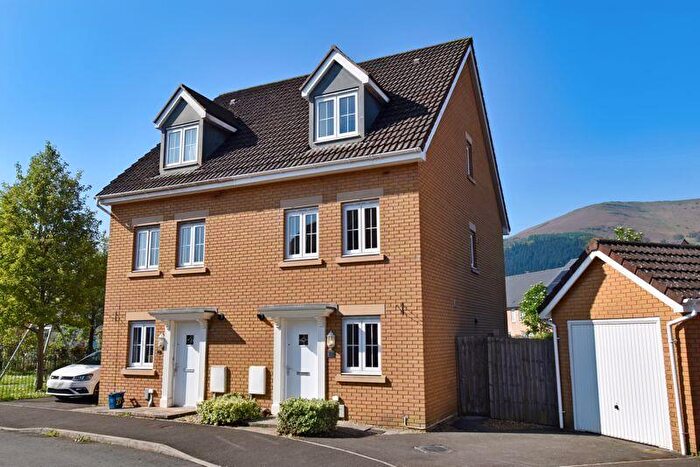
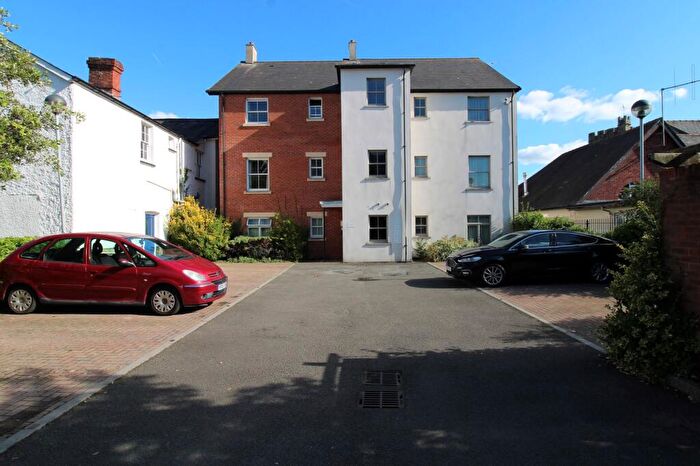
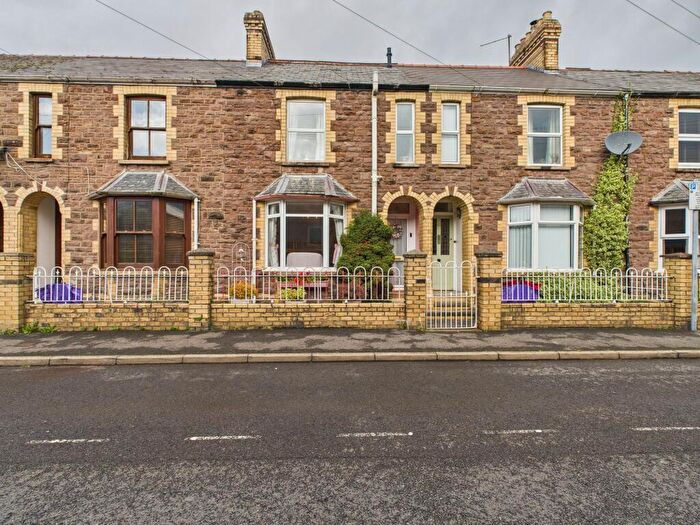
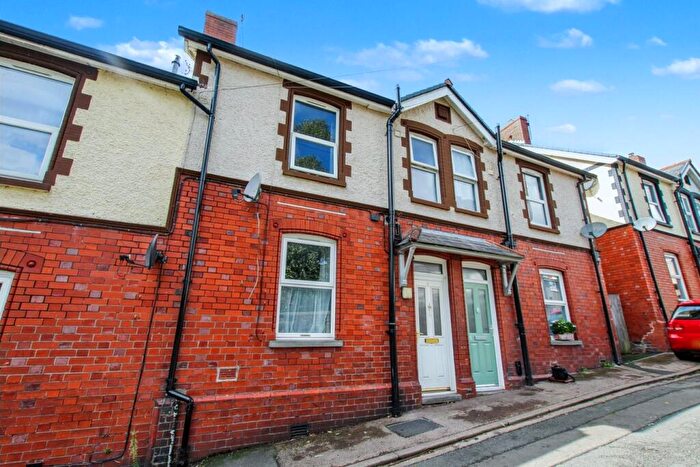
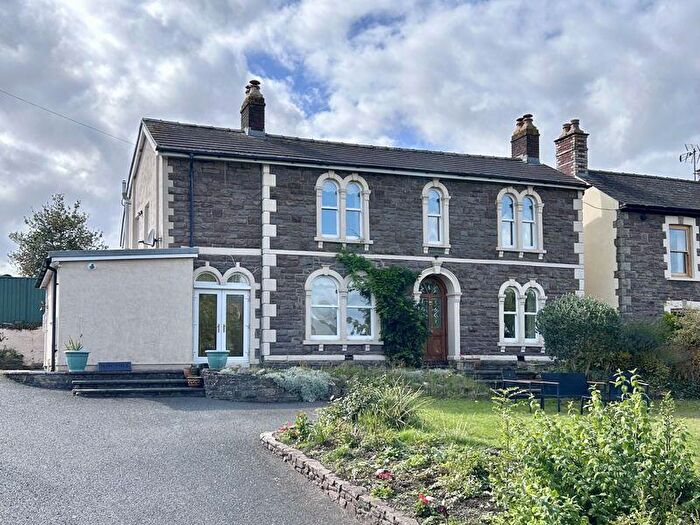
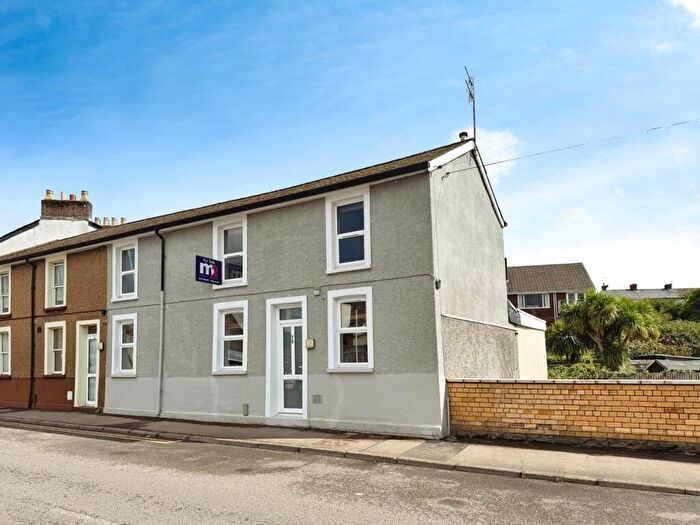
Houses for sale & to rent in Grofield, Abergavenny
House Prices in Grofield
Properties in Grofield have an average house price of £260,026.00 and had 111 Property Transactions within the last 3 years¹.
Grofield is an area in Abergavenny, Sir Fynwy - Monmouthshire with 913 households², where the most expensive property was sold for £828,000.00.
Properties for sale in Grofield
Roads and Postcodes in Grofield
Navigate through our locations to find the location of your next house in Grofield, Abergavenny for sale or to rent.
| Streets | Postcodes |
|---|---|
| Albert Place | NP7 5BN |
| Baker Street | NP7 5BB NP7 5BH NP7 5BD NP7 5BJ NP7 5HU |
| Brecon Road | NP7 5UG NP7 7EH NP7 7RB NP7 7RF NP7 7AX NP7 7EG NP7 7RX NP7 5BX |
| Cae Pen-y-dre Close | NP7 5UR |
| Caepenydre | NP7 5UP |
| Castle Meadows Park | NP7 7RZ |
| Castle Street | NP7 5EE |
| Commercial Street | NP7 5DY |
| Cross Street | NP7 5EH NP7 5EW NP7 5EN |
| Flannel Street | NP7 5EG |
| Frogmore Street | NP7 5AN NP7 5AR NP7 5AT NP7 5AU |
| Grofields | NP7 5DQ |
| Hatherleigh Road | NP7 7RG NP7 7RY |
| High Street | NP7 5YN |
| Lamb Close | NP7 5DD |
| Laundry Place | NP7 5DN |
| Lewis Walk | NP7 5BA |
| Library Square | NP7 5DJ |
| Lower Castle Street | NP7 5EQ |
| Merthyr Road | NP7 5BT NP7 5BU NP7 5BY NP7 5DA NP7 5DB NP7 5DF NP7 5DG NP7 5DE NP7 7SA |
| Nevill Street | NP7 5AA NP7 5AD |
| New Houses | NP7 5DW |
| Orchard Mews | NP7 5UF |
| Pant Lane | NP7 5DP NP7 5DR |
| Park Street | NP7 5YB NP7 5YD |
| Princes Street | NP7 5BL |
| Prospect Road | NP7 5DU |
| Radstock Court | NP7 5BQ |
| Regent Street | NP7 5BP NP7 5BS NP7 5BW |
| Seven Corners Lane | NP7 5AX |
| St Helens Close | NP7 5UZ |
| St Helens Road | NP7 5UU NP7 5UY NP7 5YA |
| St Johns Square | NP7 5AZ NP7 5EB |
| St Johns Street | NP7 5RT |
| Sunnybank | NP7 5YE |
| Trinity Square | NP7 5BG |
| Trinity Street | NP7 5EA |
| Trinity Terrace | NP7 5BE |
| Tudor Street | NP7 5DH NP7 5DL NP7 5EF NP7 5DX |
| Union Road | NP7 7RL |
| Union Road East | NP7 5UL NP7 5UN NP7 5UW |
| Union Road Industrial Estate | NP7 7RQ |
| Union Road West | NP7 7RH |
| Victoria Street | NP7 5DS NP7 5DT |
| NP7 7EL NP7 1AU NP7 1AX NP7 1BU NP7 1BW NP7 1BX NP7 1DA NP7 1DD NP7 1DG NP7 1DJ NP7 1DP NP7 5WQ NP7 5YG NP7 5ZT NP7 7WU NP7 8YA NP7 9WY NP7 9YS NP8 1YD |
Transport near Grofield
-
Abergavenny Station
-
Ebbw Vale Town Station
-
Pontypool and New Inn Station
-
Ebbw Vale Parkway Station
-
Llanhilleth Station
- FAQ
- Price Paid By Year
- Property Type Price
Frequently asked questions about Grofield
What is the average price for a property for sale in Grofield?
The average price for a property for sale in Grofield is £260,026. This amount is 24% lower than the average price in Abergavenny. There are 174 property listings for sale in Grofield.
What streets have the most expensive properties for sale in Grofield?
The streets with the most expensive properties for sale in Grofield are Frogmore Street at an average of £582,000, Nevill Street at an average of £307,475 and Merthyr Road at an average of £302,821.
What streets have the most affordable properties for sale in Grofield?
The streets with the most affordable properties for sale in Grofield are Commercial Street at an average of £158,750, New Houses at an average of £180,000 and Union Road East at an average of £184,000.
Which train stations are available in or near Grofield?
Some of the train stations available in or near Grofield are Abergavenny, Ebbw Vale Town and Pontypool and New Inn.
Property Price Paid in Grofield by Year
The average sold property price by year was:
| Year | Average Sold Price | Price Change |
Sold Properties
|
|---|---|---|---|
| 2025 | £235,855 | -13% |
24 Properties |
| 2024 | £265,788 | -1% |
26 Properties |
| 2023 | £267,188 | 0,1% |
35 Properties |
| 2022 | £266,933 | 19% |
26 Properties |
| 2021 | £216,685 | 3% |
38 Properties |
| 2020 | £210,764 | 10% |
22 Properties |
| 2019 | £190,377 | -1% |
27 Properties |
| 2018 | £192,748 | 1% |
29 Properties |
| 2017 | £191,546 | 25% |
32 Properties |
| 2016 | £142,760 | -18% |
25 Properties |
| 2015 | £168,055 | 2% |
26 Properties |
| 2014 | £164,730 | 17% |
30 Properties |
| 2013 | £137,500 | 1% |
24 Properties |
| 2012 | £136,314 | 1% |
24 Properties |
| 2011 | £135,197 | -20% |
39 Properties |
| 2010 | £162,657 | 24% |
19 Properties |
| 2009 | £123,346 | -27% |
24 Properties |
| 2008 | £156,943 | -11% |
32 Properties |
| 2007 | £173,878 | -6% |
36 Properties |
| 2006 | £183,769 | 26% |
38 Properties |
| 2005 | £136,107 | -13% |
34 Properties |
| 2004 | £153,897 | 25% |
42 Properties |
| 2003 | £114,854 | 23% |
49 Properties |
| 2002 | £88,382 | 10% |
45 Properties |
| 2001 | £79,152 | 17% |
53 Properties |
| 2000 | £65,301 | 2% |
49 Properties |
| 1999 | £63,680 | -1% |
40 Properties |
| 1998 | £64,397 | 6% |
46 Properties |
| 1997 | £60,550 | 20% |
47 Properties |
| 1996 | £48,165 | 9% |
51 Properties |
| 1995 | £43,743 | - |
30 Properties |
Property Price per Property Type in Grofield
Here you can find historic sold price data in order to help with your property search.
The average Property Paid Price for specific property types in the last three years are:
| Property Type | Average Sold Price | Sold Properties |
|---|---|---|
| Semi Detached House | £290,534.00 | 23 Semi Detached Houses |
| Detached House | £419,166.00 | 6 Detached Houses |
| Terraced House | £241,647.00 | 79 Terraced Houses |
| Flat | £191,833.00 | 3 Flats |

