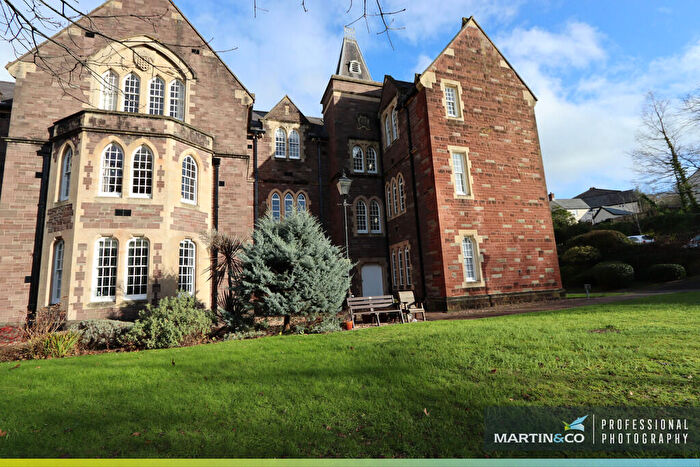
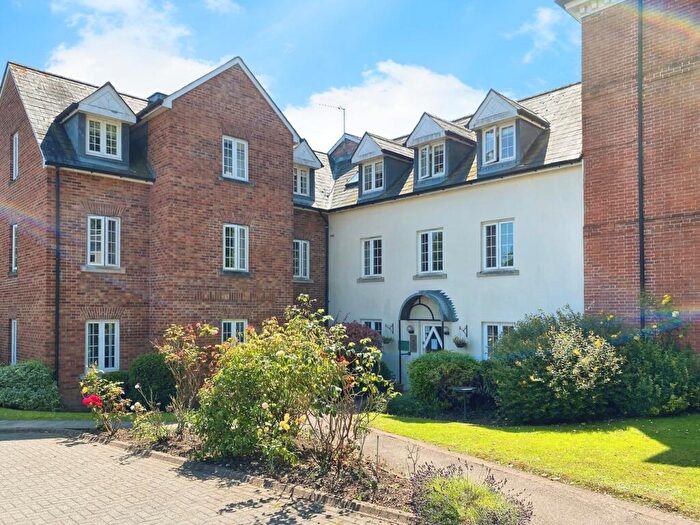
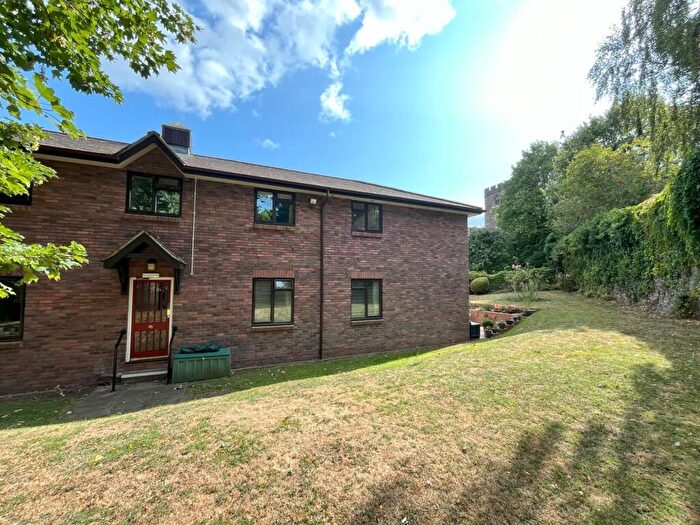
Houses for sale & to rent in Castle, Abergavenny
House Prices in Castle
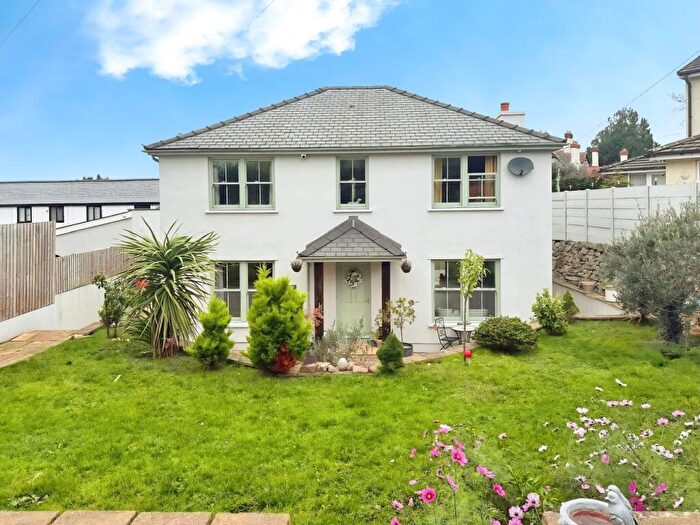
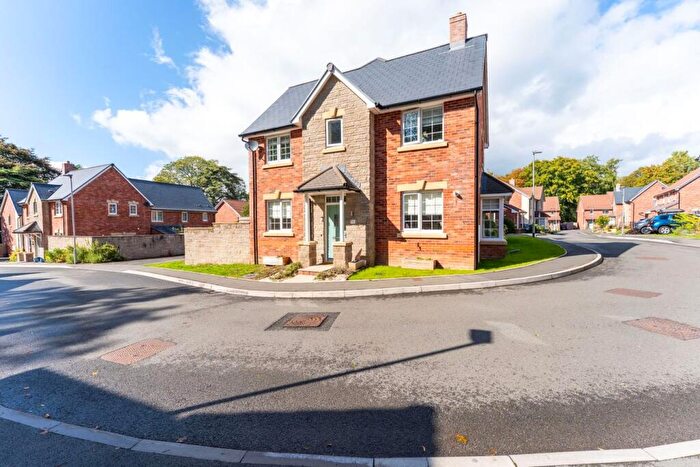
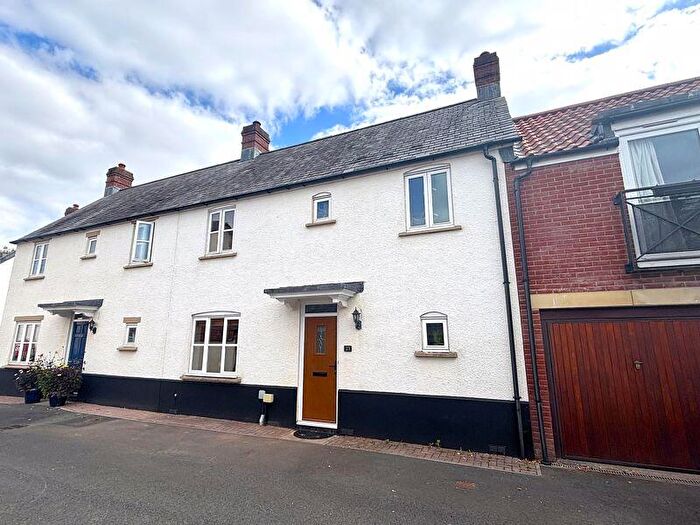
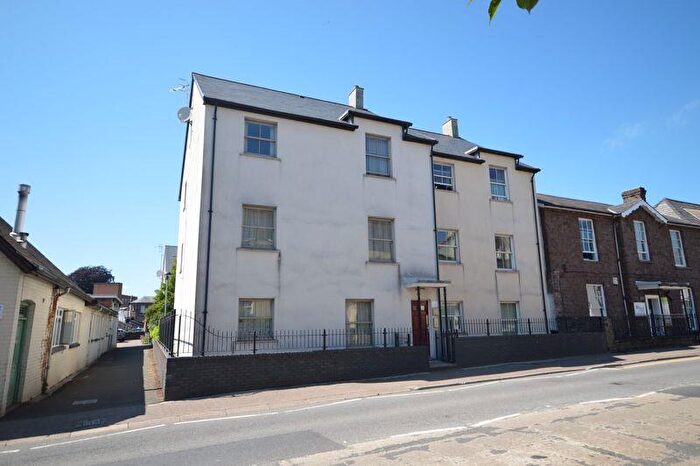
Properties in Castle have an average house price of £345,330.00 and had 157 Property Transactions within the last 3 years¹.
Castle is an area in Abergavenny, Sir Fynwy - Monmouthshire with 903 households², where the most expensive property was sold for £1,135,000.00.
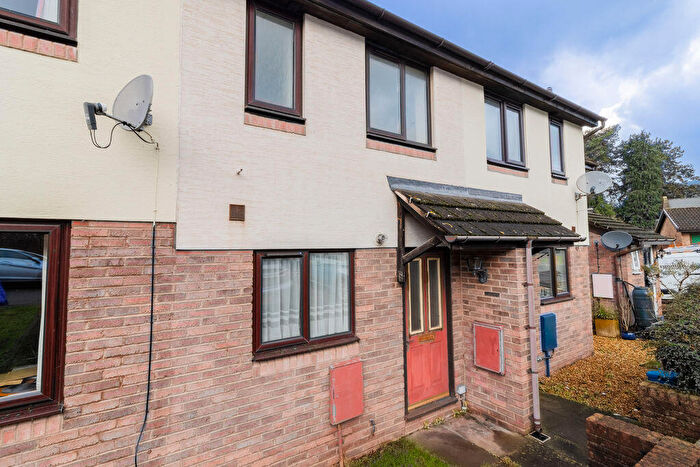
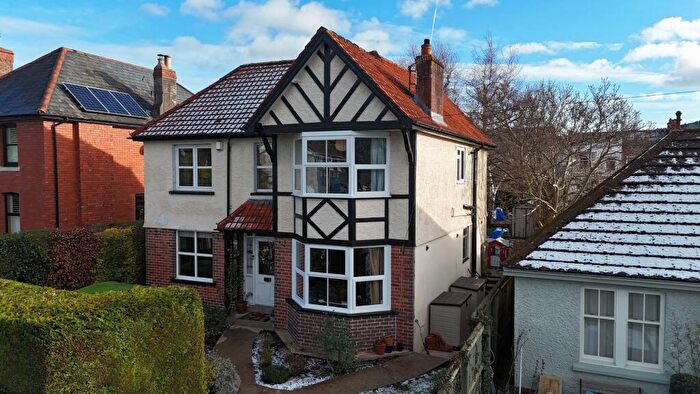
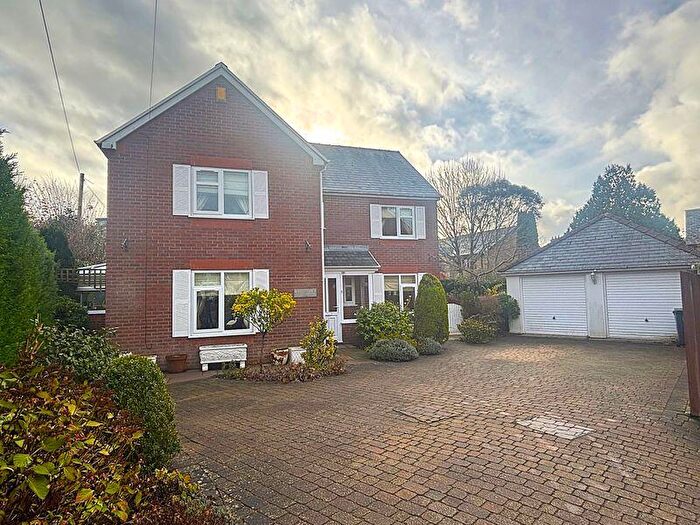
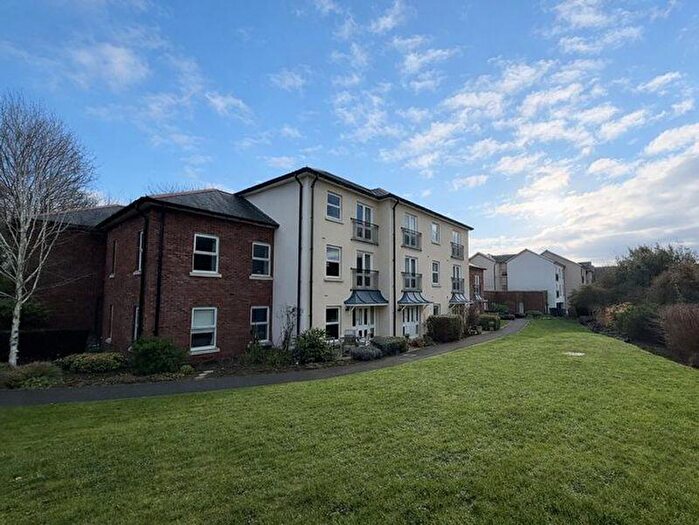
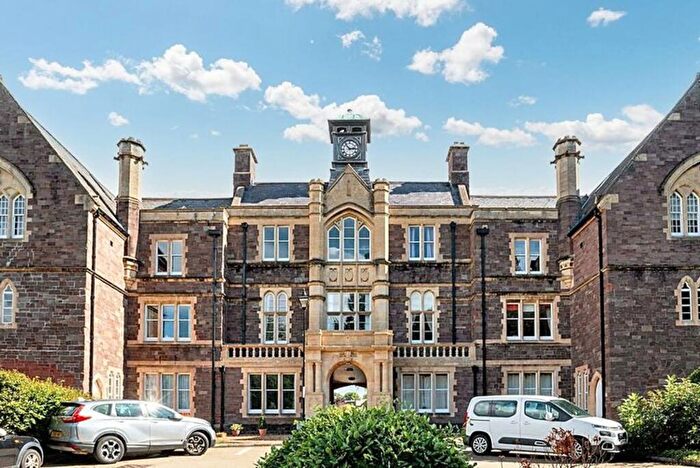
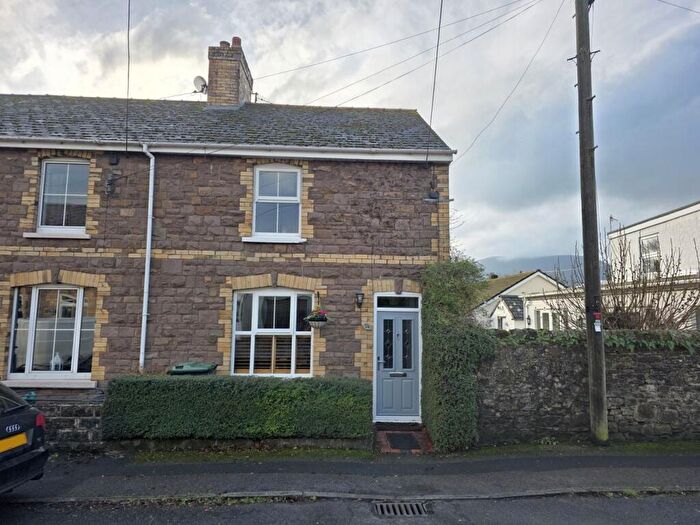
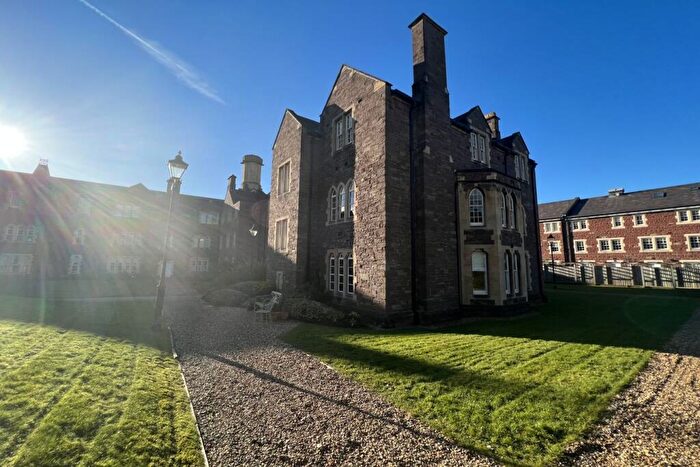
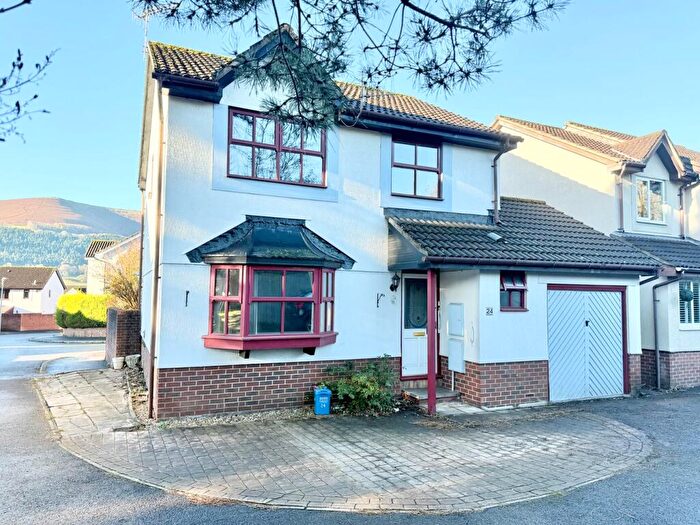
Properties for sale in Castle
Roads and Postcodes in Castle
Navigate through our locations to find the location of your next house in Castle, Abergavenny for sale or to rent.
| Streets | Postcodes |
|---|---|
| Station Road | NP7 5HY NP7 5HS NP7 5HX NP7 5JA NP7 5HT |
| Bay Tree Lane | NP7 5JW |
| Beauchamp Close | NP7 9JH |
| Beaupreau Place | NP7 5LZ |
| Belmont Close | NP7 5HW |
| Belmont Crescent | NP7 5LF |
| Belmont Road | NP7 5HN |
| Chestnut Drive | NP7 5JD NP7 5JZ |
| Clos Y Pinwydd | NP7 5JP |
| Coed Glas Lane | NP7 5LE |
| De Ballon Close | NP7 9JE |
| De Braose Close | NP7 9JJ |
| De Cantelupe Close | NP7 9JB |
| De Grosmont Close | NP7 9JN |
| De Wallingford Close | NP7 9JG |
| Fosterville Crescent | NP7 5HG |
| Gavenny Way | NP7 5LX |
| Glyndwr Gardens | NP7 9JL |
| Gobannium Way | NP7 9JA |
| Hastings Close | NP7 9JD |
| Holywell Close | NP7 5LN |
| Holywell Crescent | NP7 5LG NP7 5LH NP7 5LL |
| Holywell Road | NP7 5LP NP7 5LR |
| Holywell Road East | NP7 5LW |
| Laburnum Walk | NP7 5JX |
| Limetree Mews | NP7 5JB |
| Llanover Way | NP7 9JF |
| Maes Y Llarwydd | NP7 5LQ |
| Maple Close | NP7 5JU |
| Marsh Court | NP7 5HQ |
| Mill Close | NP7 5HJ BT38 7FN |
| Mill Street | NP7 5EX NP7 5HE |
| Monmouth Road | NP7 5HF NP7 5HH NP7 5HL NP7 5HP NP7 5HR NP7 9BP NP7 9SP NP7 9SW |
| Old Monmouth Road | NP7 5LB NP7 5LA |
| Ostringen Close | NP7 5LY |
| Plas Derwen Close | NP7 9SQ |
| Plas Derwen View | NP7 9SX NP7 9SZ |
| Plas Derwen Way | NP7 9QZ NP7 9SJ |
| Raglan Terrace | NP7 9SR |
| Ross Road | NP7 5RF |
| Sarno Square | NP7 5JT |
| Sycamore Avenue | NP7 5JY |
| Whites Close | NP7 5HZ |
| NP7 6AJ NP7 6AQ |
Transport near Castle
-
Abergavenny Station
-
Pontypool and New Inn Station
-
Ebbw Vale Town Station
-
Ebbw Vale Parkway Station
-
Llanhilleth Station
- FAQ
- Price Paid By Year
- Property Type Price
Frequently asked questions about Castle
What is the average price for a property for sale in Castle?
The average price for a property for sale in Castle is £345,330. This amount is 1% higher than the average price in Abergavenny. There are 142 property listings for sale in Castle.
What streets have the most expensive properties for sale in Castle?
The streets with the most expensive properties for sale in Castle are Plas Derwen Way at an average of £530,000, Glyndwr Gardens at an average of £499,950 and Hastings Close at an average of £467,500.
What streets have the most affordable properties for sale in Castle?
The streets with the most affordable properties for sale in Castle are Mill Street at an average of £131,888, Sarno Square at an average of £180,866 and Limetree Mews at an average of £181,000.
Which train stations are available in or near Castle?
Some of the train stations available in or near Castle are Abergavenny, Pontypool and New Inn and Ebbw Vale Town.
Property Price Paid in Castle by Year
The average sold property price by year was:
| Year | Average Sold Price | Price Change |
Sold Properties
|
|---|---|---|---|
| 2025 | £342,618 | -4% |
35 Properties |
| 2024 | £355,238 | 5% |
42 Properties |
| 2023 | £338,729 | -1% |
37 Properties |
| 2022 | £343,539 | 15% |
43 Properties |
| 2021 | £291,642 | -0,5% |
42 Properties |
| 2020 | £292,969 | 14% |
60 Properties |
| 2019 | £253,358 | -3% |
51 Properties |
| 2018 | £261,130 | 12% |
38 Properties |
| 2017 | £228,953 | 3% |
97 Properties |
| 2016 | £221,722 | 4% |
42 Properties |
| 2015 | £213,163 | 0,1% |
39 Properties |
| 2014 | £212,873 | 3% |
48 Properties |
| 2013 | £205,986 | -22% |
44 Properties |
| 2012 | £250,567 | 19% |
26 Properties |
| 2011 | £203,087 | -2% |
36 Properties |
| 2010 | £207,635 | 2% |
37 Properties |
| 2009 | £203,685 | -16% |
27 Properties |
| 2008 | £236,042 | -6% |
33 Properties |
| 2007 | £251,272 | 11% |
63 Properties |
| 2006 | £224,858 | 9% |
49 Properties |
| 2005 | £203,558 | 13% |
30 Properties |
| 2004 | £177,506 | 16% |
80 Properties |
| 2003 | £149,597 | 3% |
100 Properties |
| 2002 | £145,173 | 7% |
74 Properties |
| 2001 | £134,934 | 25% |
86 Properties |
| 2000 | £101,823 | 14% |
36 Properties |
| 1999 | £87,740 | -8% |
31 Properties |
| 1998 | £94,923 | 11% |
40 Properties |
| 1997 | £84,392 | -0,5% |
48 Properties |
| 1996 | £84,805 | -4% |
30 Properties |
| 1995 | £88,162 | - |
44 Properties |
Property Price per Property Type in Castle
Here you can find historic sold price data in order to help with your property search.
The average Property Paid Price for specific property types in the last three years are:
| Property Type | Average Sold Price | Sold Properties |
|---|---|---|
| Semi Detached House | £370,728.00 | 41 Semi Detached Houses |
| Detached House | £418,583.00 | 66 Detached Houses |
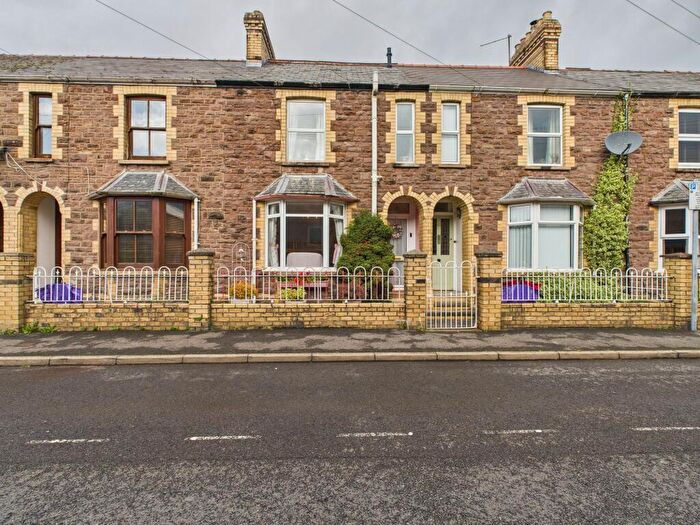
| Terraced House | £305,818.00 | 11 Terraced Houses |
| Flat | £205,807.00 | 39 Flats |

