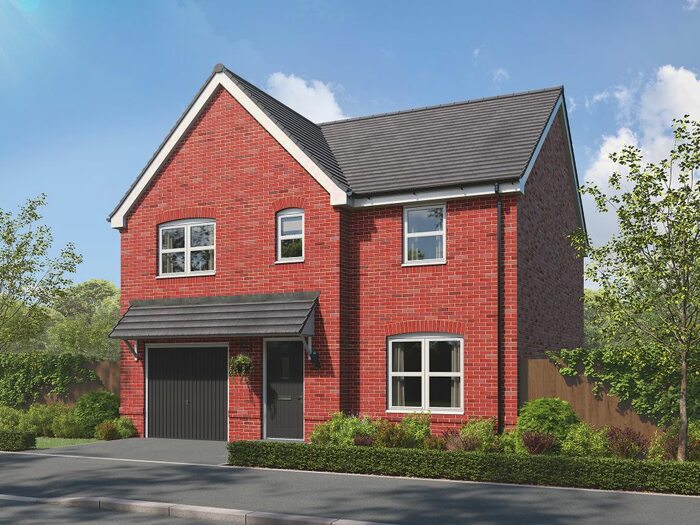
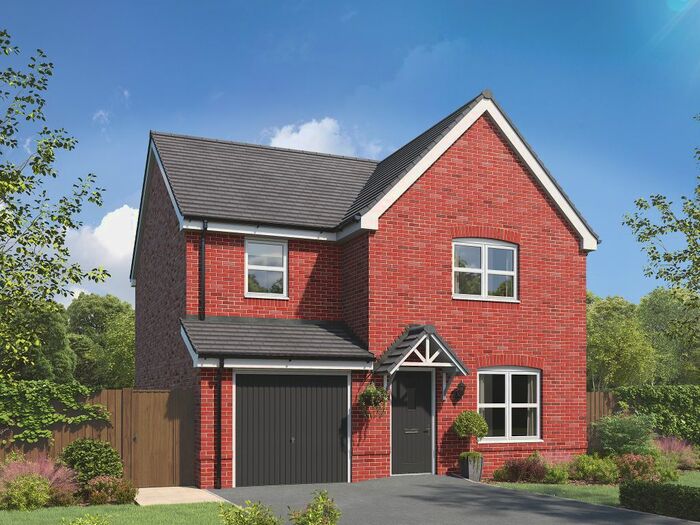
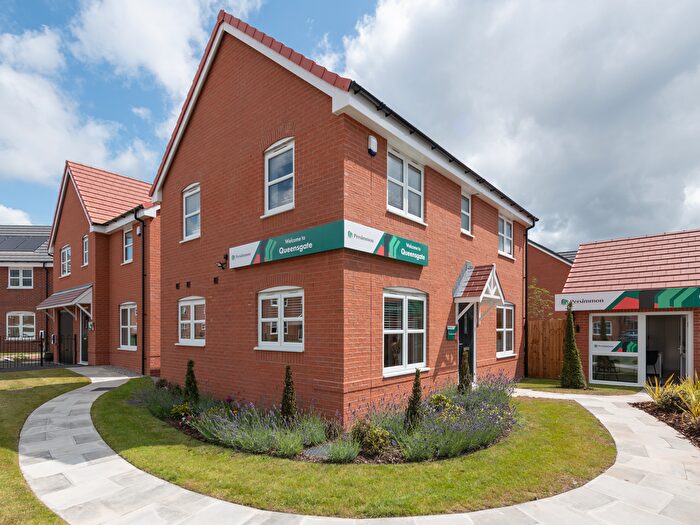
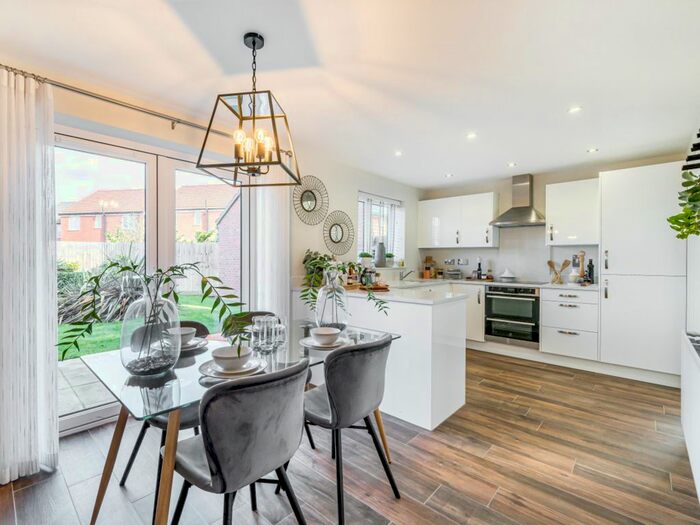
Houses for sale & to rent in Deeside, Sir y Fflint - Flintshire
House Prices in Deeside
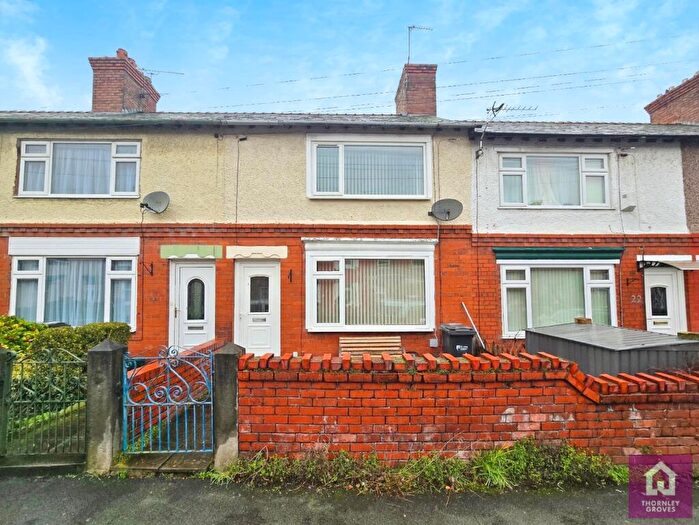
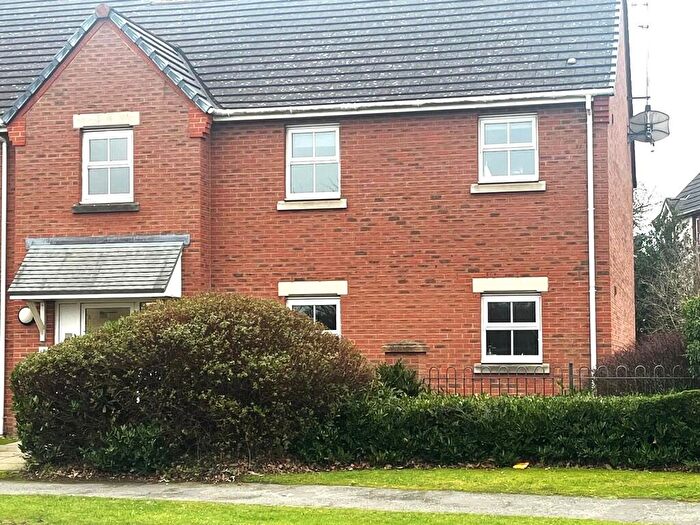
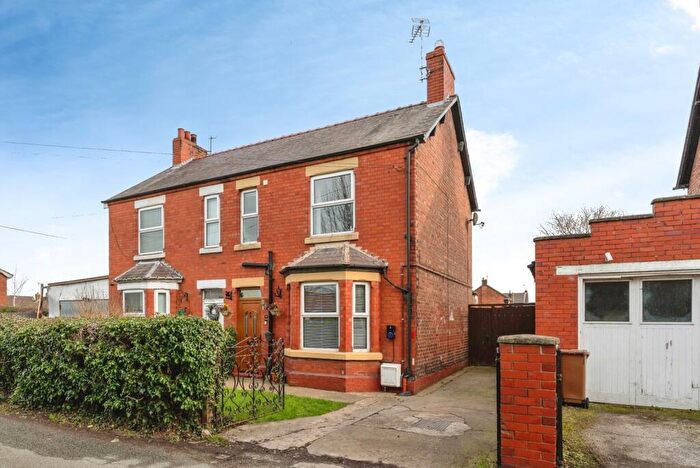
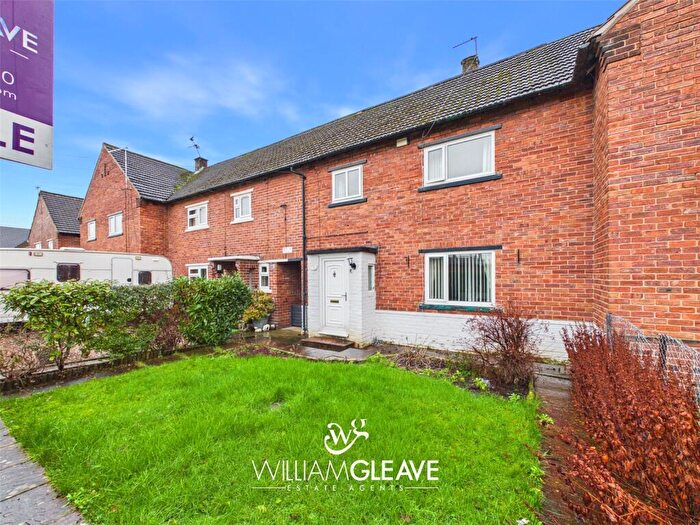
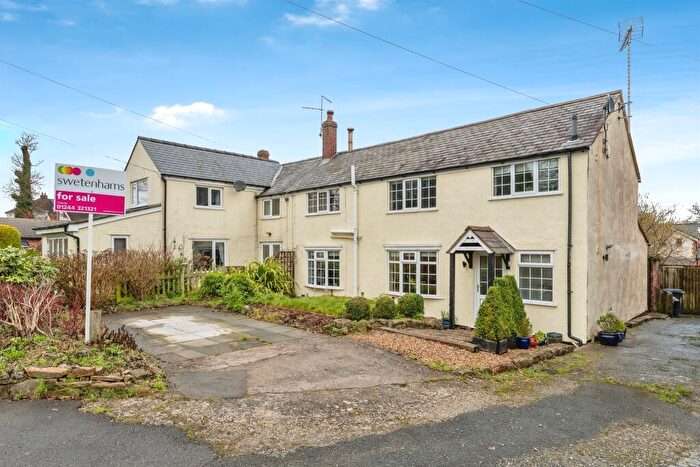
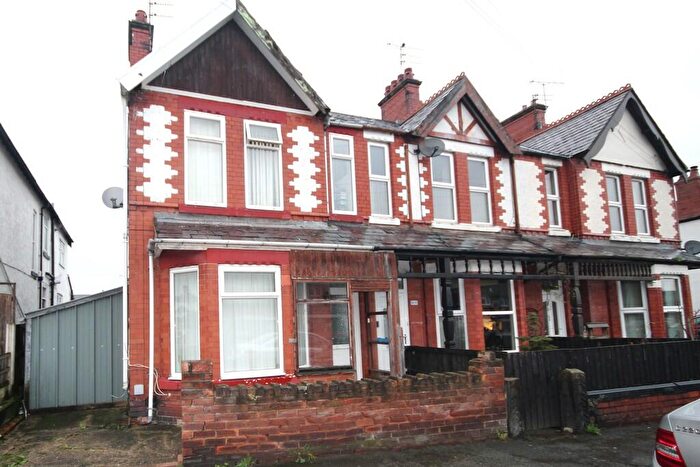
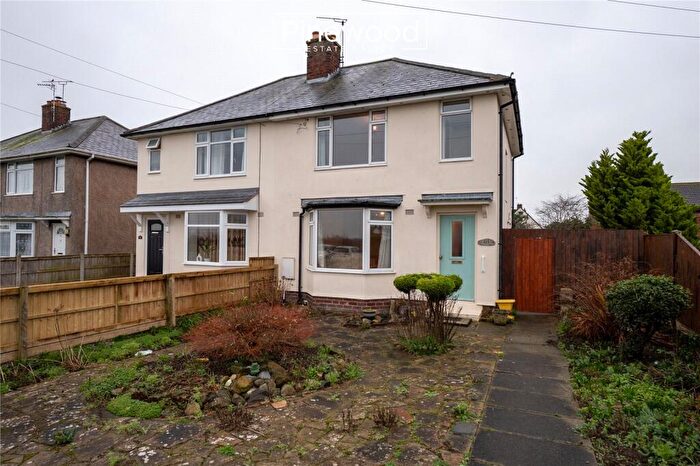
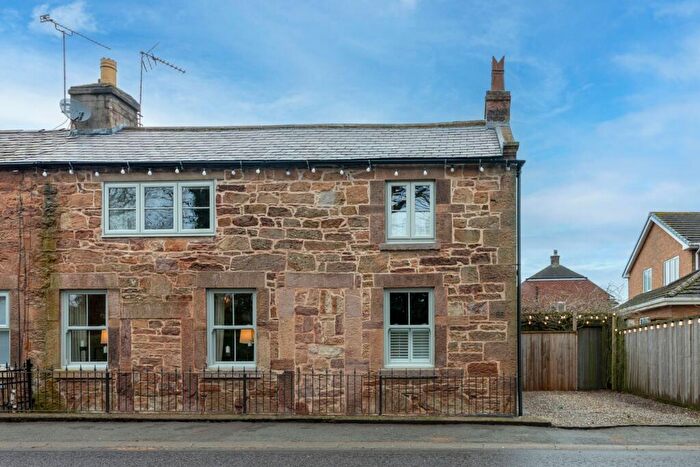
Properties in Deeside have an average house price of £209,211.00 and had 1,484 Property Transactions within the last 3 years.¹
Deeside is an area in Sir y Fflint - Flintshire with 17,623 households², where the most expensive property was sold for £2,375,000.00.
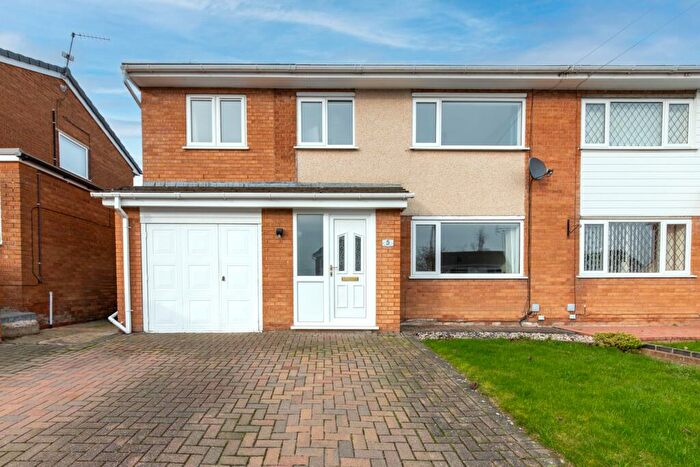
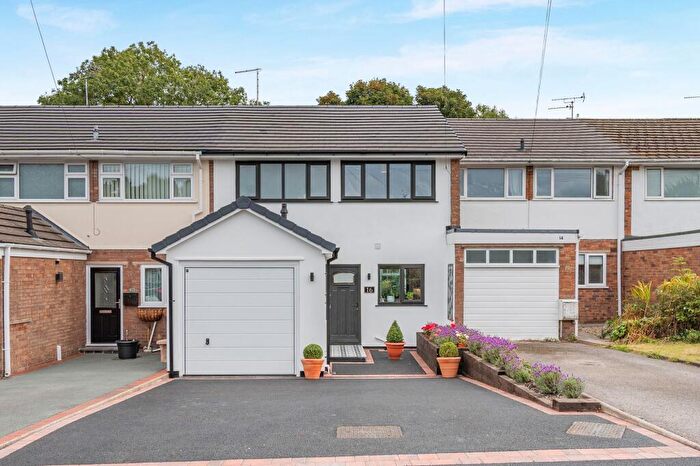
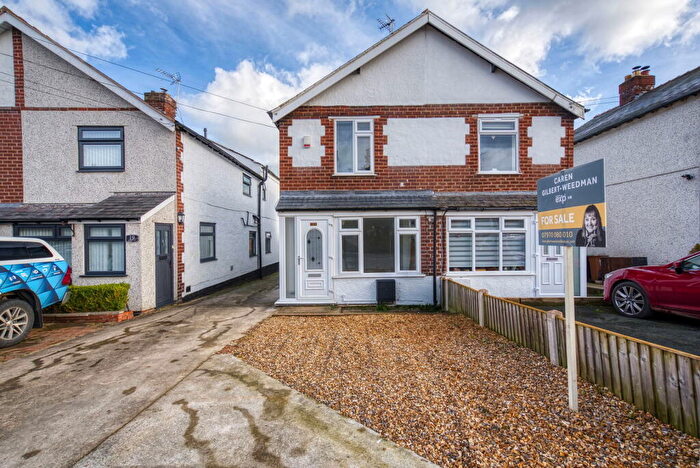
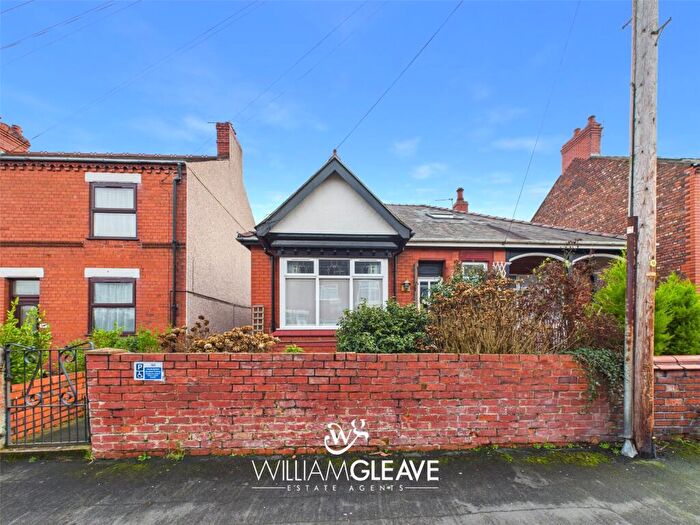
Properties for sale in Deeside
Neighbourhoods in Deeside
Navigate through our locations to find the location of your next house in Deeside, Sir y Fflint - Flintshire for sale or to rent.
- Aston
- Broughton North East
- Buckley Mountain
- Connahs Quay Central
- Connahs Quay Golftyn
- Connahs Quay South
- Connahs Quay Wepre
- Ewloe
- Hawarden
- Mancot
- Penyffordd
- Queensferry
- Sealand
- Shotton East
- Shotton Higher
- Shotton West
- Shotton East And Shotton Higher
- Queensferry And Sealand
- Hawarden: Ewloe
- Hawarden: Mancot
Transport in Deeside
Please see below transportation links in this area:
- FAQ
- Price Paid By Year
- Property Type Price
Frequently asked questions about Deeside
What is the average price for a property for sale in Deeside?
The average price for a property for sale in Deeside is £209,211. This amount is 7% lower than the average price in Sir y Fflint - Flintshire. There are 3,827 property listings for sale in Deeside.
What locations have the most expensive properties for sale in Deeside?
The locations with the most expensive properties for sale in Deeside are Hawarden at an average of £354,984, Ewloe at an average of £280,522 and Broughton North East at an average of £257,317.
What locations have the most affordable properties for sale in Deeside?
The locations with the most affordable properties for sale in Deeside are Queensferry at an average of £141,135, Shotton East at an average of £149,299 and Shotton Higher at an average of £151,051.
Which train stations are available in or near Deeside?
Some of the train stations available in or near Deeside are Shotton, Hawarden Bridge and Hawarden.
Property Price Paid in Deeside by Year
The average sold property price by year was:
| Year | Average Sold Price | Price Change |
Sold Properties
|
|---|---|---|---|
| 2025 | £216,403 | 2% |
418 Properties |
| 2024 | £211,890 | 5% |
541 Properties |
| 2023 | £200,725 | -1% |
525 Properties |
| 2022 | £202,801 | 8% |
605 Properties |
| 2021 | £185,799 | 4% |
764 Properties |
| 2020 | £178,677 | 6% |
523 Properties |
| 2019 | £168,390 | 0,1% |
615 Properties |
| 2018 | £168,276 | 1% |
621 Properties |
| 2017 | £167,377 | 2% |
681 Properties |
| 2016 | £163,834 | 5% |
661 Properties |
| 2015 | £155,440 | 4% |
634 Properties |
| 2014 | £148,491 | 3% |
601 Properties |
| 2013 | £144,214 | -5% |
493 Properties |
| 2012 | £151,241 | 6% |
339 Properties |
| 2011 | £141,828 | -0,2% |
391 Properties |
| 2010 | £142,182 | 5% |
355 Properties |
| 2009 | £134,953 | -11% |
277 Properties |
| 2008 | £150,103 | -2% |
362 Properties |
| 2007 | £152,911 | 3% |
841 Properties |
| 2006 | £148,328 | 7% |
876 Properties |
| 2005 | £137,932 | 9% |
736 Properties |
| 2004 | £125,380 | 20% |
832 Properties |
| 2003 | £100,210 | 20% |
893 Properties |
| 2002 | £80,560 | 14% |
947 Properties |
| 2001 | £69,158 | 4% |
858 Properties |
| 2000 | £66,316 | -2% |
883 Properties |
| 1999 | £67,817 | 8% |
494 Properties |
| 1998 | £62,282 | 10% |
644 Properties |
| 1997 | £56,248 | 2% |
751 Properties |
| 1996 | £55,082 | 6% |
658 Properties |
| 1995 | £51,748 | - |
514 Properties |
Property Price per Property Type in Deeside
Here you can find historic sold price data in order to help with your property search.
The average Property Paid Price for specific property types in the last three years are:
| Property Type | Average Sold Price | Sold Properties |
|---|---|---|
| Semi Detached House | £186,565.00 | 589 Semi Detached Houses |
| Terraced House | £143,529.00 | 361 Terraced Houses |
| Detached House | £309,476.00 | 455 Detached Houses |
| Flat | £100,731.00 | 79 Flats |

