Houses for sale & to rent in Aston, Deeside
House Prices in Aston
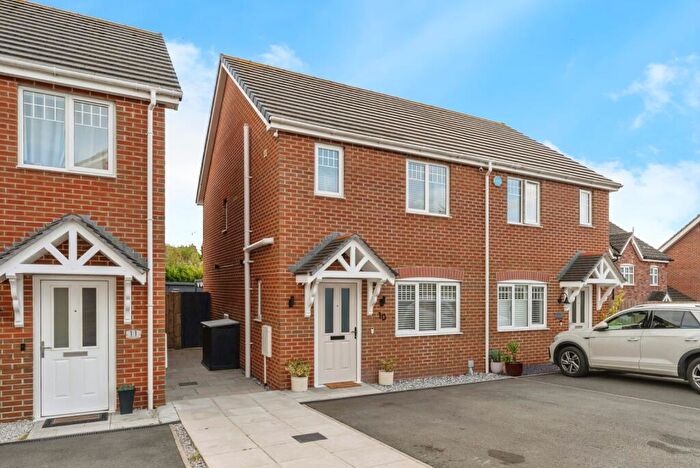
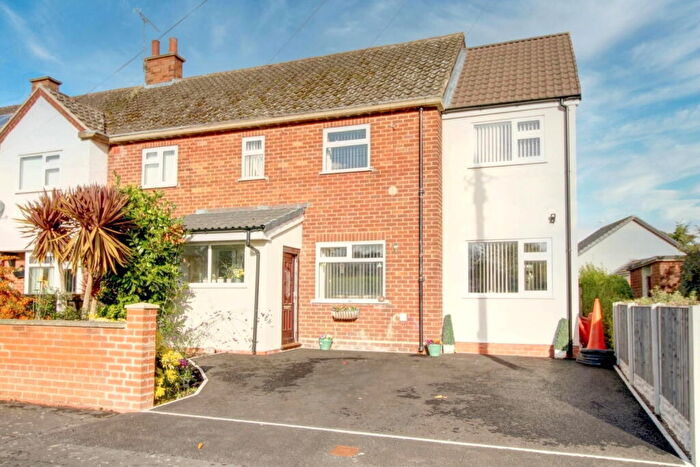
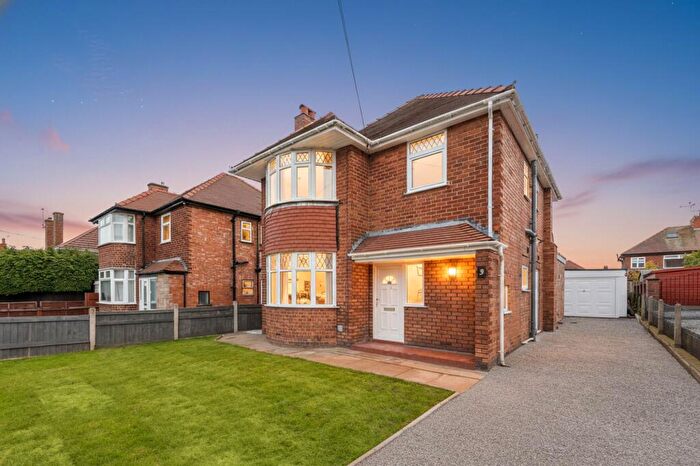
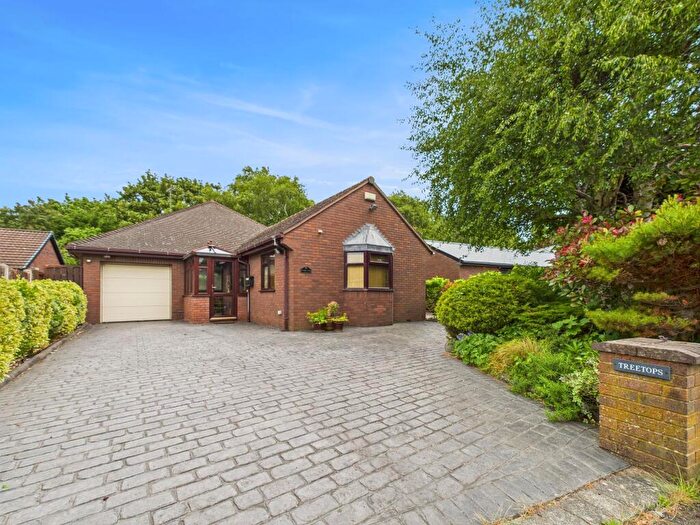
Properties in Aston have an average house price of £230,243.00 and had 90 Property Transactions within the last 3 years¹.
Aston is an area in Deeside, Sir y Fflint - Flintshire with 1,297 households², where the most expensive property was sold for £585,000.00.
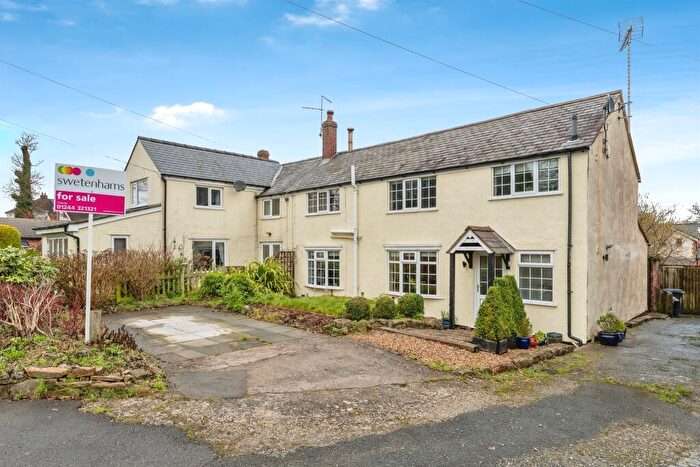
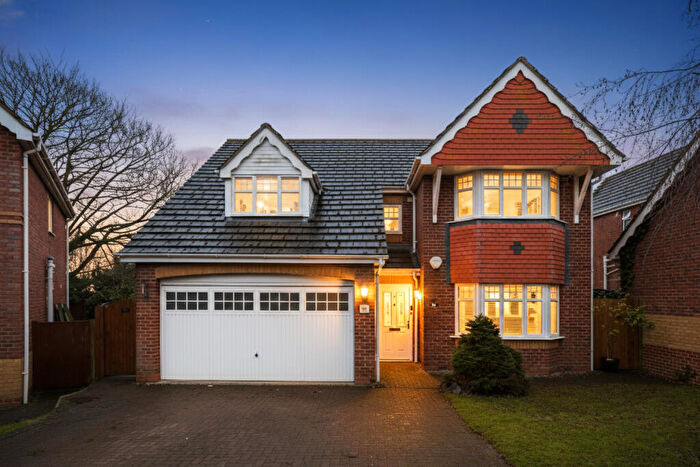
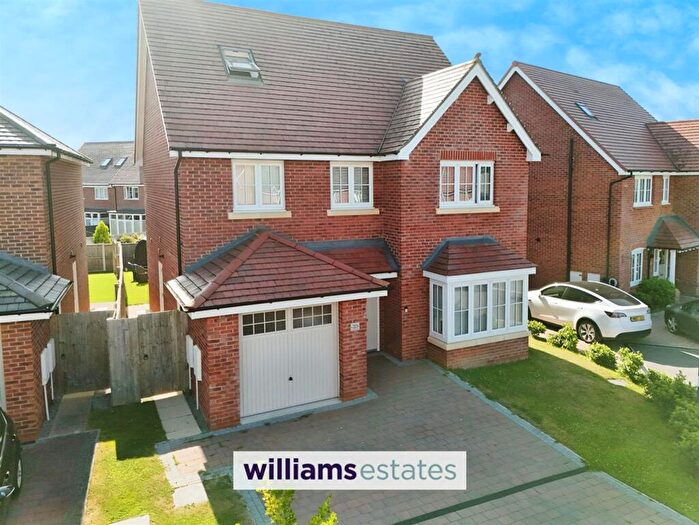
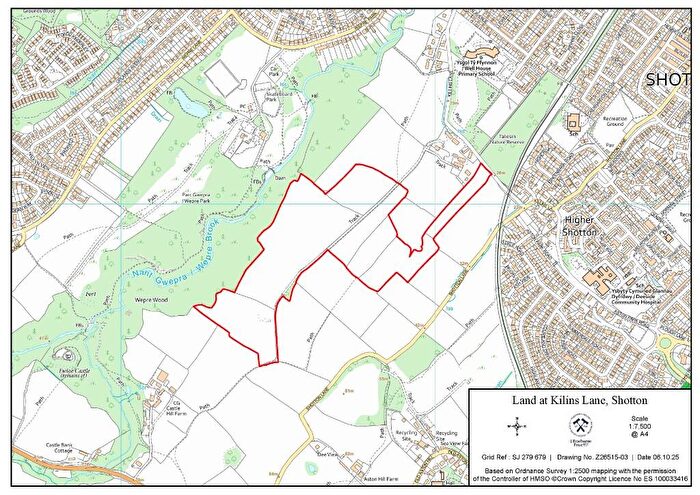
Properties for sale in Aston
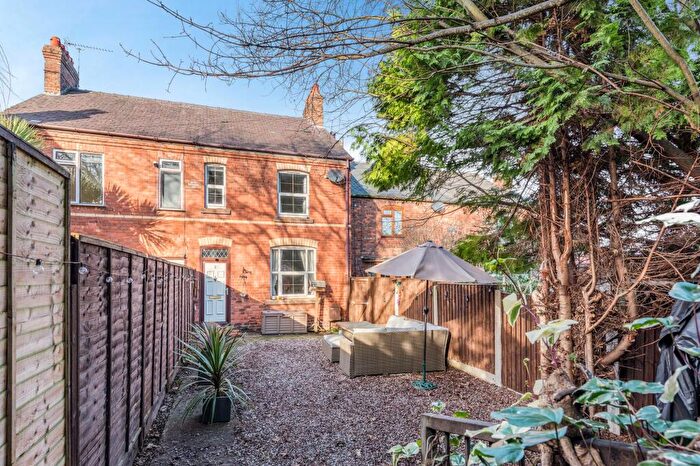
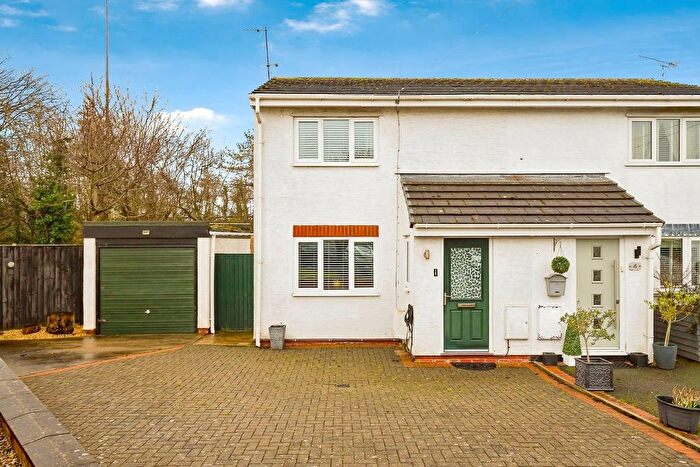
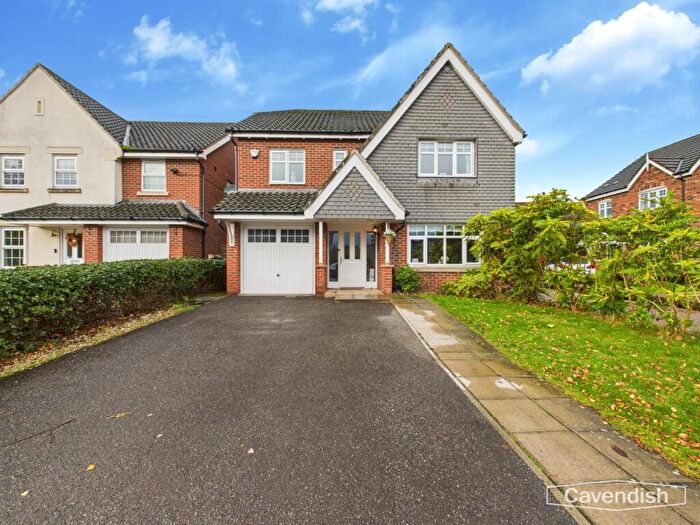
Previously listed properties in Aston
Roads and Postcodes in Aston
Navigate through our locations to find the location of your next house in Aston, Deeside for sale or to rent.
| Streets | Postcodes |
|---|---|
| Alder Avenue | CH5 1XP |
| Ash View | CH5 1BL |
| Aston Hill | CH5 3AH CH5 3AJ CH5 3AL CH5 3AG |
| Aston Park Road | CH5 1RD CH5 1UA CH5 1UB CH5 1UD CH5 1RB |
| Beech Road | CH5 1XA |
| Birchfield Crescent | CH5 1UL |
| Briarwood Road | CH5 3BU |
| Brook Cottages | CH5 3AE |
| Bryn Cottages | CH5 3AF |
| Cambrian Way | CH5 3RE |
| Carlines Avenue | CH5 3RD CH5 3RF CH5 3RH CH5 3RQ |
| Catherine Drive | CH5 3RB |
| Cedar Gardens | CH5 1XJ |
| Church Lane | CH5 3BF |
| Clay Hill Lane | CH5 2AQ |
| Courtland Drive | CH5 1UH CH5 1UJ CH5 1UQ |
| Crossway | CH5 3AT |
| Dale Road | CH5 1XE |
| Denson Drive | CH5 3RG |
| Elm Road | CH5 1UW |
| Estuary View | CH5 3RJ |
| Fernside Road | CH5 1XL |
| Ferry Hill | CH5 3AN CH5 3AW |
| Ffordd Burghley | CH5 3GJ |
| Gladstone Way | CH5 2BT |
| Grant Drive | CH5 3RR |
| Hawthorn Close | CH5 1UN |
| Highland Avenue | CH5 1XF CH5 1XG CH5 1XH CH5 1XQ |
| Hillfield Road | CH5 3AB |
| Holly Grove | CH5 1UR |
| Holywell Road | CH5 3BY |
| Ivy Cottages | CH5 1TL |
| Jefferson Road | CH5 3RA |
| Lincoln Road | CH5 3RW |
| Liverpool Road | CH5 3AR |
| Llys Gary Speed | CH5 3FE |
| Llys Y Castell | CH5 3DU |
| Lower Aston Hall Lane | CH5 3EX CH5 3EY |
| Moorfield Court | CH5 3EU |
| Moorfield Road | CH5 3EZ |
| Mountfield Road | CH5 3AA |
| New Park Road | CH5 1XD |
| Oakfield Road | CH5 3EW |
| Old Chester Road | CH5 3RU |
| Prince William Court | CH5 3RT |
| Priors Close | CH5 1BN |
| Prospect Close | CH5 3RL |
| Rowan Road | CH5 1XR CH5 1XT |
| St Davids Close | CH5 3AP |
| Stamford Way | CH5 3BZ |
| Summerdale Road | CH5 1XB |
| The Barnyard | CH5 3TL |
| The Close | CH5 3EP |
| The Coppice | CH5 3RS |
| The Croft | CH5 3BA |
| The Highway | CH5 3DN |
| The Ridgeway | CH5 3ER CH5 3ES |
| Thornfields | CH5 1QF |
| Upper Aston Hall Lane | CH5 3EN |
| Washington Drive | CH5 3RN |
| Wedgewood Road | CH5 1UP |
| Wirral View | CH5 3ET |
| Woodside Close | CH5 3RP |
| Yowley Road | CH5 3AS |
Transport near Aston
- FAQ
- Price Paid By Year
- Property Type Price
Frequently asked questions about Aston
What is the average price for a property for sale in Aston?
The average price for a property for sale in Aston is £230,243. This amount is 10% higher than the average price in Deeside. There are 338 property listings for sale in Aston.
What streets have the most expensive properties for sale in Aston?
The streets with the most expensive properties for sale in Aston are Lower Aston Hall Lane at an average of £385,000, Aston Hill at an average of £337,000 and Moorfield Road at an average of £326,500.
What streets have the most affordable properties for sale in Aston?
The streets with the most affordable properties for sale in Aston are Beech Road at an average of £95,000, Crossway at an average of £105,000 and Dale Road at an average of £117,838.
Which train stations are available in or near Aston?
Some of the train stations available in or near Aston are Hawarden, Shotton and Hawarden Bridge.
Property Price Paid in Aston by Year
The average sold property price by year was:
| Year | Average Sold Price | Price Change |
Sold Properties
|
|---|---|---|---|
| 2025 | £243,688 | 8% |
30 Properties |
| 2024 | £224,461 | 1% |
39 Properties |
| 2023 | £221,773 | 3% |
21 Properties |
| 2022 | £214,736 | 5% |
44 Properties |
| 2021 | £203,849 | 6% |
54 Properties |
| 2020 | £191,599 | 8% |
41 Properties |
| 2019 | £176,360 | -1% |
45 Properties |
| 2018 | £177,372 | 2% |
43 Properties |
| 2017 | £174,013 | 2% |
34 Properties |
| 2016 | £170,076 | 4% |
46 Properties |
| 2015 | £162,939 | 1% |
31 Properties |
| 2014 | £161,189 | 8% |
39 Properties |
| 2013 | £148,264 | -13% |
32 Properties |
| 2012 | £167,820 | -2% |
45 Properties |
| 2011 | £171,201 | 19% |
45 Properties |
| 2010 | £138,717 | 7% |
21 Properties |
| 2009 | £128,830 | -22% |
25 Properties |
| 2008 | £156,591 | -1% |
18 Properties |
| 2007 | £158,056 | 0,2% |
39 Properties |
| 2006 | £157,803 | 20% |
41 Properties |
| 2005 | £125,644 | -7% |
32 Properties |
| 2004 | £133,963 | 20% |
34 Properties |
| 2003 | £107,342 | 22% |
40 Properties |
| 2002 | £83,969 | 2% |
57 Properties |
| 2001 | £82,003 | 17% |
53 Properties |
| 2000 | £68,397 | 8% |
37 Properties |
| 1999 | £62,589 | 6% |
38 Properties |
| 1998 | £58,802 | 2% |
40 Properties |
| 1997 | £57,418 | 6% |
50 Properties |
| 1996 | £54,000 | 2% |
28 Properties |
| 1995 | £53,186 | - |
35 Properties |
Property Price per Property Type in Aston
Here you can find historic sold price data in order to help with your property search.
The average Property Paid Price for specific property types in the last three years are:
| Property Type | Average Sold Price | Sold Properties |
|---|---|---|
| Semi Detached House | £207,797.00 | 47 Semi Detached Houses |
| Detached House | £261,209.00 | 39 Detached Houses |
| Terraced House | £192,062.00 | 4 Terraced Houses |

