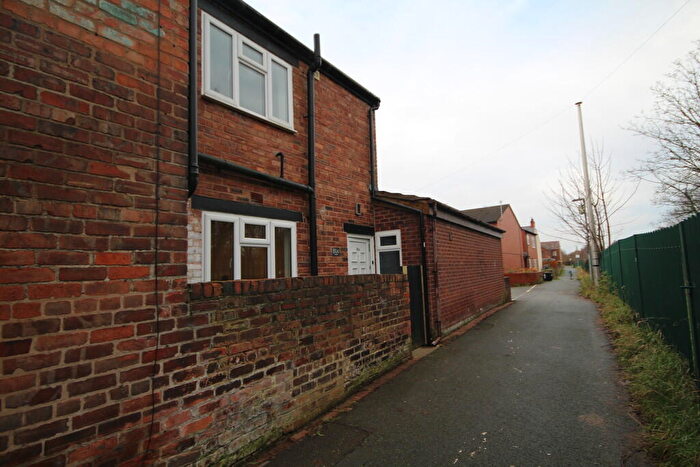
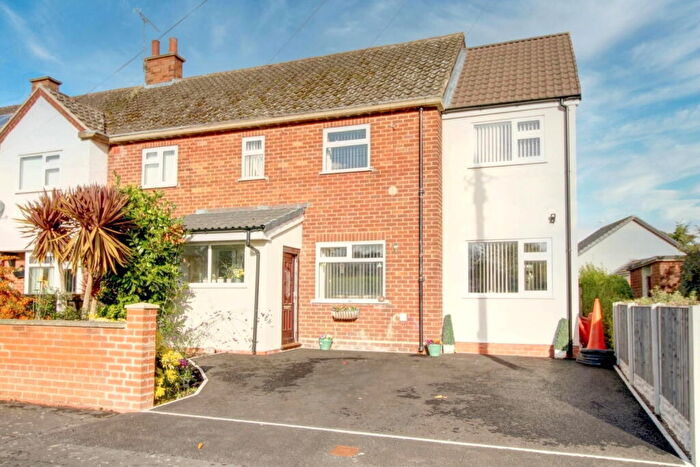
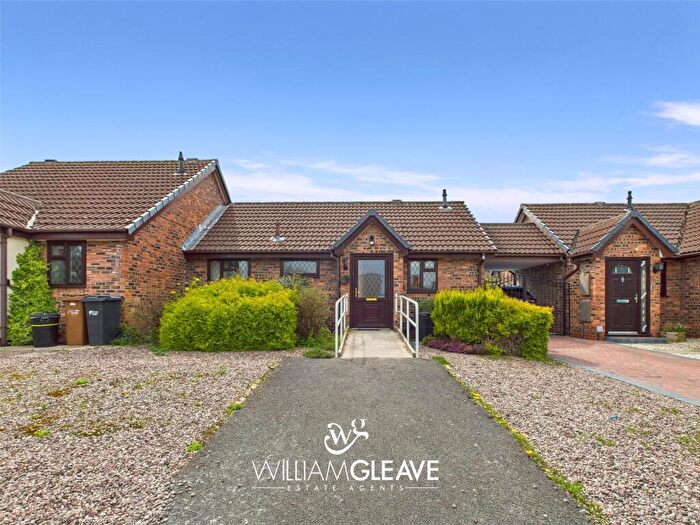
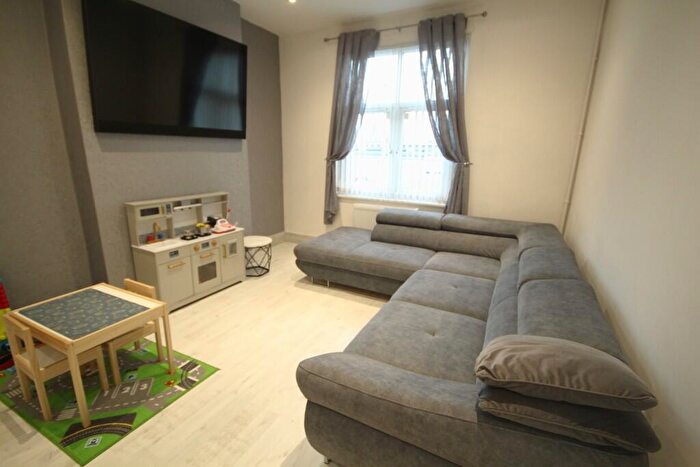
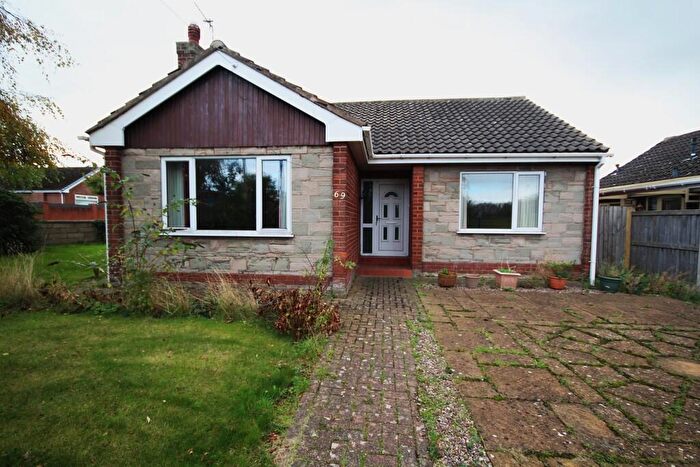
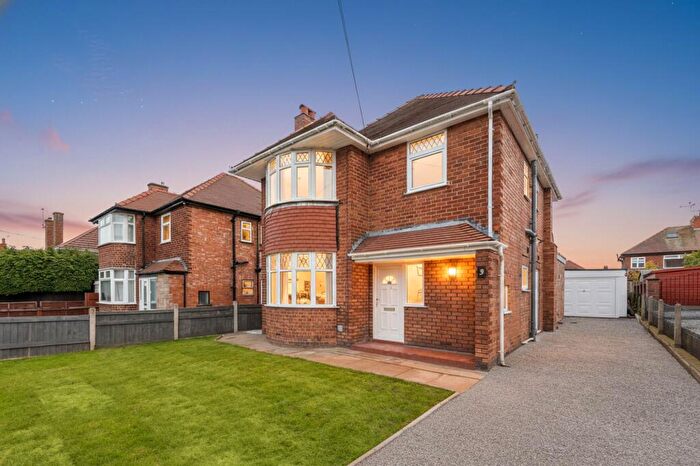
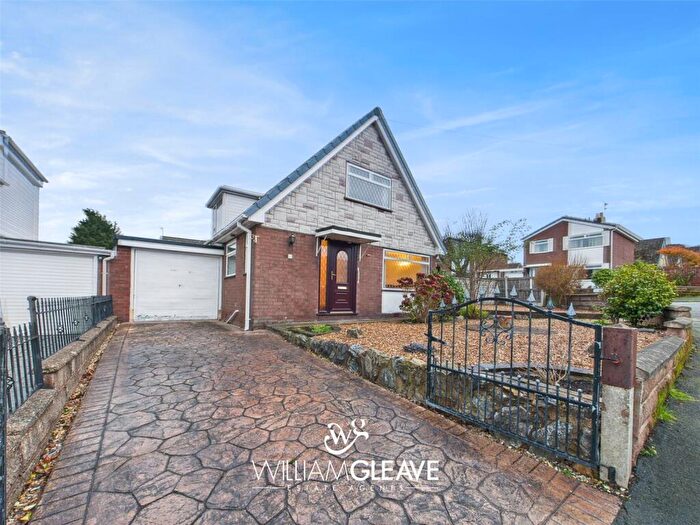
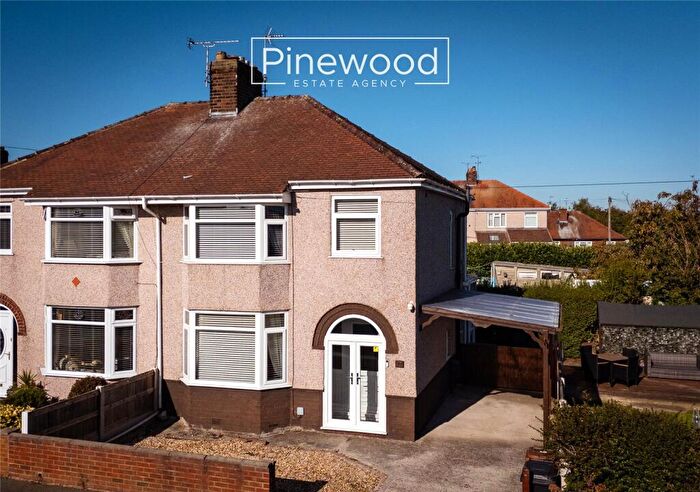
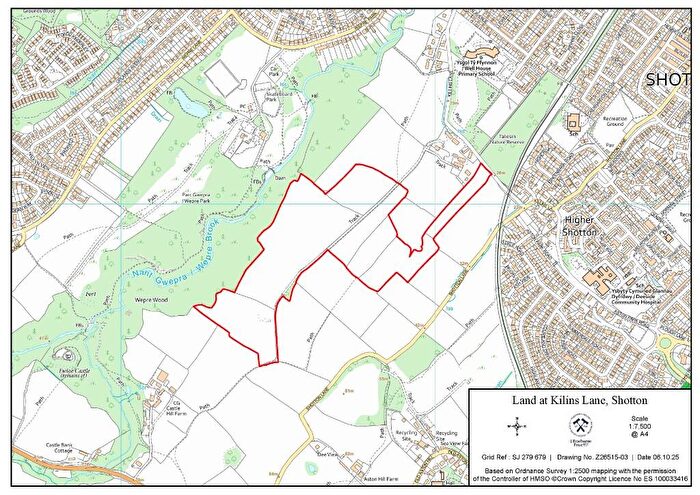
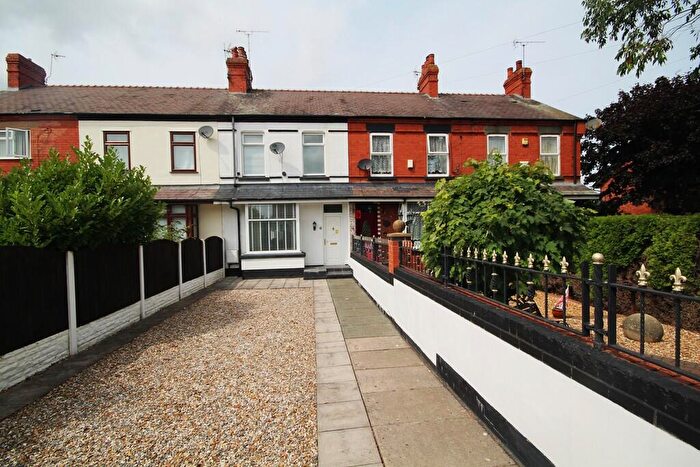
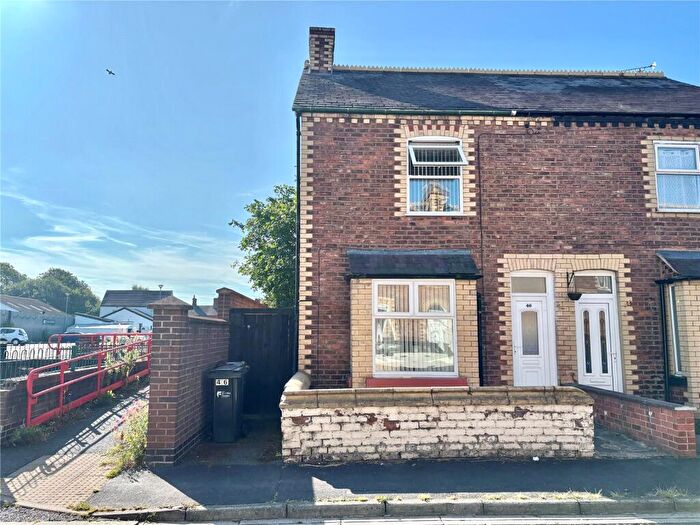
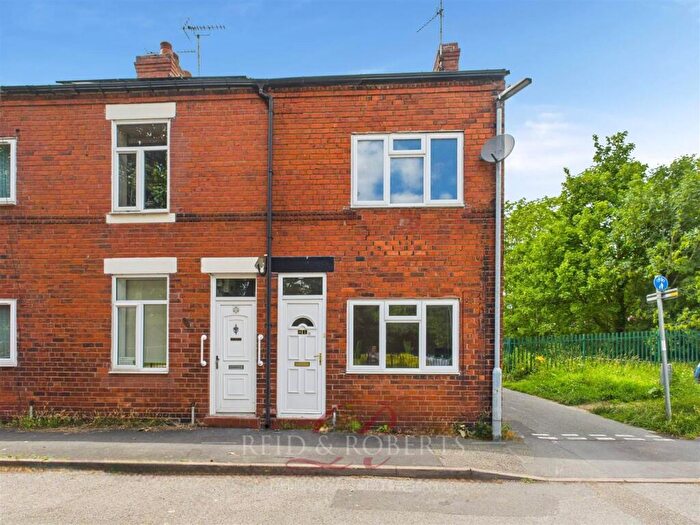
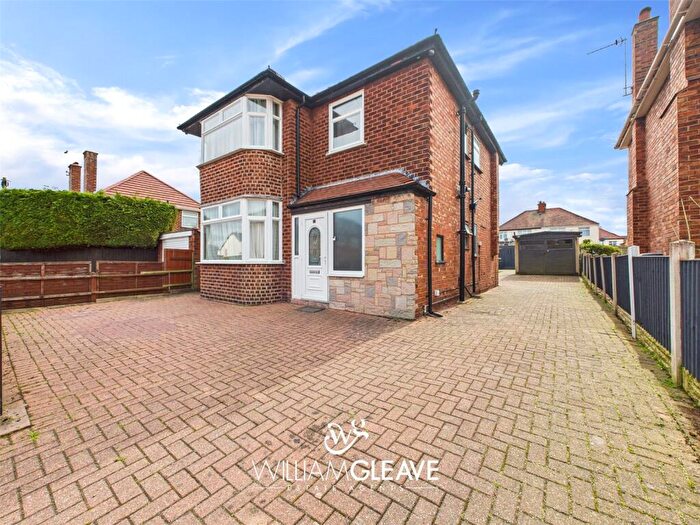
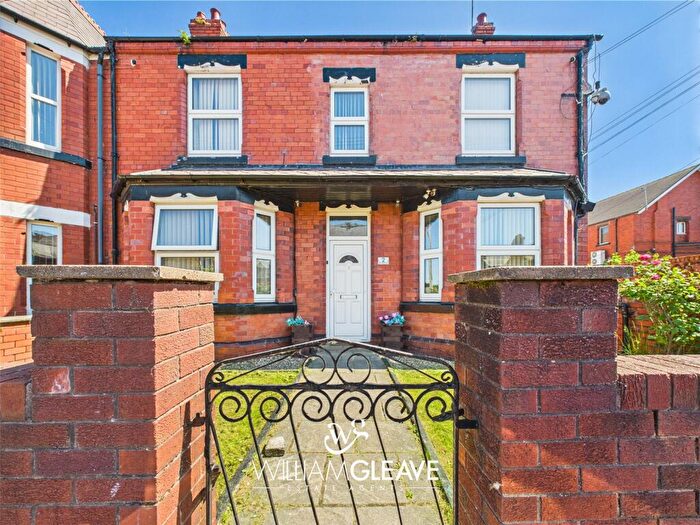
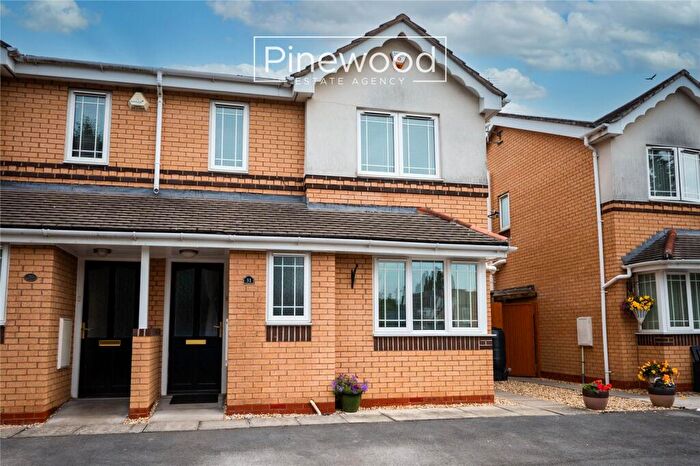
Houses for sale & to rent in Shotton East, Deeside
House Prices in Shotton East
Properties in Shotton East have an average house price of £138,800.00 and had 113 Property Transactions within the last 3 years¹.
Shotton East is an area in Deeside, Sir y Fflint - Flintshire with 852 households², where the most expensive property was sold for £275,000.00.
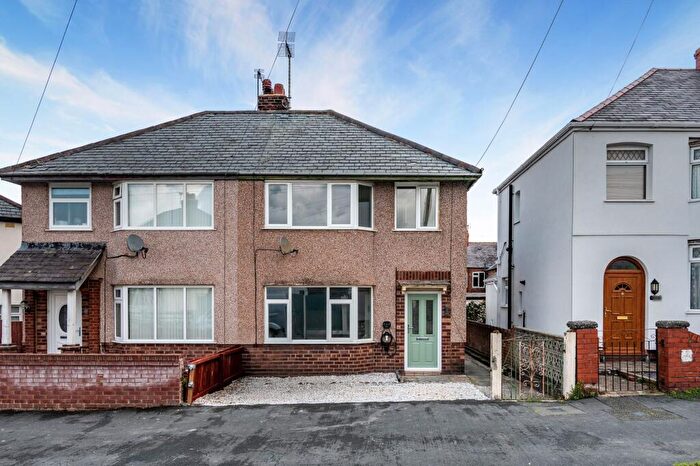
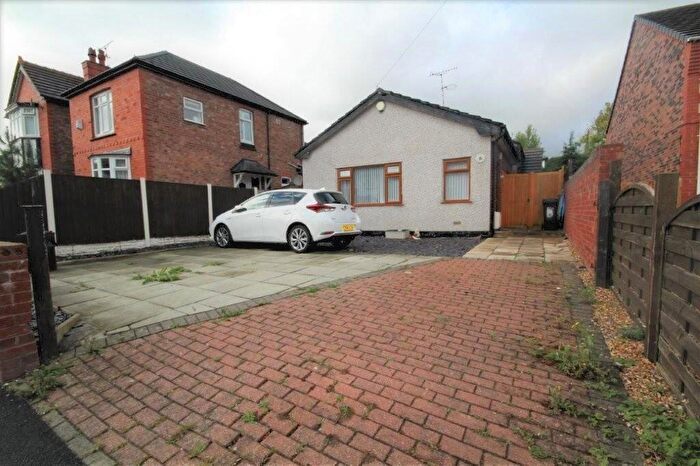
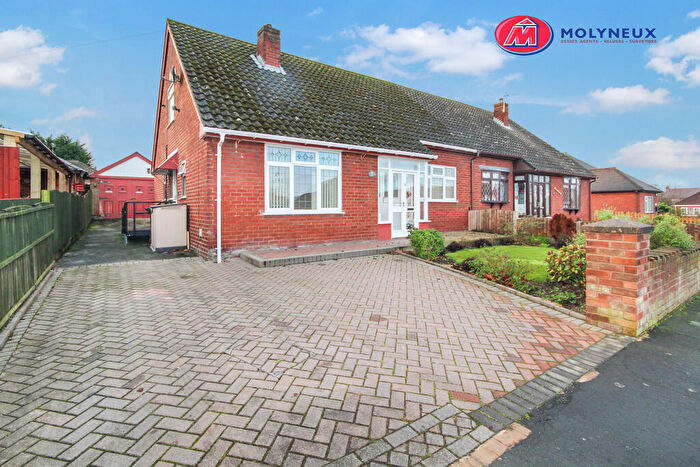
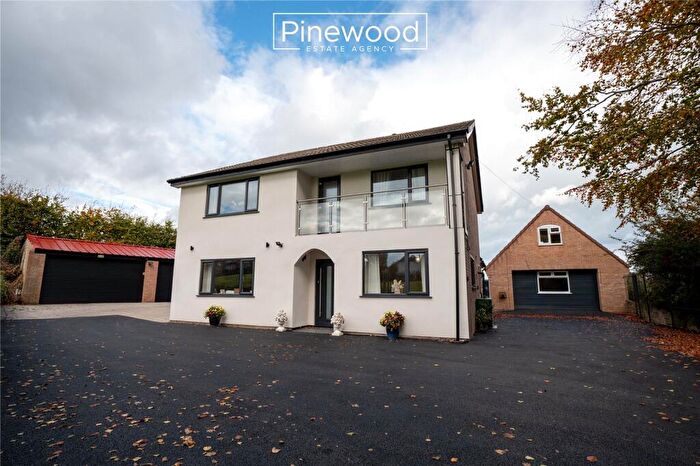
Properties for sale in Shotton East
Roads and Postcodes in Shotton East
Navigate through our locations to find the location of your next house in Shotton East, Deeside for sale or to rent.
| Streets | Postcodes |
|---|---|
| Rowleys Drive | CH5 1PP CH5 1PU CH5 1PY |
| Ash Grove | CH5 1AF CH5 1AG CH5 1AB |
| Ashfield Road | CH5 1AQ |
| Butler Street | CH5 1AP |
| Caernarvon Close | CH5 1AR CH5 1AS |
| Chester Close | CH5 1AU CH5 1AX CH5 1AY |
| Chester Road East | CH5 1QA CH5 1QB CH5 1JJ |
| Clarence Street | CH5 1AW |
| Connaught Avenue | CH5 1BB |
| Gloucester Avenue | CH5 1BA |
| Greenbank Road | CH5 1QY |
| Health Street | CH5 1PZ |
| Henrietta Street | CH5 1AJ CH5 1BJ |
| High Croft | CH5 1QZ |
| Holly Villas | CH5 1RA |
| Jubilee Street | CH5 1DQ |
| Kensington Avenue | CH5 1BH |
| Kent Avenue | CH5 1BE |
| Ketland Close | CH5 1QX |
| Killins Lane | CH5 1RE |
| Lavender Court | CH5 1QQ |
| Marina Drive | CH5 1AZ |
| Nelson Street | CH5 1DH CH5 1DJ |
| Park Avenue | CH5 1QN |
| Rowleys Park | CH5 1QJ |
| Shotton Lane | CH5 1QS CH5 1QW CH5 1QT |
| St Davids Drive | CH5 1AT |
| Stanley Place | CH5 1BQ |
| Strickland Street | CH5 1AL CH5 1AN |
| Wellington Street | CH5 1AH CH5 1BF |
| Windsor Avenue | CH5 1BD |
| York Avenue | CH5 1BG |
| CH5 1AD |
Transport near Shotton East
- FAQ
- Price Paid By Year
- Property Type Price
Frequently asked questions about Shotton East
What is the average price for a property for sale in Shotton East?
The average price for a property for sale in Shotton East is £138,800. This amount is 33% lower than the average price in Deeside. There are 346 property listings for sale in Shotton East.
What streets have the most expensive properties for sale in Shotton East?
The streets with the most expensive properties for sale in Shotton East are High Croft at an average of £236,700, Shotton Lane at an average of £204,500 and Kensington Avenue at an average of £195,000.
What streets have the most affordable properties for sale in Shotton East?
The streets with the most affordable properties for sale in Shotton East are Ashfield Road at an average of £95,000, Butler Street at an average of £95,968 and Clarence Street at an average of £101,000.
Which train stations are available in or near Shotton East?
Some of the train stations available in or near Shotton East are Shotton, Hawarden Bridge and Hawarden.
Property Price Paid in Shotton East by Year
The average sold property price by year was:
| Year | Average Sold Price | Price Change |
Sold Properties
|
|---|---|---|---|
| 2025 | £154,767 | -3% |
14 Properties |
| 2024 | £158,858 | 11% |
31 Properties |
| 2023 | £141,587 | 20% |
31 Properties |
| 2022 | £113,617 | -6% |
37 Properties |
| 2021 | £120,126 | -2% |
43 Properties |
| 2020 | £122,944 | 8% |
18 Properties |
| 2019 | £112,633 | -7% |
24 Properties |
| 2018 | £120,269 | 8% |
26 Properties |
| 2017 | £110,424 | -6% |
27 Properties |
| 2016 | £116,625 | 10% |
24 Properties |
| 2015 | £104,572 | 14% |
27 Properties |
| 2014 | £89,979 | -3% |
24 Properties |
| 2013 | £92,861 | -11% |
18 Properties |
| 2012 | £102,841 | 9% |
11 Properties |
| 2011 | £93,884 | -0,4% |
13 Properties |
| 2010 | £94,283 | -1% |
12 Properties |
| 2009 | £95,261 | -4% |
17 Properties |
| 2008 | £98,750 | -22% |
13 Properties |
| 2007 | £120,125 | 12% |
38 Properties |
| 2006 | £105,798 | 10% |
29 Properties |
| 2005 | £94,793 | 3% |
44 Properties |
| 2004 | £92,104 | 31% |
61 Properties |
| 2003 | £63,881 | 23% |
48 Properties |
| 2002 | £48,912 | 10% |
49 Properties |
| 2001 | £44,021 | 18% |
46 Properties |
| 2000 | £36,030 | 9% |
42 Properties |
| 1999 | £32,795 | - |
20 Properties |
| 1998 | £32,810 | -0,1% |
30 Properties |
| 1997 | £32,842 | -7% |
25 Properties |
| 1996 | £35,213 | 9% |
30 Properties |
| 1995 | £32,022 | - |
20 Properties |
Property Price per Property Type in Shotton East
Here you can find historic sold price data in order to help with your property search.
The average Property Paid Price for specific property types in the last three years are:
| Property Type | Average Sold Price | Sold Properties |
|---|---|---|
| Semi Detached House | £169,342.00 | 45 Semi Detached Houses |
| Detached House | £203,166.00 | 6 Detached Houses |
| Terraced House | £115,102.00 | 54 Terraced Houses |
| Flat | £78,687.00 | 8 Flats |

