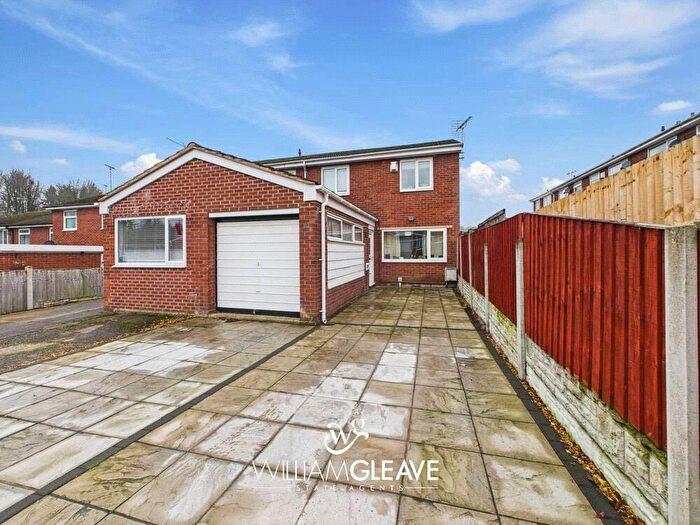
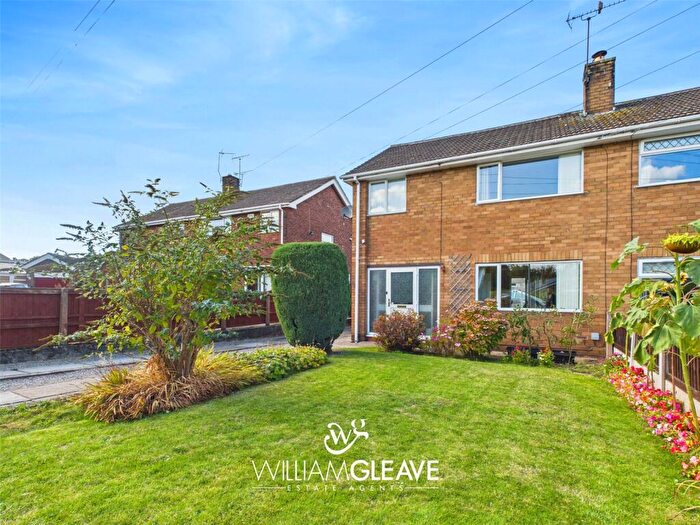
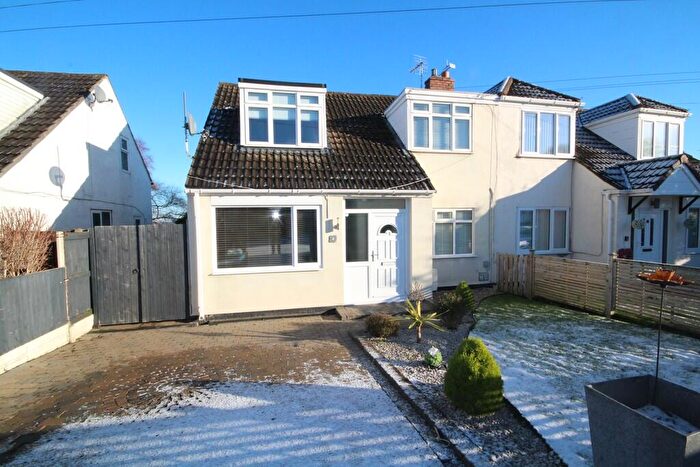
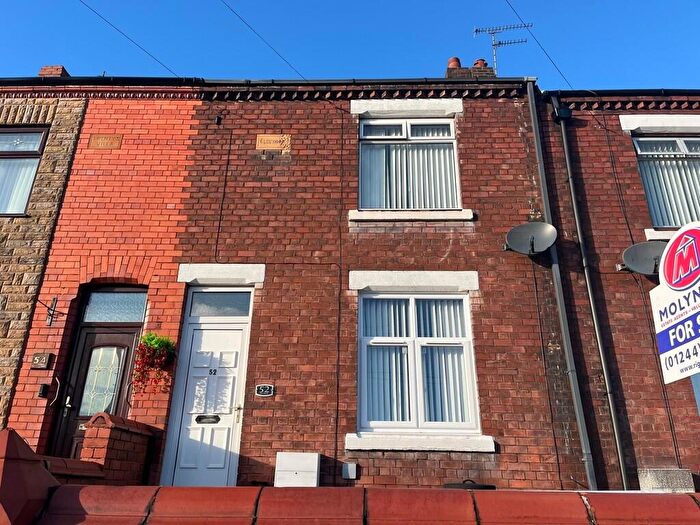
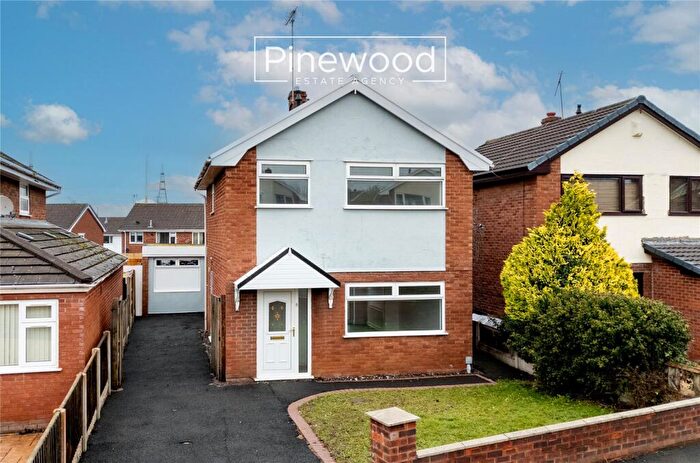
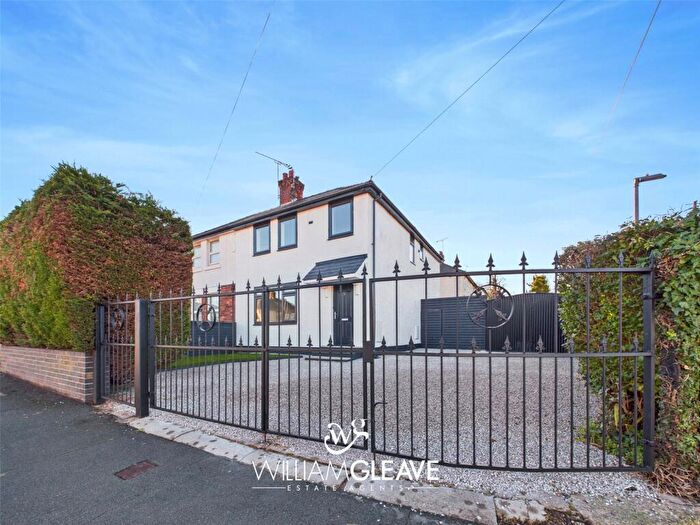
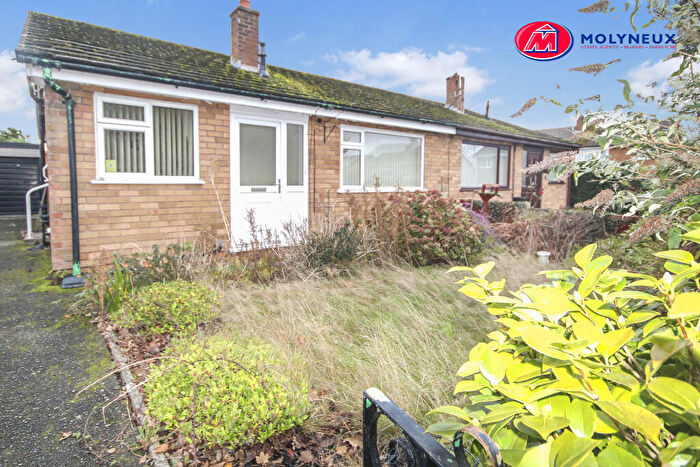
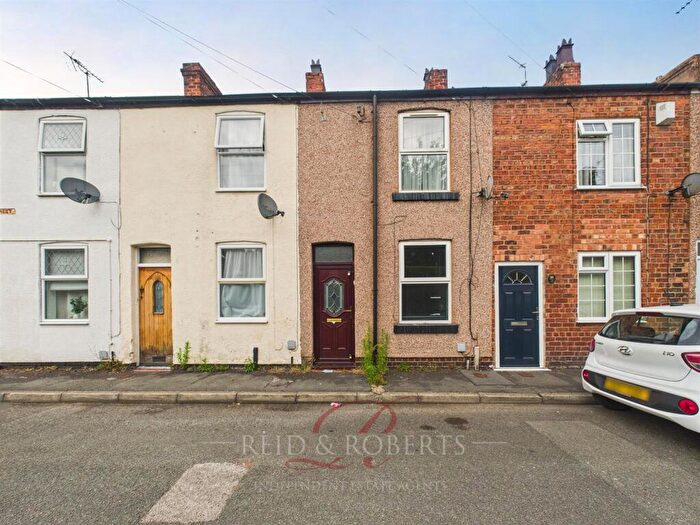
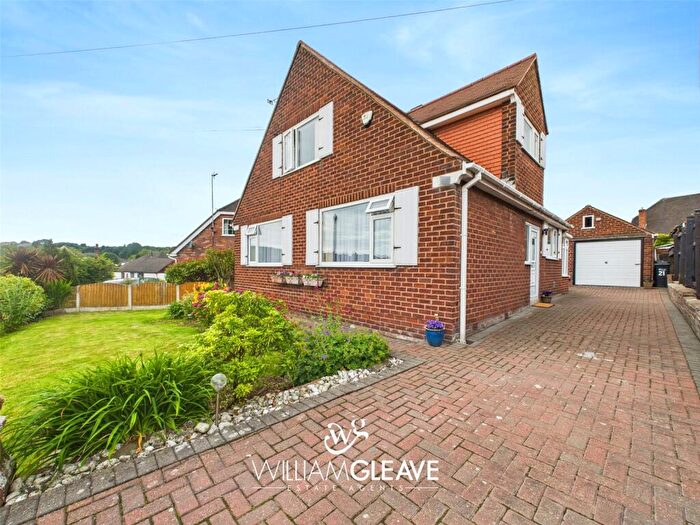
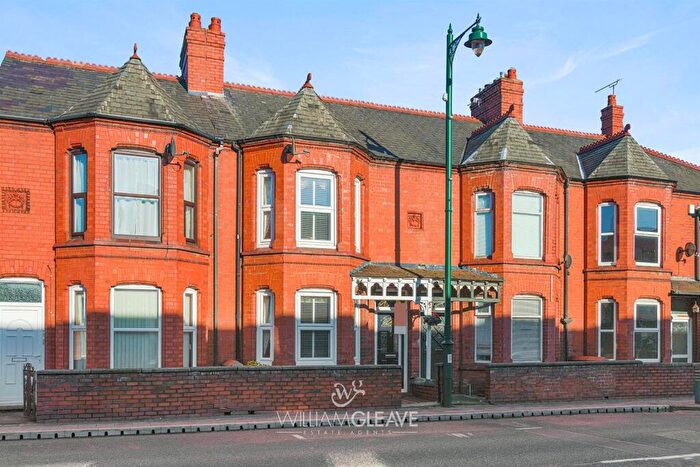
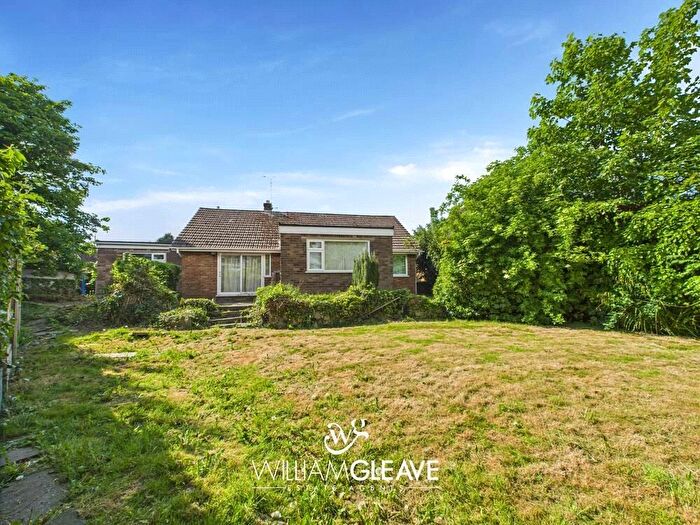
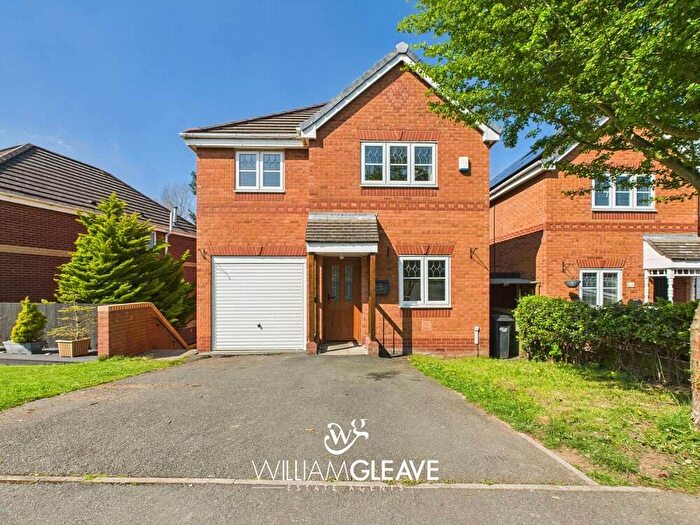
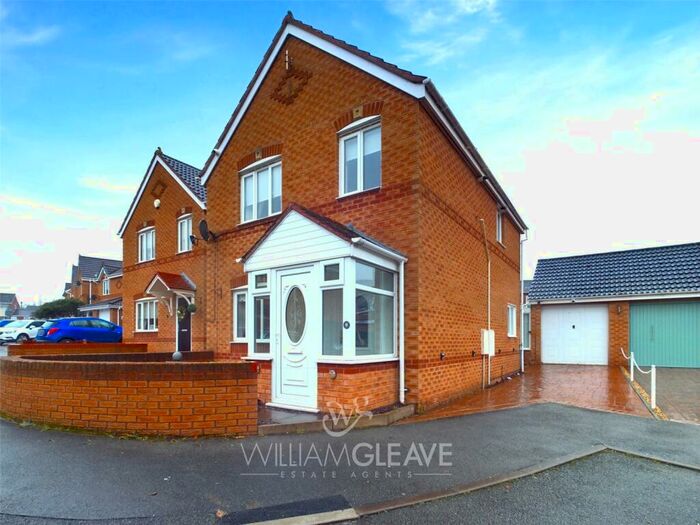
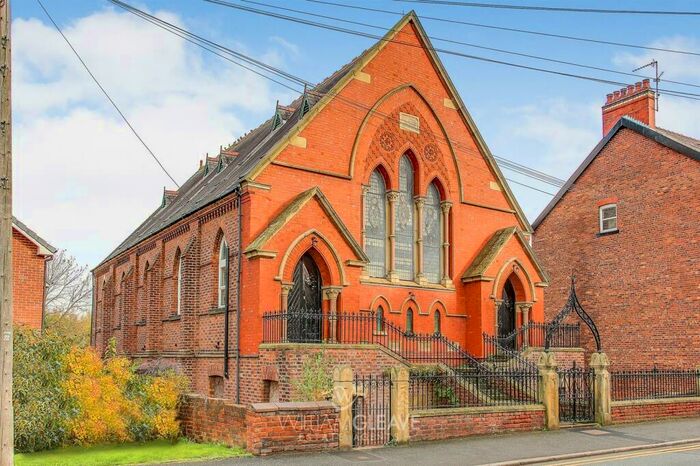
Houses for sale & to rent in Connahs Quay Central, Deeside
House Prices in Connahs Quay Central
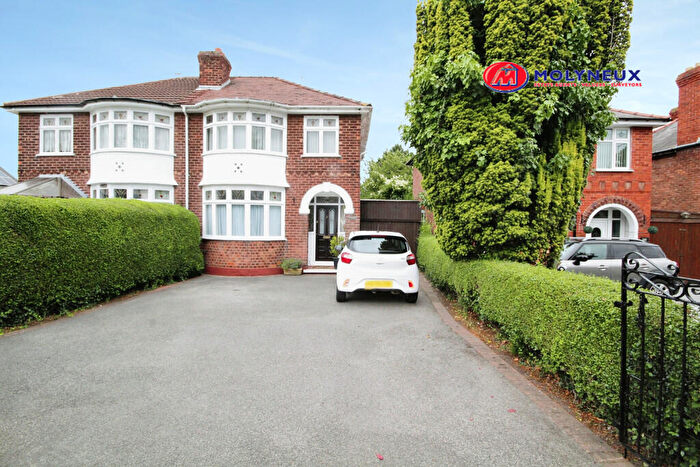
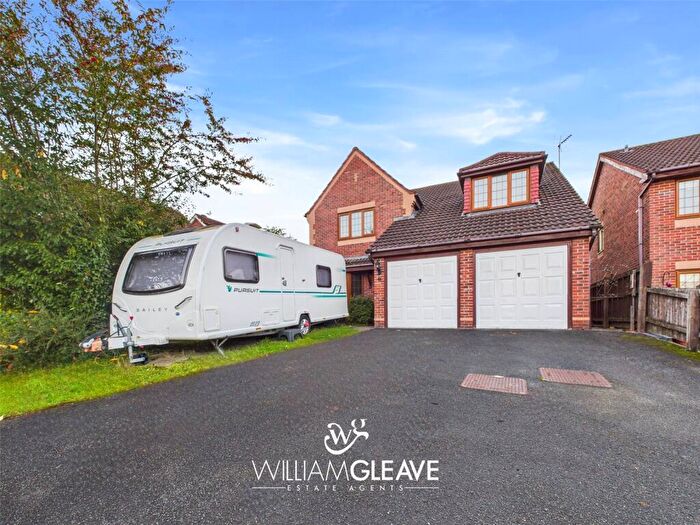
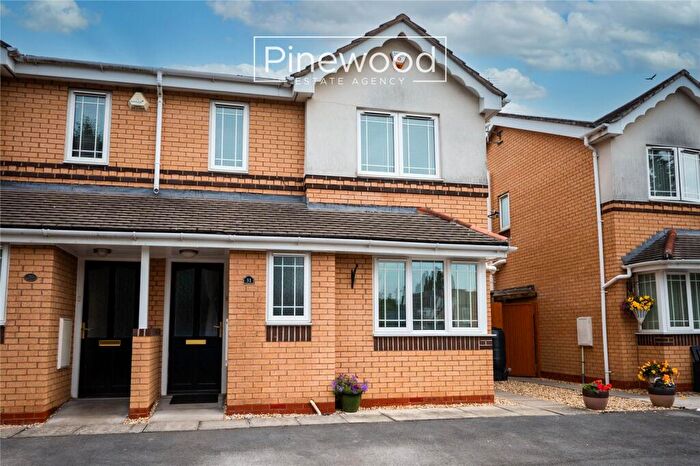
Properties in Connahs Quay Central have an average house price of £151,611.54 and had 182 Property Transactions within the last 3 years¹.
Connahs Quay Central is an area in Deeside, Sir y Fflint - Flintshire with 1,470 households², where the most expensive property was sold for £365,000.00.
Properties for sale in Connahs Quay Central
Roads and Postcodes in Connahs Quay Central
Navigate through our locations to find the location of your next house in Connahs Quay Central, Deeside for sale or to rent.
| Streets | Postcodes |
|---|---|
| Arnold Grove | CH5 4QG |
| Beechwood Avenue | CH5 4ST |
| Bethel Place | CH5 4DW |
| Bryn Arnold | CH5 4ED |
| Bryn Cae Place | CH5 4AN |
| Bryn Road | CH5 4UT |
| Burton Court | CH5 4SF |
| Cable Street | CH5 4DZ |
| Cambrian Close | CH5 4RD |
| Celyn Avenue | CH5 4SZ |
| Cestrian Street | CH5 4EF CH5 4EG |
| Chandlers Court | CH5 4DU |
| Chapel Court | CH5 4SB |
| Chapel Street | CH5 4SA CH5 4WR |
| Church Hill | CH5 4AD |
| Deans Avenue | CH5 4QF |
| Deans Place | CH5 4EB |
| Derwen Close | CH5 4AU |
| Dock Road | CH5 4DS |
| Dodds Drive | CH5 4NR CH5 4NS CH5 4NT |
| Dunlin Avenue | CH5 4BD |
| Englefield Avenue | CH5 4SU CH5 4SX CH5 4SY CH5 4SE |
| Farfield Avenue | CH5 4SL |
| Fisherman's Road | CH5 4ET CH5 4EU CH5 4EY CH5 4EZ |
| Garratt Close | CH5 4SG |
| Garthorpe Avenue | CH5 4AE CH5 4AF CH5 4AP CH5 4AW |
| Garthorpe Close | CH5 4PN |
| Glan Y Morfa Court | CH5 4PL |
| Glynne Street | CH5 4RA |
| Gornel Avenue | CH5 4SS |
| Green Park | CH5 4QJ |
| Gwylan Avenue | CH5 4AT |
| High Street | CH5 4DH CH5 4DJ CH5 4DP CH5 4DQ CH5 4DR CH5 4DB |
| Howard Street | CH5 4QH CH5 4QQ |
| Isabella Court | CH5 4UH |
| Leighton Court | CH5 4AB |
| Linden Avenue | CH5 4SN CH5 4SW |
| Linden Court | CH5 4WA |
| Lynfield Close | CH5 4TR |
| Maude Street | CH5 4EQ |
| Mold Road | CH5 4QN CH5 4QP |
| Nant Road | CH5 4AL |
| New Street | CH5 4EH |
| Osbourne Court | CH5 4BS |
| Pen Y Llan | CH5 4UW |
| Pen Y Llan Street | CH5 4US |
| Pennant Street | CH5 4NP |
| Pinewood Avenue | CH5 4SJ CH5 4SQ |
| Primrose Hill | CH5 4QA |
| Primrose Street | CH5 4QB |
| Princes Street | CH5 4QD CH5 4QE |
| Railway Terrace | CH5 4DX |
| Red Hall Precinct | CH5 4TS |
| Redhall Avenue | CH5 4RB |
| Royal Court | CH5 4RQ |
| St Davids Drive | CH5 4SP CH5 4SR |
| St Marks Avenue | CH5 4FH |
| St Marks Mews | CH5 4AH |
| Stone Row | CH5 4DY |
| Summerville Close | CH5 4XW |
| Tuscan Way | CH5 4FN |
| Weighbridge Road | CH5 2LW |
| Weighbridge Road Industrial Park | CH5 2NH CH5 2UL |
| Wesley Street | CH5 4EE |
| Windermere Avenue | CH5 4NW |
| CH5 4DL CH5 4FQ |
Transport near Connahs Quay Central
- FAQ
- Price Paid By Year
- Property Type Price
Frequently asked questions about Connahs Quay Central
What is the average price for a property for sale in Connahs Quay Central?
The average price for a property for sale in Connahs Quay Central is £151,612. This amount is 27% lower than the average price in Deeside. There are 442 property listings for sale in Connahs Quay Central.
What streets have the most expensive properties for sale in Connahs Quay Central?
The streets with the most expensive properties for sale in Connahs Quay Central are Celyn Avenue at an average of £247,750, Chandlers Court at an average of £227,750 and St Davids Drive at an average of £183,732.
What streets have the most affordable properties for sale in Connahs Quay Central?
The streets with the most affordable properties for sale in Connahs Quay Central are Dock Road at an average of £55,000, Stone Row at an average of £60,000 and Pen Y Llan Street at an average of £72,500.
Which train stations are available in or near Connahs Quay Central?
Some of the train stations available in or near Connahs Quay Central are Shotton, Hawarden Bridge and Hawarden.
Property Price Paid in Connahs Quay Central by Year
The average sold property price by year was:
| Year | Average Sold Price | Price Change |
Sold Properties
|
|---|---|---|---|
| 2025 | £155,907 | 4% |
27 Properties |
| 2024 | £149,558 | -8% |
49 Properties |
| 2023 | £161,657.27 | 12% |
55 Properties |
| 2022 | £141,909.62 | 11% |
52 Properties |
| 2021 | £126,191 | -9% |
56 Properties |
| 2020 | £138,101.39 | 5% |
36 Properties |
| 2019 | £131,387.25 | 5% |
51 Properties |
| 2018 | £124,169.48 | 12% |
77 Properties |
| 2017 | £109,433 | -8% |
43 Properties |
| 2016 | £118,088 | -2% |
44 Properties |
| 2015 | £120,421 | 22% |
39 Properties |
| 2014 | £93,338 | -8% |
36 Properties |
| 2013 | £100,948 | 7% |
31 Properties |
| 2012 | £93,630 | -6% |
18 Properties |
| 2011 | £99,689 | -8% |
28 Properties |
| 2010 | £107,166 | 2% |
21 Properties |
| 2009 | £105,479 | -10% |
27 Properties |
| 2008 | £116,088 | -3% |
28 Properties |
| 2007 | £119,971 | 11% |
65 Properties |
| 2006 | £106,848 | 6% |
75 Properties |
| 2005 | £99,985 | 15% |
45 Properties |
| 2004 | £84,746 | 22% |
75 Properties |
| 2003 | £66,437 | 19% |
82 Properties |
| 2002 | £53,633 | 11% |
82 Properties |
| 2001 | £47,540 | 11% |
55 Properties |
| 2000 | £42,255 | -2% |
55 Properties |
| 1999 | £43,239 | 14% |
23 Properties |
| 1998 | £37,119 | 3% |
29 Properties |
| 1997 | £35,981 | 4% |
36 Properties |
| 1996 | £34,386 | 7% |
34 Properties |
| 1995 | £31,855 | - |
27 Properties |
Property Price per Property Type in Connahs Quay Central
Here you can find historic sold price data in order to help with your property search.
The average Property Paid Price for specific property types in the last three years are:
| Property Type | Average Sold Price | Sold Properties |
|---|---|---|
| Semi Detached House | £153,699.00 | 54 Semi Detached Houses |
| Detached House | £220,751.00 | 37 Detached Houses |
| Terraced House | £130,790.67 | 75 Terraced Houses |
| Flat | £82,278.00 | 16 Flats |

