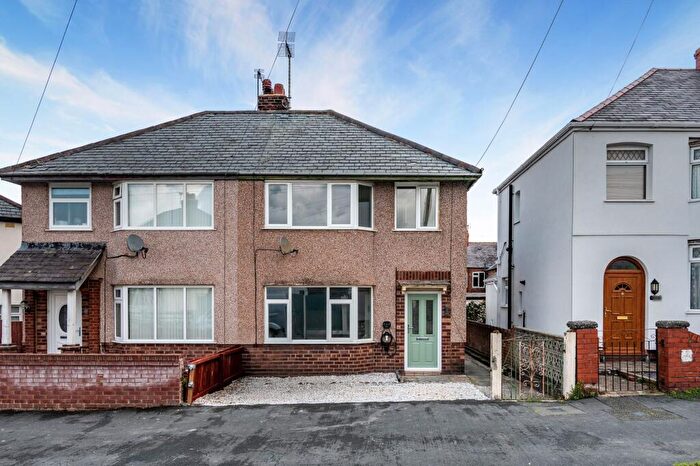
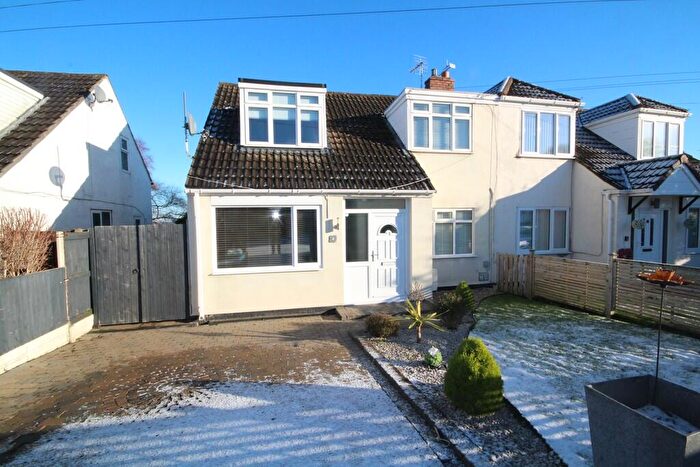
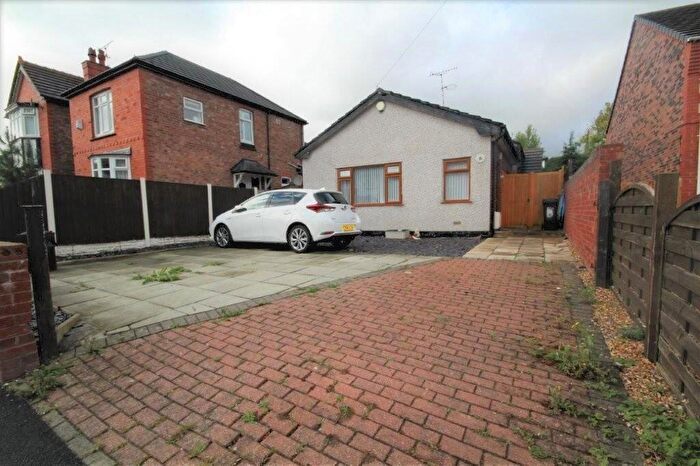
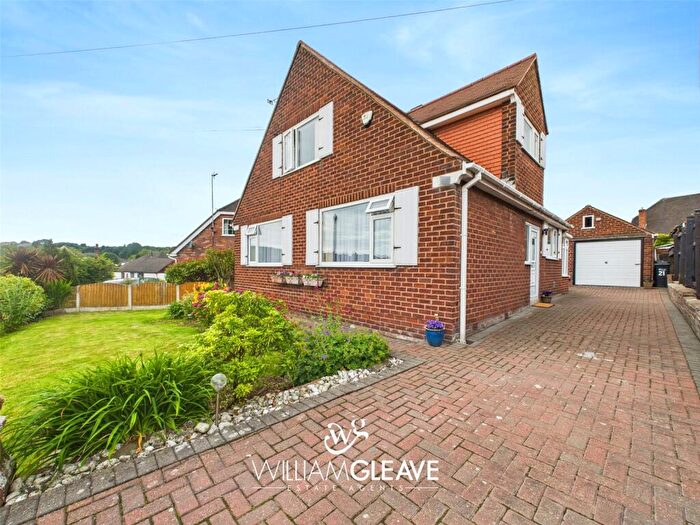
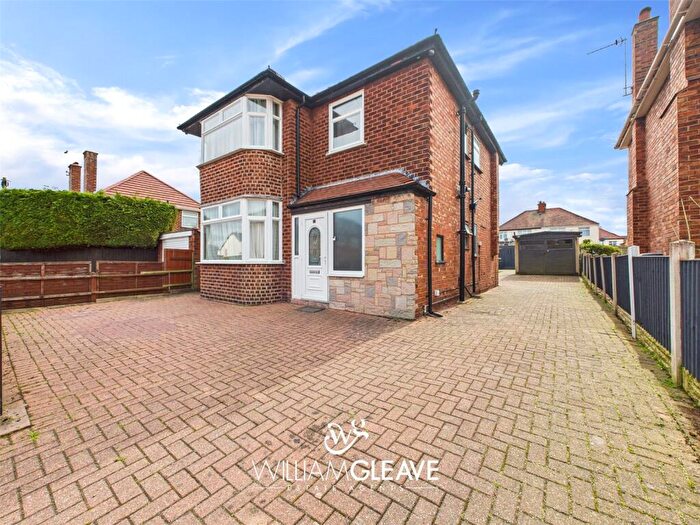
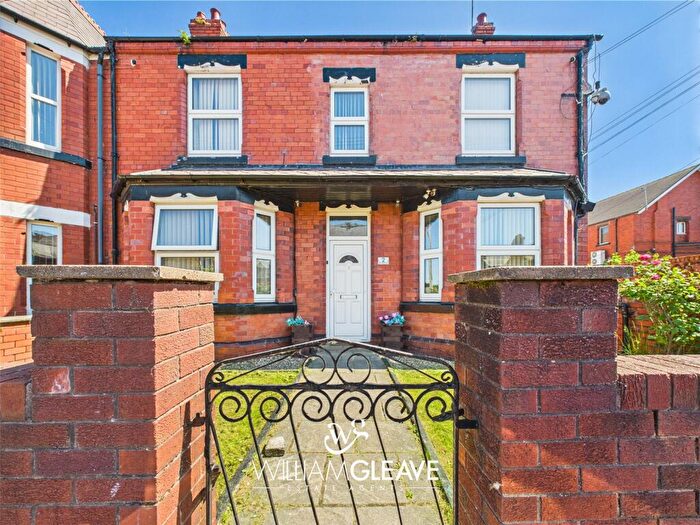
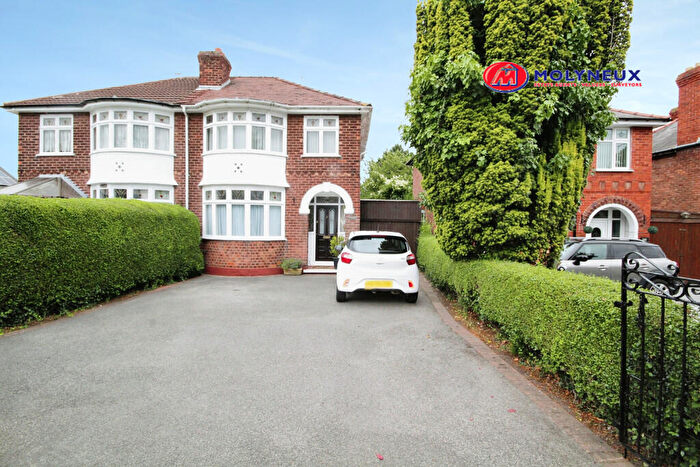
Houses for sale & to rent in Connahs Quay Wepre, Deeside
House Prices in Connahs Quay Wepre
Properties in Connahs Quay Wepre have an average house price of £201,159.62 and had 130 Property Transactions within the last 3 years¹.
Connahs Quay Wepre is an area in Deeside, Sir y Fflint - Flintshire with 931 households², where the most expensive property was sold for £425,000.00.
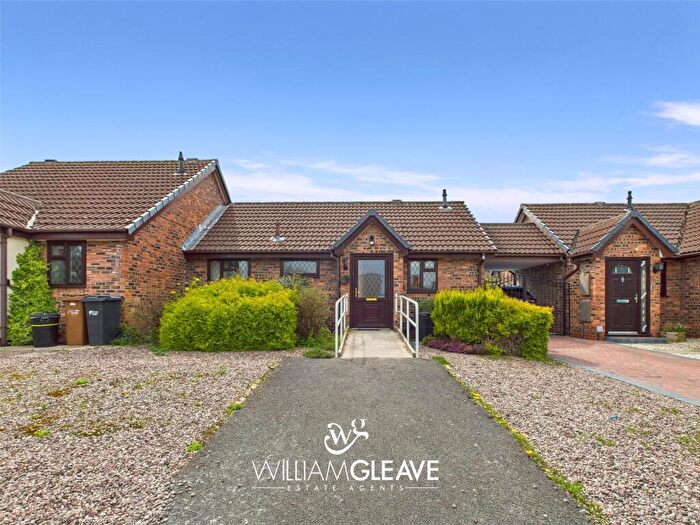
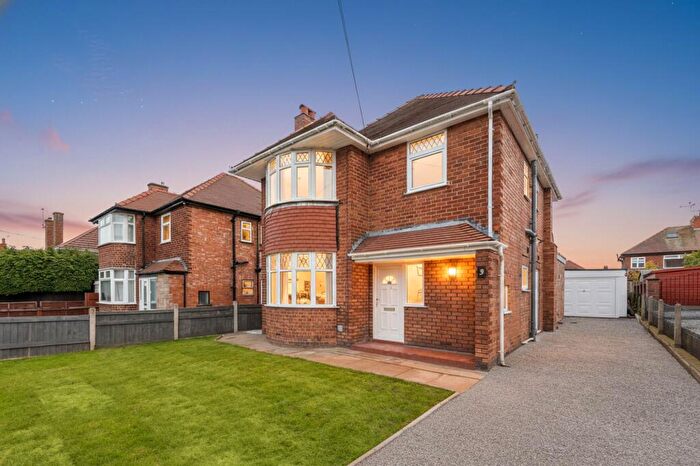
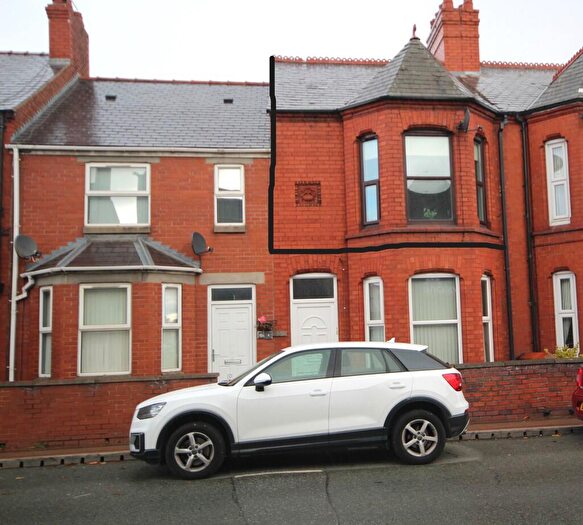
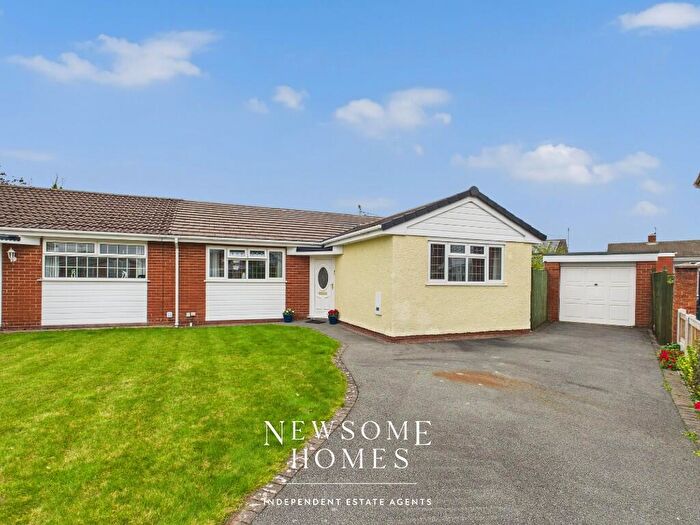
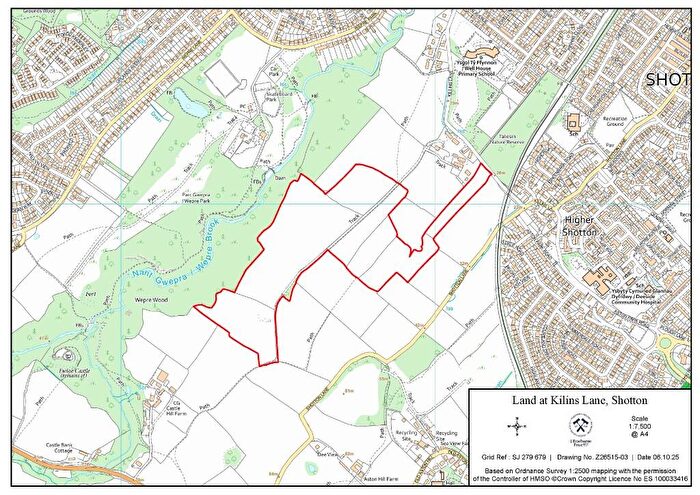
Properties for sale in Connahs Quay Wepre
Roads and Postcodes in Connahs Quay Wepre
Navigate through our locations to find the location of your next house in Connahs Quay Wepre, Deeside for sale or to rent.
| Streets | Postcodes |
|---|---|
| Alwen Drive | CH5 4RG |
| Belmont Avenue | CH5 4PD |
| Belmont Villas | CH5 4PE |
| Breeze Hill | CH5 4NU |
| Celtic Street | CH5 4EJ |
| Custom House Court | CH5 4FG |
| Dee Road | CH5 4NX CH5 4NY CH5 4NZ CH5 4PA CH5 4PB |
| Eaton Avenue | CH5 4HR |
| Firbrook Avenue | CH5 4PF |
| Fron Road | CH5 4PH CH5 4PJ CH5 4PQ |
| Hall Lane | CH5 4LY |
| Henley Avenue | CH5 4HT |
| High Street | CH5 4DA CH5 4DD CH5 4DF |
| Maes Y Berllan | CH5 4FD |
| Marlowe Avenue | CH5 4HS |
| Marsh View | CH5 4ER |
| Mill Lane | CH5 4HF |
| Milldown Court | CH5 4NN |
| Mold Road | CH5 4NL CH5 4QL CH5 4QW |
| Morley Avenue | CH5 4RE |
| Oakwood Villas | CH5 4EL |
| Park Grove | CH5 4HU |
| Poplar Close | CH5 4JA |
| Quarry Lane | CH5 4PG |
| Radford Close | CH5 4WN |
| Richmond Road | CH5 4JB CH5 4JD CH5 4JE CH5 4JF |
| Spring Street | CH5 4FL |
| St Davids Court | CH5 4EW |
| Thornfield Avenue | CH5 4HX |
| Weighbridge Road | CH5 2LF |
| Weighbridge Road Industrial Park | CH5 2LL |
| Wepre Brook Gardens | CH5 4BT |
| Wepre Drive | CH5 4HA |
| Wepre Hall Crescent | CH5 4HZ |
| Wepre Park | CH5 4HJ CH5 4HL CH5 4HN CH5 4HW |
| Windsor Avenue | CH5 4HP |
| Woodfield Close | CH5 4RF |
Transport near Connahs Quay Wepre
- FAQ
- Price Paid By Year
- Property Type Price
Frequently asked questions about Connahs Quay Wepre
What is the average price for a property for sale in Connahs Quay Wepre?
The average price for a property for sale in Connahs Quay Wepre is £201,160. This amount is 3% lower than the average price in Deeside. There are 448 property listings for sale in Connahs Quay Wepre.
What streets have the most expensive properties for sale in Connahs Quay Wepre?
The streets with the most expensive properties for sale in Connahs Quay Wepre are Belmont Avenue at an average of £325,000, Hall Lane at an average of £306,250 and Wepre Park at an average of £298,750.
What streets have the most affordable properties for sale in Connahs Quay Wepre?
The streets with the most affordable properties for sale in Connahs Quay Wepre are High Street at an average of £114,500, Fron Road at an average of £141,850 and Dee Road at an average of £161,333.
Which train stations are available in or near Connahs Quay Wepre?
Some of the train stations available in or near Connahs Quay Wepre are Shotton, Hawarden Bridge and Hawarden.
Property Price Paid in Connahs Quay Wepre by Year
The average sold property price by year was:
| Year | Average Sold Price | Price Change |
Sold Properties
|
|---|---|---|---|
| 2025 | £201,666 | 6% |
12 Properties |
| 2024 | £188,973 | -12% |
38 Properties |
| 2023 | £211,964 | 1% |
28 Properties |
| 2022 | £208,863.21 | 18% |
53 Properties |
| 2021 | £172,095 | 11% |
52 Properties |
| 2020 | £153,781 | 8% |
32 Properties |
| 2019 | £141,398 | -2% |
50 Properties |
| 2018 | £143,714.47 | -13% |
38 Properties |
| 2017 | £162,808 | 10% |
50 Properties |
| 2016 | £146,213 | 5% |
37 Properties |
| 2015 | £139,171 | 6% |
38 Properties |
| 2014 | £131,200 | 2% |
30 Properties |
| 2013 | £128,336 | -0,1% |
26 Properties |
| 2012 | £128,428 | -5% |
21 Properties |
| 2011 | £135,246 | 1% |
25 Properties |
| 2010 | £133,413 | 7% |
29 Properties |
| 2009 | £124,093 | -17% |
23 Properties |
| 2008 | £144,739 | 3% |
29 Properties |
| 2007 | £139,903 | 1% |
38 Properties |
| 2006 | £138,545 | 9% |
43 Properties |
| 2005 | £126,415 | 15% |
53 Properties |
| 2004 | £107,343 | 14% |
56 Properties |
| 2003 | £92,322 | 23% |
42 Properties |
| 2002 | £70,954 | 15% |
43 Properties |
| 2001 | £60,565 | 7% |
42 Properties |
| 2000 | £56,368 | -9% |
36 Properties |
| 1999 | £61,643 | 20% |
23 Properties |
| 1998 | £49,497 | 15% |
17 Properties |
| 1997 | £42,234 | 4% |
36 Properties |
| 1996 | £40,651 | 2% |
39 Properties |
| 1995 | £39,857 | - |
21 Properties |
Property Price per Property Type in Connahs Quay Wepre
Here you can find historic sold price data in order to help with your property search.
The average Property Paid Price for specific property types in the last three years are:
| Property Type | Average Sold Price | Sold Properties |
|---|---|---|
| Semi Detached House | £185,372.00 | 51 Semi Detached Houses |
| Detached House | £276,875.00 | 44 Detached Houses |
| Terraced House | £136,575.00 | 30 Terraced Houses |
| Flat | £83,400.00 | 5 Flats |

