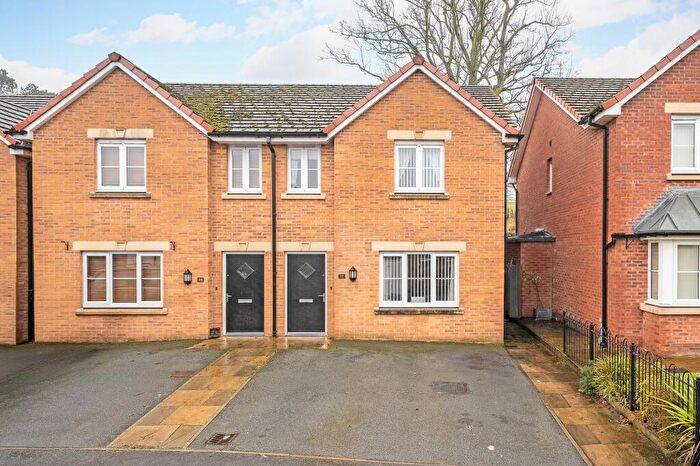
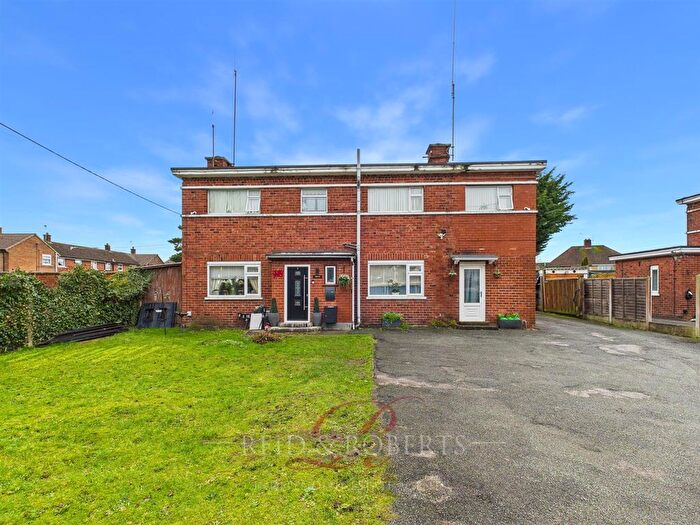
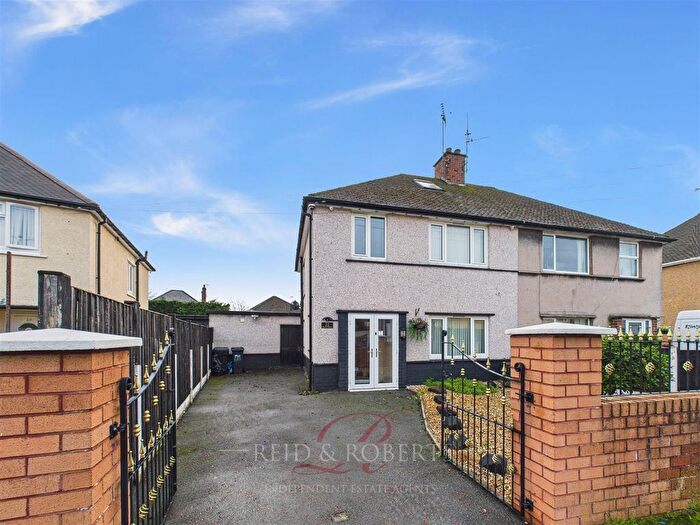
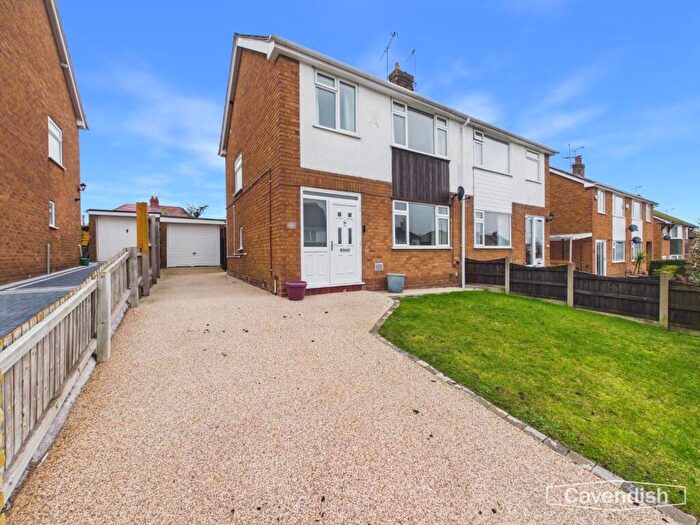
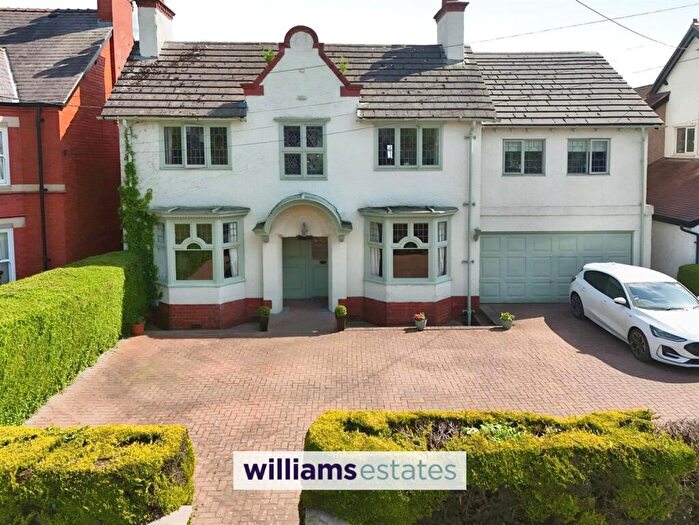
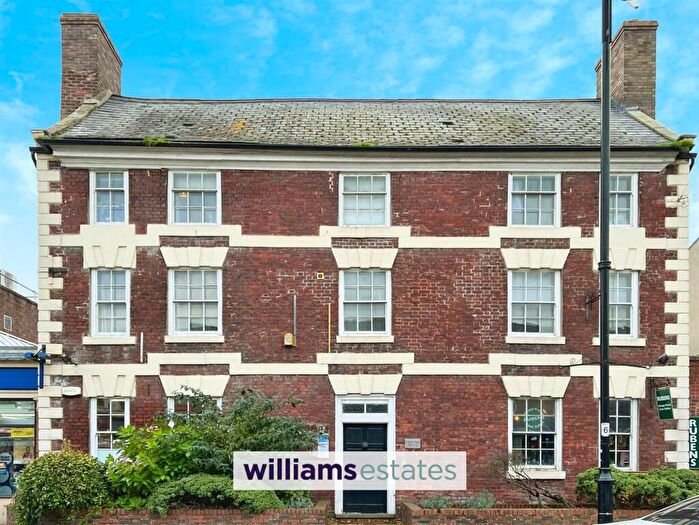
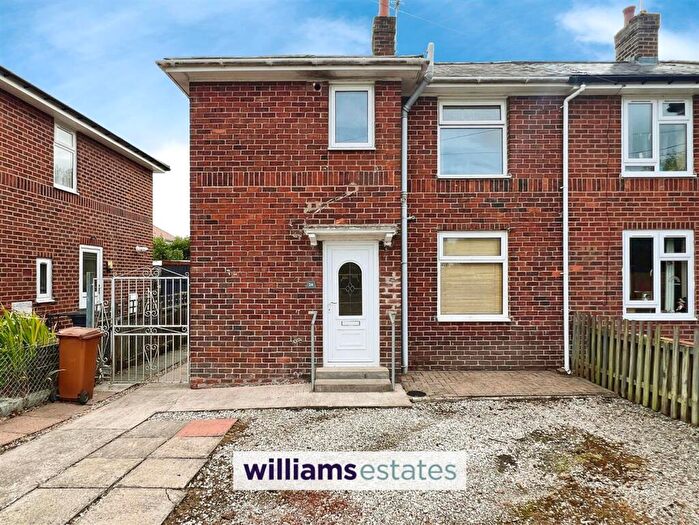
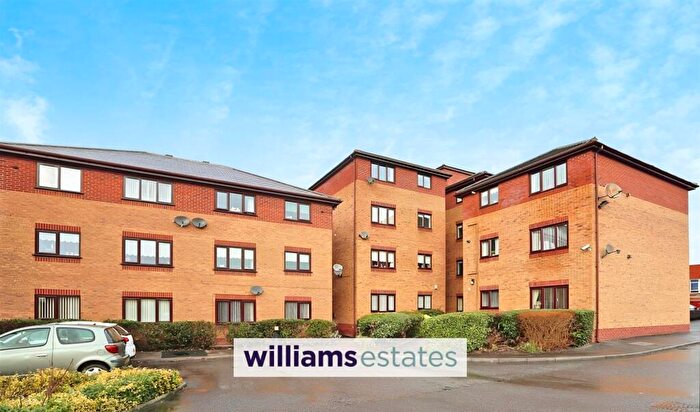
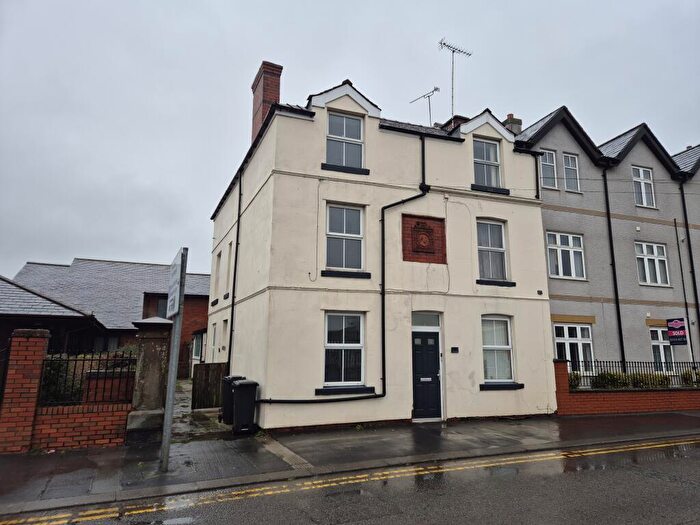
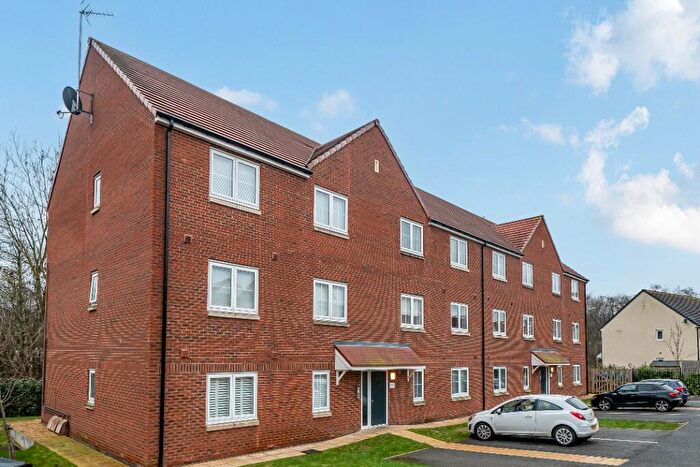
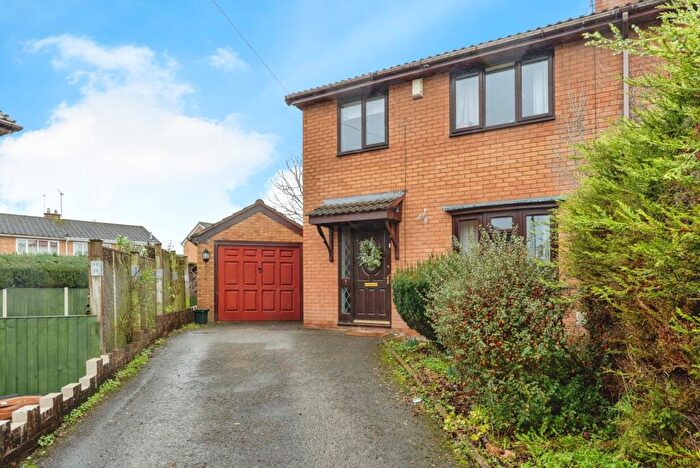
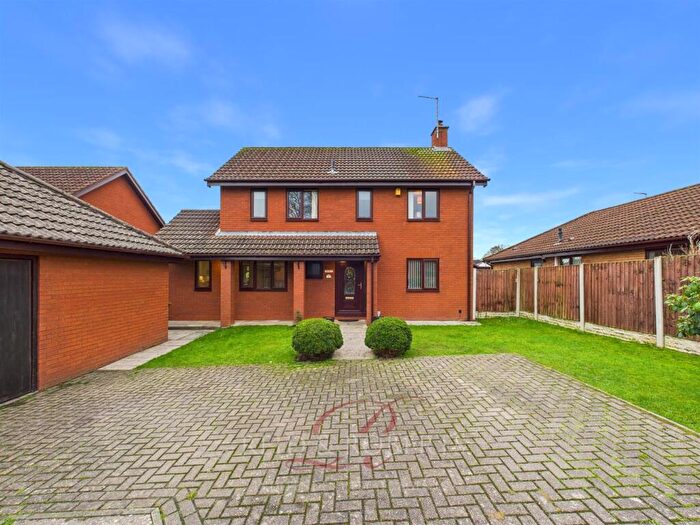
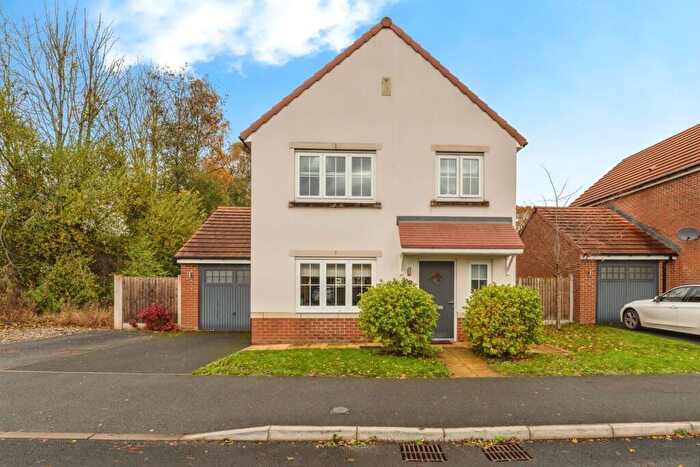
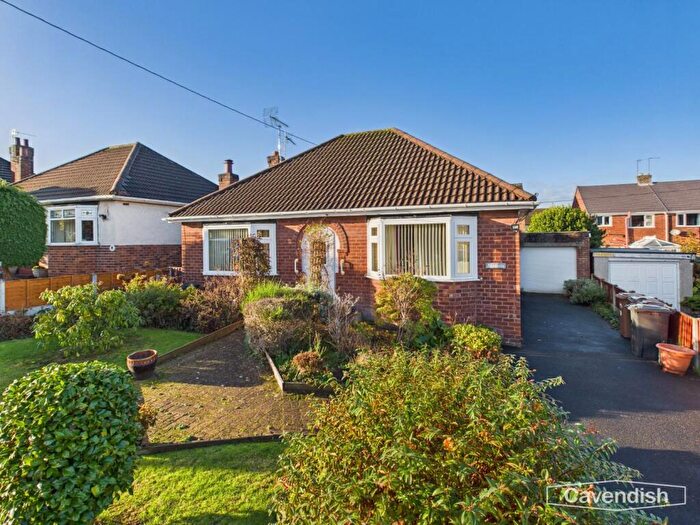
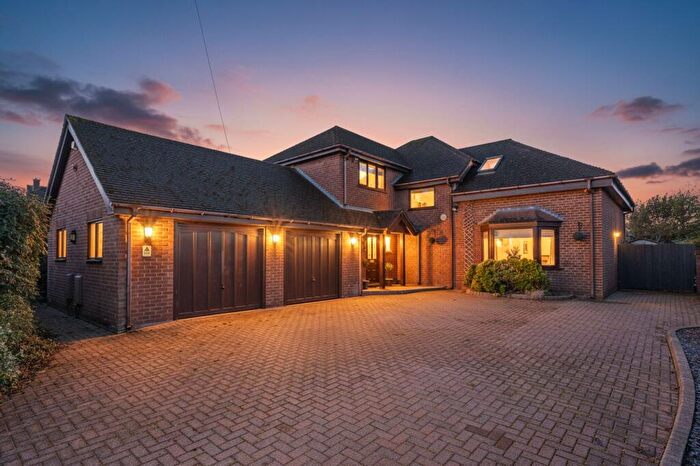
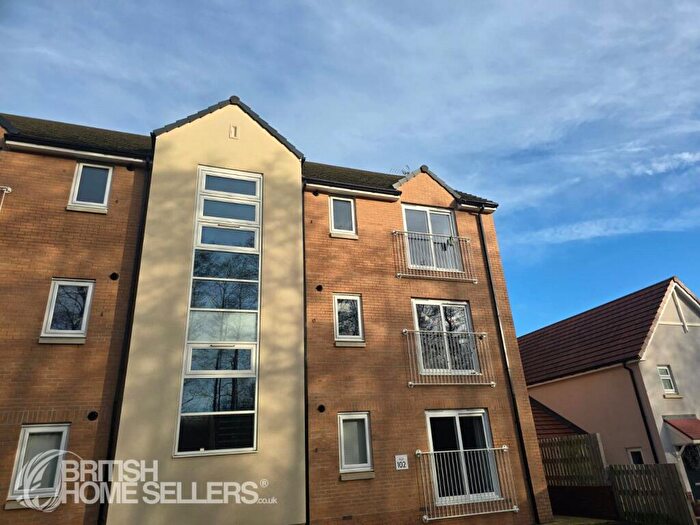
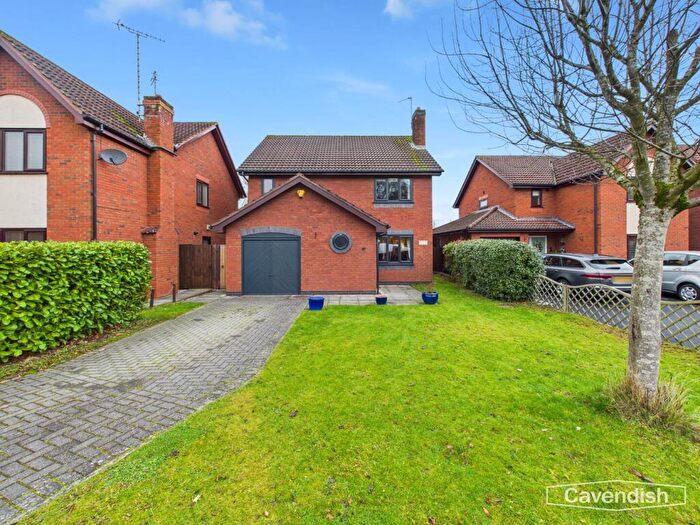
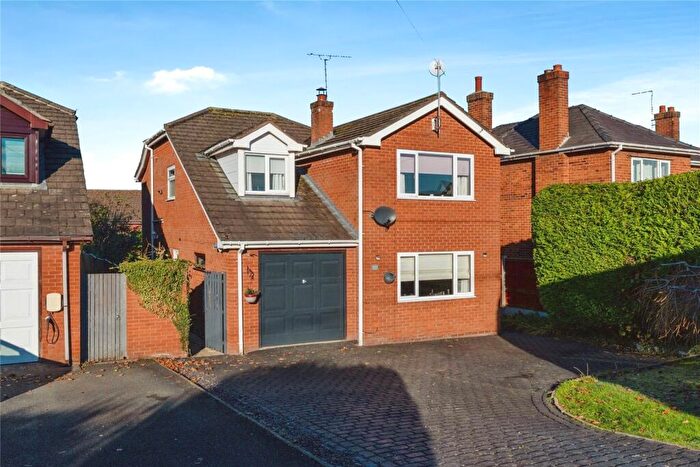
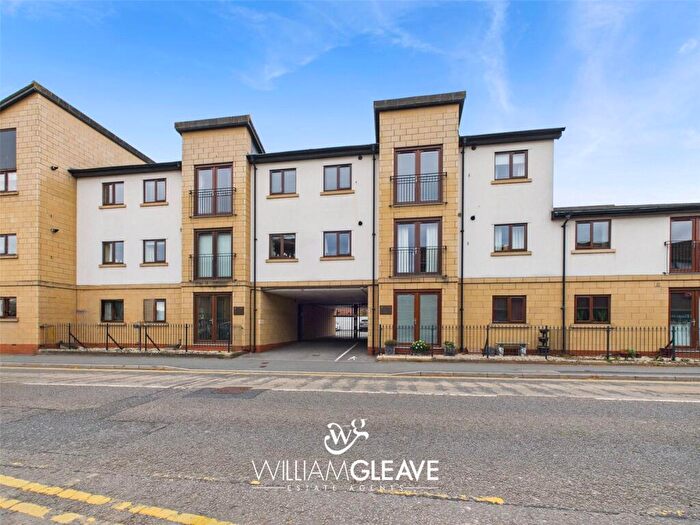
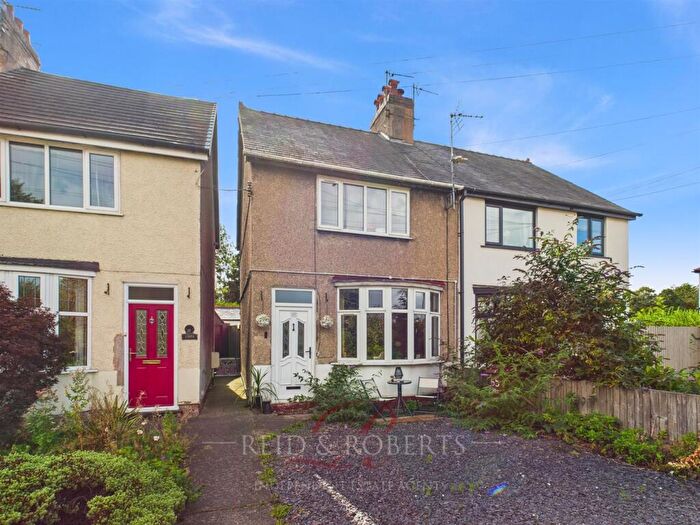
Houses for sale & to rent in Mold West, Mold
House Prices in Mold West
Properties in Mold West have an average house price of £187,922.00 and had 99 Property Transactions within the last 3 years¹.
Mold West is an area in Mold, Sir y Fflint - Flintshire with 1,176 households², where the most expensive property was sold for £510,000.00.
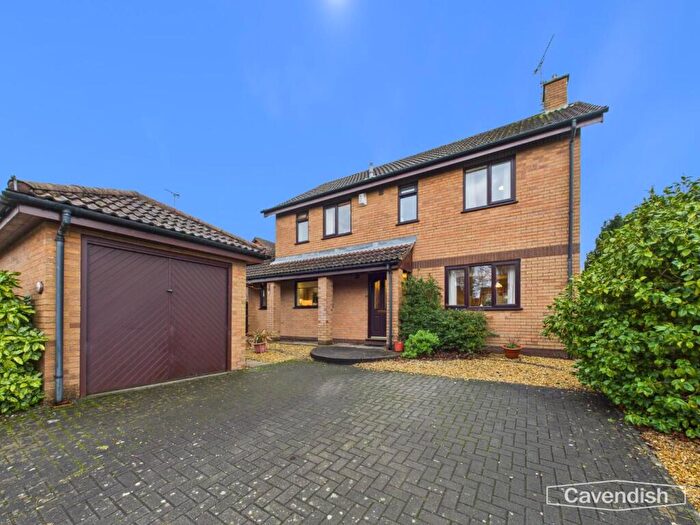
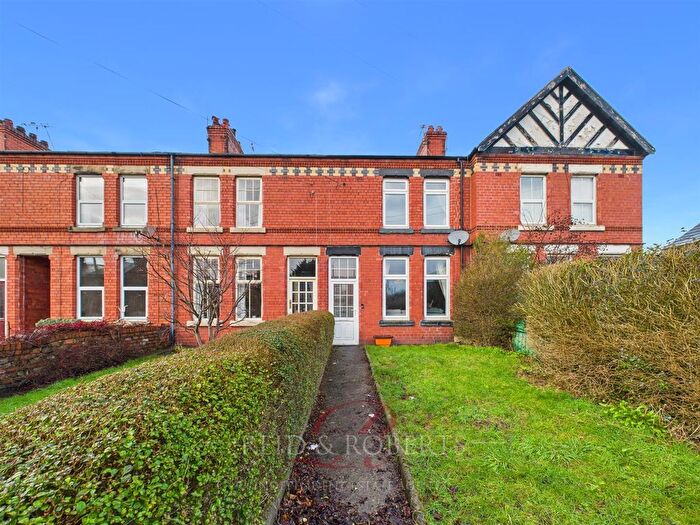
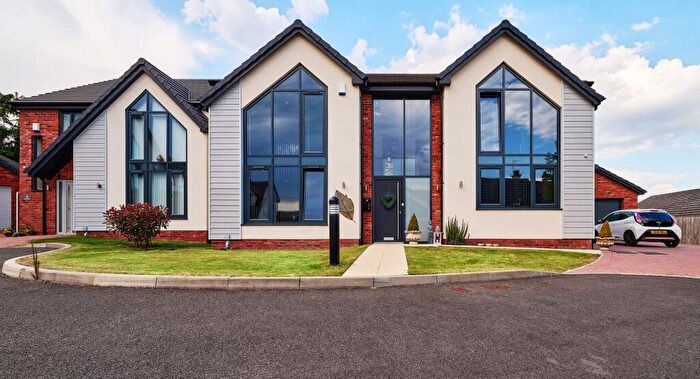
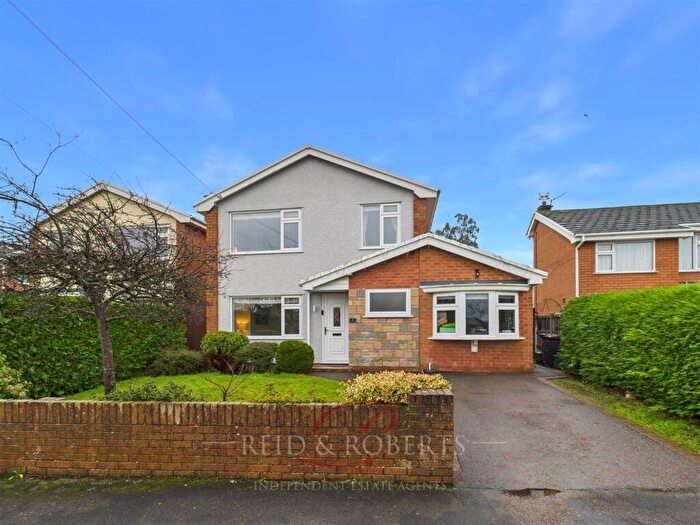
Properties for sale in Mold West
Roads and Postcodes in Mold West
Navigate through our locations to find the location of your next house in Mold West, Mold for sale or to rent.
| Streets | Postcodes |
|---|---|
| Alwyn Close | CH7 1SH |
| Alyn Meadow | CH7 1ND |
| Ash Grove | CH7 1TB CH7 1XG |
| Bailey Villas | CH7 1RD |
| Bedford Way | CH7 1SL |
| Beech Drive | CH7 1TD |
| Beechwood Close | CH7 1RT |
| Blackfriars Court | CH7 1DH |
| Brook Terrace | CH7 1SZ |
| Bryn Noddfa | CH7 1YR |
| Cedar Grove | CH7 1TE |
| Church Lane | CH7 1BW |
| Clayton Road | CH7 1SU CH7 1SY CH7 1SS |
| Denbigh Road | CH7 1BL CH7 1BP CH7 1BF CH7 1BT CH7 1BY CH7 1FT |
| Dreflan | CH7 1DE CH7 1DF |
| Earl Road | CH7 1AD |
| Elm Drive | CH7 1SF CH7 1SG |
| Ffordd Pennant | CH7 1RP CH7 1RR |
| Fir Grove | CH7 1RX |
| Gwernaffield Road | CH7 1RE CH7 1RN CH7 1RQ CH7 5DA CH7 1RG |
| Hafod Alyn | CH7 1RF |
| Hawthorn Avenue | CH7 1SA CH7 1SB |
| Hazel Grove | CH7 1SD |
| Henffordd | CH7 1NQ |
| High Street | CH7 1BQ |
| Hill Grove | CH7 1RB |
| Hillside Crescent | CH7 1RL |
| Holly Drive | CH7 1SE |
| Ivy Crescent | CH7 1RZ |
| Jasmine Crescent | CH7 1WT |
| King Street | CH7 1LA |
| Llys Daniel Owen | CH7 1SW |
| Llys Mervyn | CH7 1XR |
| Maes Owen | CH7 1DA |
| Maesydre | CH7 1BU |
| Meadowside | CH7 1SJ |
| Milford Street | CH7 1GP CH7 1NE CH7 1NF CH7 1BG CH7 1NW |
| Oakwood Close | CH7 1RS |
| Orchard Way | CH7 1SQ |
| Park Avenue | CH7 1RY |
| Pine Tree Court | CH7 1UA |
| Pwll Glas | CH7 1RA |
| Queens Park | CH7 1TF CH7 1TG CH7 1TQ |
| Shire View | CH7 1DG |
| St Marys Mews | CH7 1NT |
| Sunny Ridge | CH7 1RU |
| Tai Maes | CH7 1RW |
| Wesley Place | CH7 1BX |
| CH7 1GJ CH7 1RH CH7 1XF |
Transport near Mold West
- FAQ
- Price Paid By Year
- Property Type Price
Frequently asked questions about Mold West
What is the average price for a property for sale in Mold West?
The average price for a property for sale in Mold West is £187,922. This amount is 24% lower than the average price in Mold. There are 325 property listings for sale in Mold West.
What streets have the most expensive properties for sale in Mold West?
The streets with the most expensive properties for sale in Mold West are Gwernaffield Road at an average of £394,166, Hafod Alyn at an average of £308,000 and Meadowside at an average of £300,000.
What streets have the most affordable properties for sale in Mold West?
The streets with the most affordable properties for sale in Mold West are St Marys Mews at an average of £60,650, Llys Daniel Owen at an average of £133,908 and Blackfriars Court at an average of £134,666.
Which train stations are available in or near Mold West?
Some of the train stations available in or near Mold West are Buckley, Penyffordd and Hawarden.
Property Price Paid in Mold West by Year
The average sold property price by year was:
| Year | Average Sold Price | Price Change |
Sold Properties
|
|---|---|---|---|
| 2025 | £199,866 | 14% |
30 Properties |
| 2024 | £171,183 | -11% |
27 Properties |
| 2023 | £190,153 | 6% |
42 Properties |
| 2022 | £179,585 | 5% |
27 Properties |
| 2021 | £170,212 | 3% |
54 Properties |
| 2020 | £164,615 | 3% |
26 Properties |
| 2019 | £159,969 | 6% |
36 Properties |
| 2018 | £150,871 | 4% |
39 Properties |
| 2017 | £145,482 | 7% |
31 Properties |
| 2016 | £135,566 | 6% |
41 Properties |
| 2015 | £127,650 | -26% |
26 Properties |
| 2014 | £160,500 | -1% |
24 Properties |
| 2013 | £162,278 | - |
16 Properties |
| 2012 | £162,353 | 16% |
26 Properties |
| 2011 | £136,212 | -28% |
28 Properties |
| 2010 | £174,771 | 2% |
31 Properties |
| 2009 | £171,122 | 2% |
26 Properties |
| 2008 | £167,458 | -7% |
38 Properties |
| 2007 | £178,559 | 24% |
59 Properties |
| 2006 | £134,970 | 14% |
46 Properties |
| 2005 | £115,428 | 0,3% |
32 Properties |
| 2004 | £115,112 | 14% |
30 Properties |
| 2003 | £99,314 | 30% |
31 Properties |
| 2002 | £69,032 | 19% |
38 Properties |
| 2001 | £55,705 | -29% |
28 Properties |
| 2000 | £71,681 | 15% |
29 Properties |
| 1999 | £61,283 | 25% |
21 Properties |
| 1998 | £46,203 | 2% |
33 Properties |
| 1997 | £45,284 | -4% |
35 Properties |
| 1996 | £47,289 | 8% |
21 Properties |
| 1995 | £43,305 | - |
17 Properties |
Property Price per Property Type in Mold West
Here you can find historic sold price data in order to help with your property search.
The average Property Paid Price for specific property types in the last three years are:
| Property Type | Average Sold Price | Sold Properties |
|---|---|---|
| Semi Detached House | £180,026.00 | 37 Semi Detached Houses |
| Detached House | £291,619.00 | 21 Detached Houses |
| Terraced House | £153,444.00 | 29 Terraced Houses |
| Flat | £114,125.00 | 12 Flats |

