
Properties for sale in FY7
Fleetwood
- Info
- Price Paid By Year
- Property Type Price
- Transport
House Prices in FY7
Properties in FY7 have an average house price of £141,199.00 and had 1115 Property Transactions within the last 3 years.
The most expensive property was sold for £725,000.00.
Property Price Paid in FY7 by Year
The average sold property price by year was:
| Year | Average Sold Price | Sold Properties |
|---|---|---|
| 2026 | £147,960.00 | 25 Properties |
| 2025 | £145,471.00 | 378 Properties |
| 2024 | £138,497.00 | 404 Properties |
| 2023 | £138,950.00 | 308 Properties |
| 2022 | £139,342.00 | 451 Properties |
| 2021 | £134,813.00 | 562 Properties |
| 2020 | £121,673.00 | 390 Properties |
| 2019 | £128,322.00 | 384 Properties |
| 2018 | £118,560.00 | 416 Properties |
| 2017 | £120,678.00 | 404 Properties |
| 2016 | £119,697.00 | 379 Properties |
| 2015 | £112,159.00 | 403 Properties |
| 2014 | £114,316.00 | 404 Properties |
| 2013 | £107,618.00 | 290 Properties |
| 2012 | £109,995.00 | 245 Properties |
| 2011 | £108,172.00 | 287 Properties |
| 2010 | £102,942.00 | 196 Properties |
| 2009 | £106,507.00 | 206 Properties |
| 2008 | £112,291.00 | 278 Properties |
| 2007 | £121,457.00 | 544 Properties |
| 2006 | £117,994.00 | 575 Properties |
| 2005 | £110,422.00 | 503 Properties |
| 2004 | £96,522.00 | 571 Properties |
| 2003 | £75,516.00 | 626 Properties |
| 2002 | £58,139.00 | 693 Properties |
| 2001 | £51,331.00 | 651 Properties |
| 2000 | £49,650.00 | 548 Properties |
| 1999 | £46,582.00 | 551 Properties |
| 1998 | £45,331.00 | 484 Properties |
| 1997 | £45,890.00 | 480 Properties |
| 1996 | £43,148.00 | 449 Properties |
| 1995 | £42,587.00 | 345 Properties |
Property Price per Property Type in FY7
Here you can find historic sold price data in order to help with your property search.
The average Property Paid Price for specific property types in the last three years are:
| Property Type | Average Sold Price | Sold Properties |
|---|---|---|
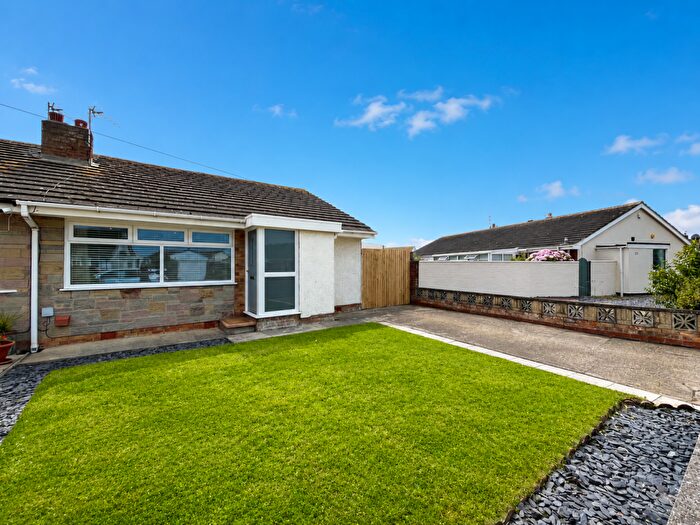
| Semi Detached House | £160,357.00 | 314 Semi Detached Houses |
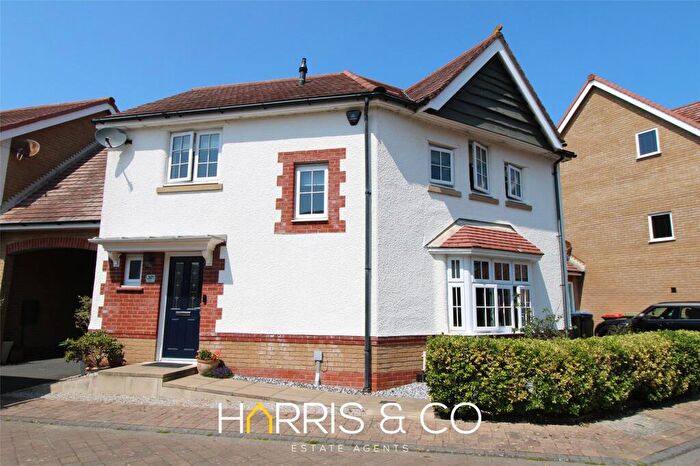
| Detached House | £252,709.00 | 150 Detached Houses |
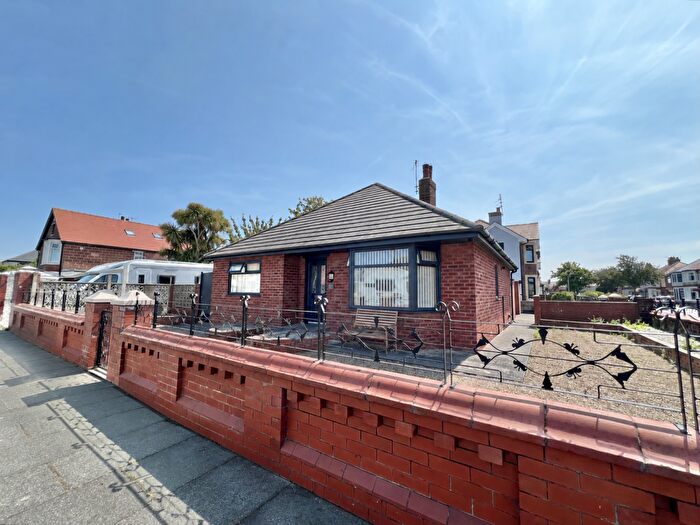
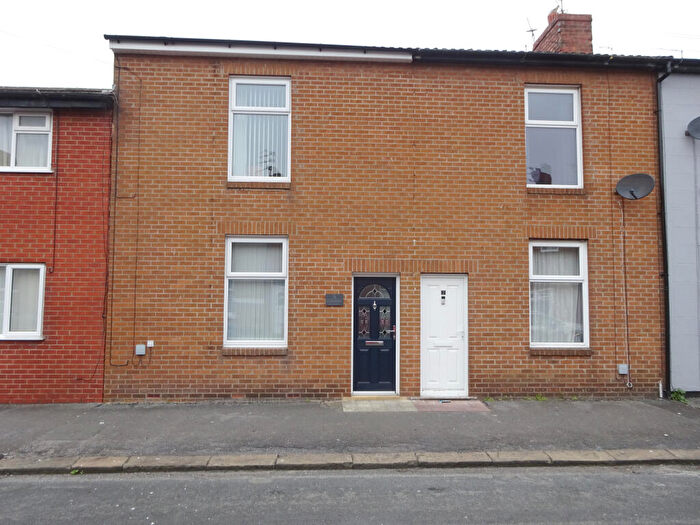
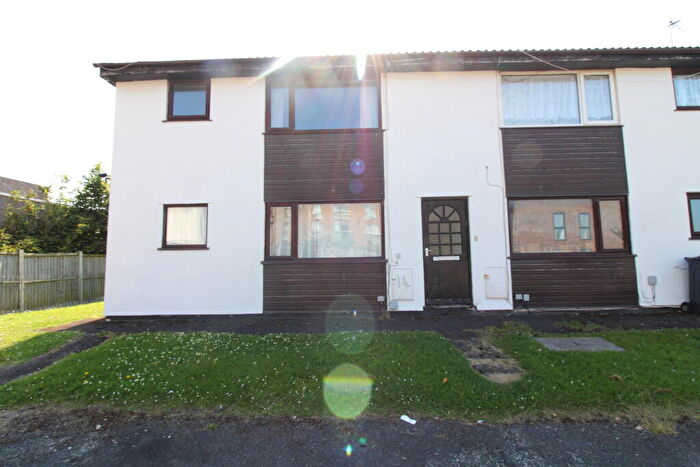
| Terraced House | £109,827.00 | 578 Terraced Houses |
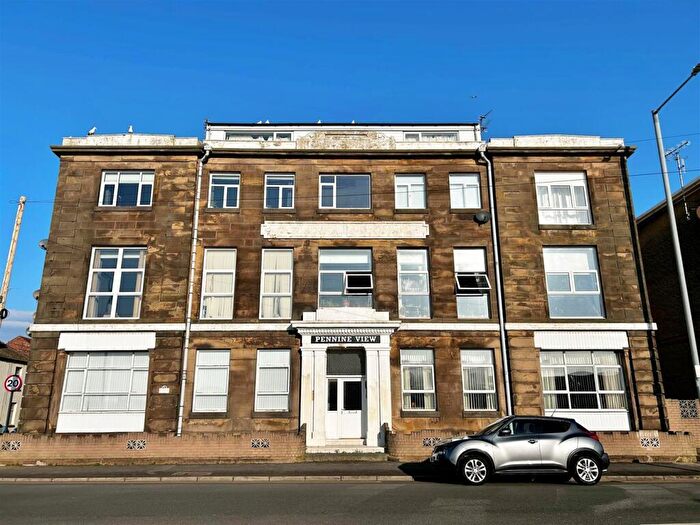
| Flat | £78,054.00 | 73 Flats |

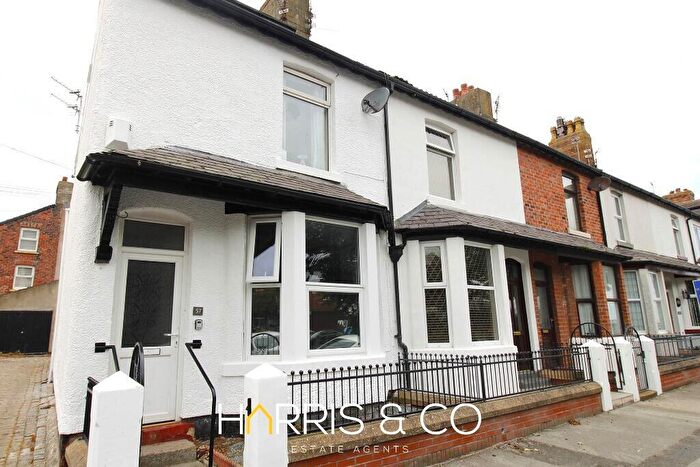
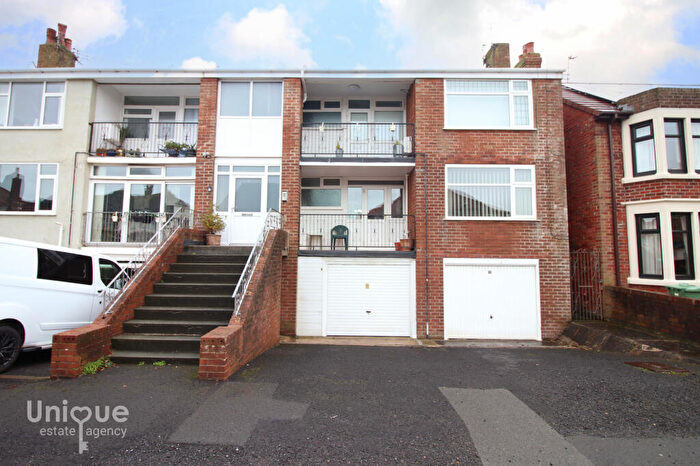
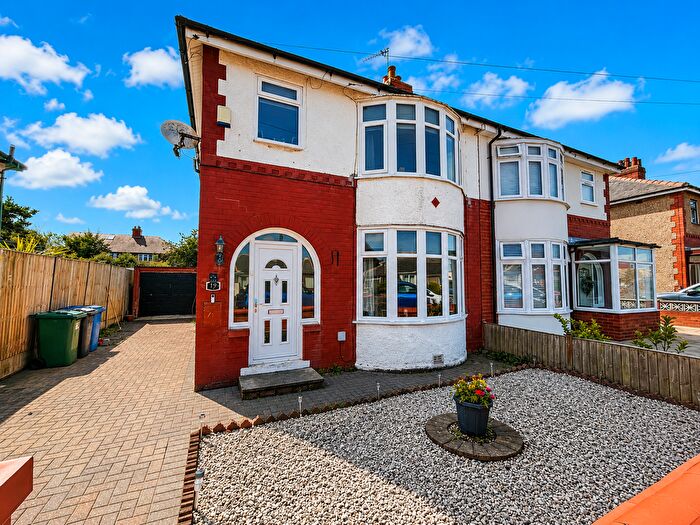
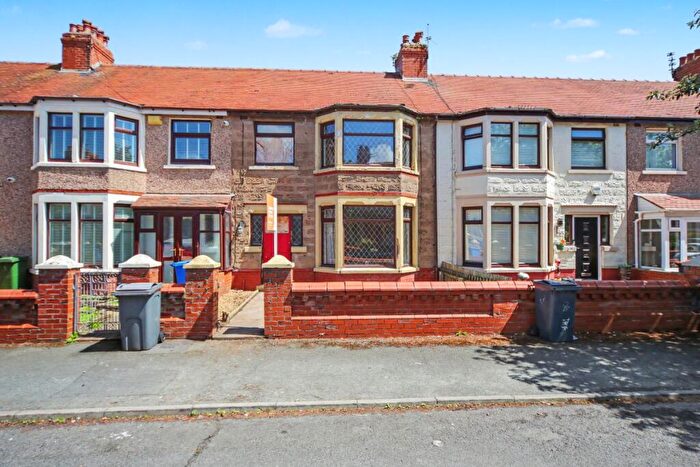
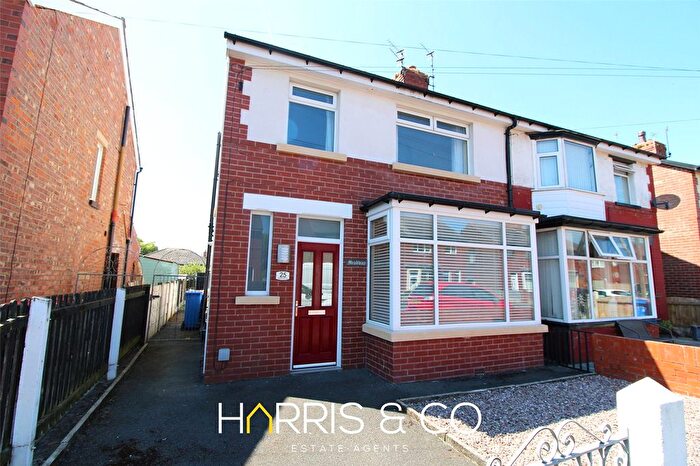
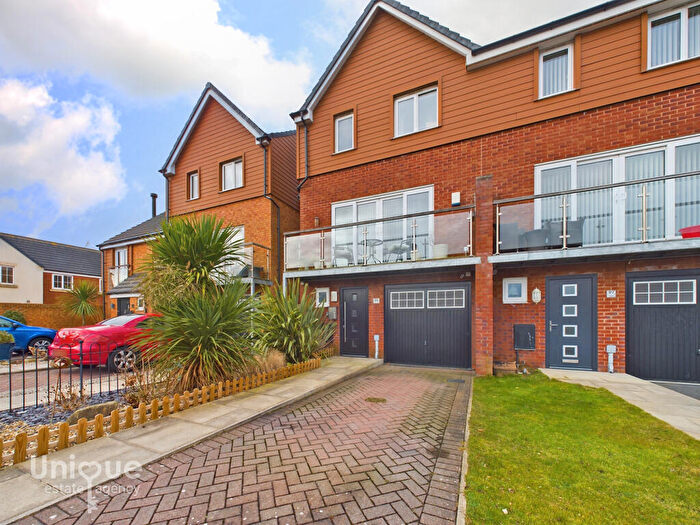
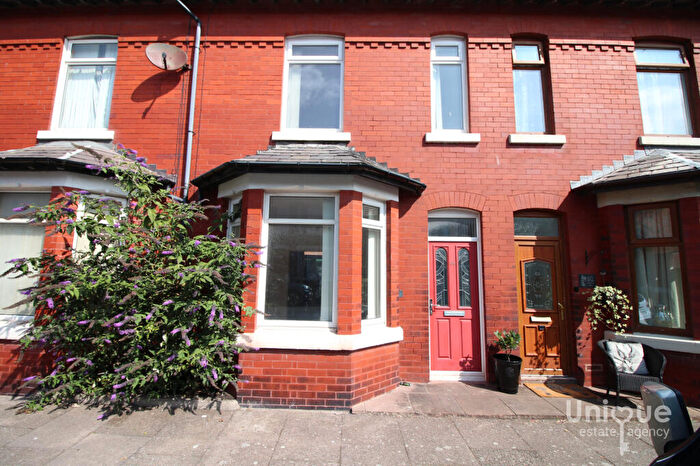
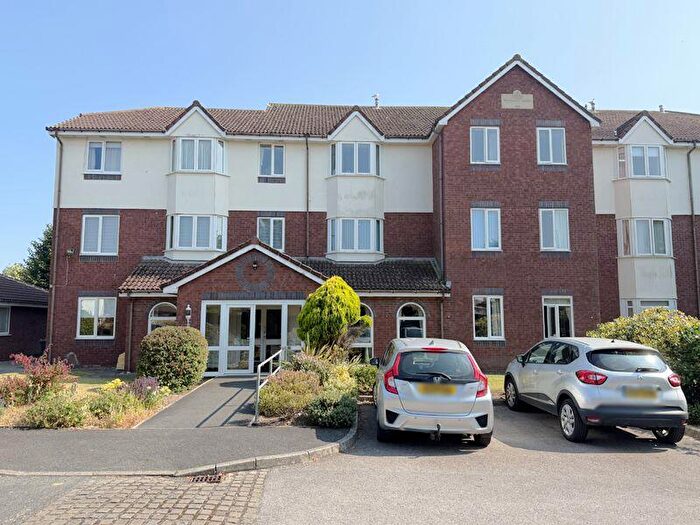
Houses and Flats for sale in FY7, Fleetwood
There are 148 results. Property prices in FY7 range from £20k to £675k with an average price of £178k.

![]()
If you are looking to sell your house, let it out, or receive a property valuation, an expert can help you.
Click the button below to get started.

Frequently Asked Questions about FY7
What is the average price for a property for sale in FY7?
The average price for a property for sale in FY7 is £141,199. There are 148 property listings for sale in FY7.
Which areas are included in the FY7 postcode district?
The main area within FY7 is Fleetwood.
What are the most common property types in FY7?
The most common property types in FY7 are Terraced Houses, Semi Detached Houses, Detached Houses and Flats.
What has been the average sold property price in FY7 over the last three years?
Terraced Houses in FY7 have an average sold price of £109,827, while Semi Detached Houses have an average of £160,357. Detached Houses have an average of £252,709 and Flats have an average of £78,054. The average sold property price in FY7 over the last three years is approximately £143,976.