
Properties for sale in FY5
Thornton-Cleveleys
- Info
- Price Paid By Year
- Property Type Price
- Transport
House Prices in FY5
Properties in FY5 have an average house price of £179,836.00 and had 2745 Property Transactions within the last 3 years.
The most expensive property was sold for £850,000.00.
Property Price Paid in FY5 by Year
The average sold property price by year was:
| Year | Average Sold Price | Sold Properties |
|---|---|---|
| 2026 | £181,400.00 | 71 Properties |
| 2025 | £187,397.00 | 887 Properties |
| 2024 | £171,678.00 | 939 Properties |
| 2023 | £180,829.00 | 848 Properties |
| 2022 | £178,718.00 | 1,035 Properties |
| 2021 | £165,042.00 | 1,268 Properties |
| 2020 | £160,753.00 | 915 Properties |
| 2019 | £148,811.00 | 950 Properties |
| 2018 | £147,268.00 | 1,007 Properties |
| 2017 | £144,019.00 | 1,053 Properties |
| 2016 | £141,029.00 | 1,055 Properties |
| 2015 | £131,628.00 | 923 Properties |
| 2014 | £132,400.00 | 899 Properties |
| 2013 | £131,653.00 | 817 Properties |
| 2012 | £130,015.00 | 687 Properties |
| 2011 | £133,632.00 | 612 Properties |
| 2010 | £137,012.00 | 577 Properties |
| 2009 | £138,971.00 | 517 Properties |
| 2008 | £148,020.00 | 578 Properties |
| 2007 | £156,083.00 | 1,215 Properties |
| 2006 | £143,266.00 | 1,304 Properties |
| 2005 | £139,273.00 | 905 Properties |
| 2004 | £128,284.00 | 1,308 Properties |
| 2003 | £104,779.00 | 1,441 Properties |
| 2002 | £85,492.00 | 1,615 Properties |
| 2001 | £71,422.00 | 1,621 Properties |
| 2000 | £65,841.00 | 1,282 Properties |
| 1999 | £64,195.00 | 1,240 Properties |
| 1998 | £58,942.00 | 1,188 Properties |
| 1997 | £56,400.00 | 1,228 Properties |
| 1996 | £52,585.00 | 1,118 Properties |
| 1995 | £53,800.00 | 888 Properties |
Property Price per Property Type in FY5
Here you can find historic sold price data in order to help with your property search.
The average Property Paid Price for specific property types in the last three years are:
| Property Type | Average Sold Price | Sold Properties |
|---|---|---|
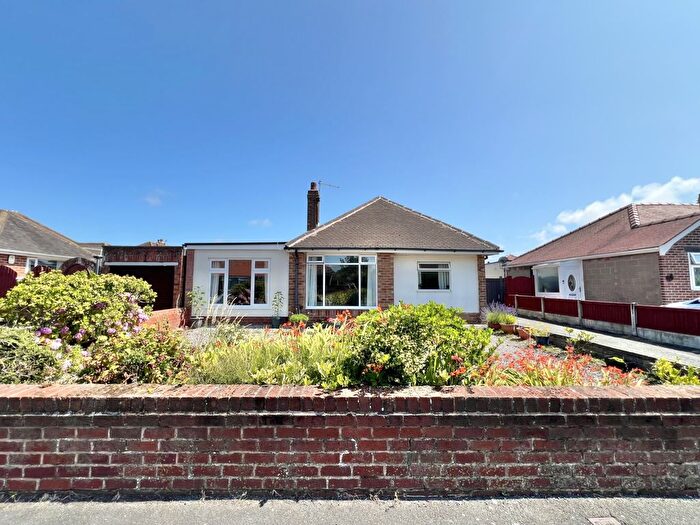
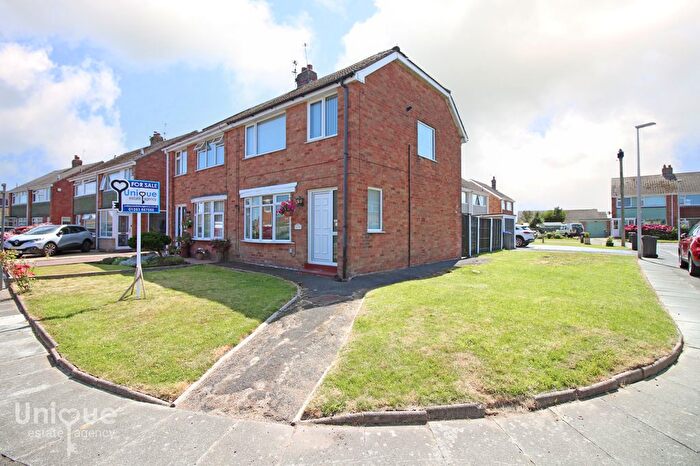
| Semi Detached House | £169,404.00 | 1,644 Semi Detached Houses |
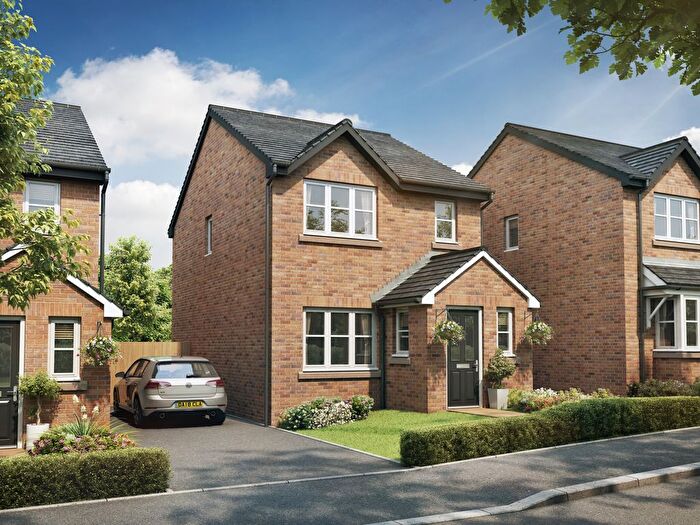
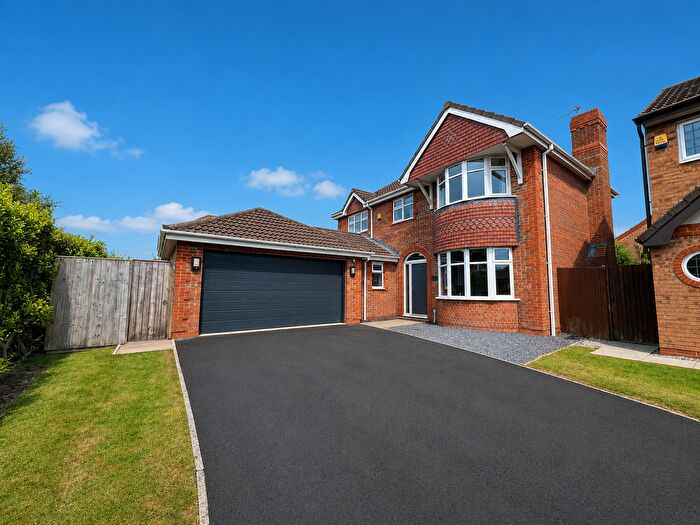
| Detached House | £280,560.00 | 499 Detached Houses |
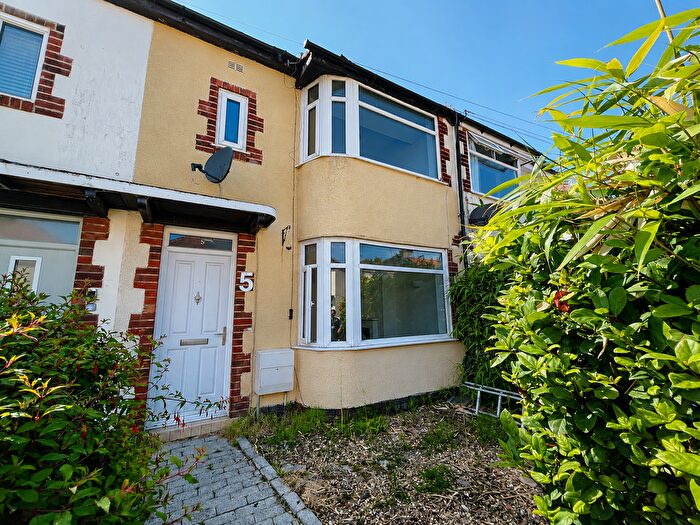
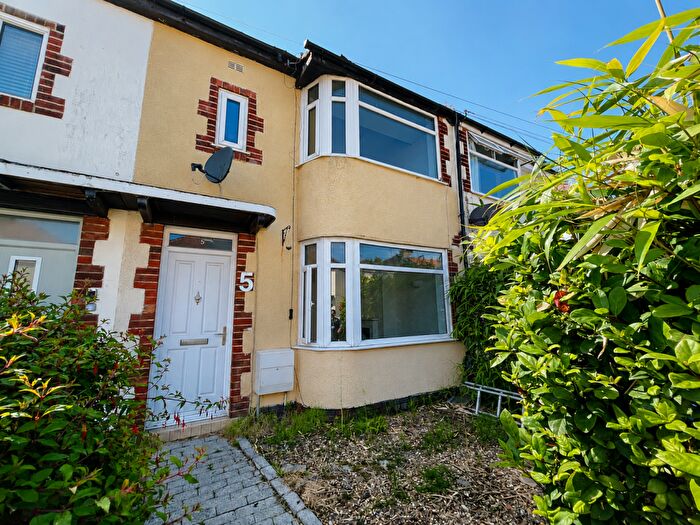
| Terraced House | £140,992.00 | 386 Terraced Houses |
| Flat | £95,957.00 | 216 Flats |
Transport near FY5

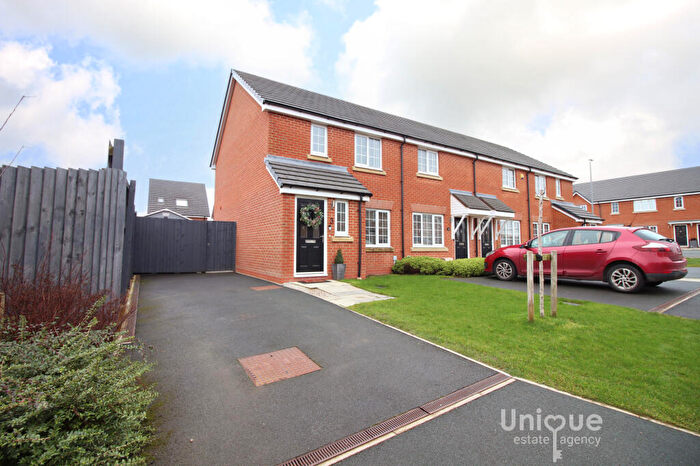
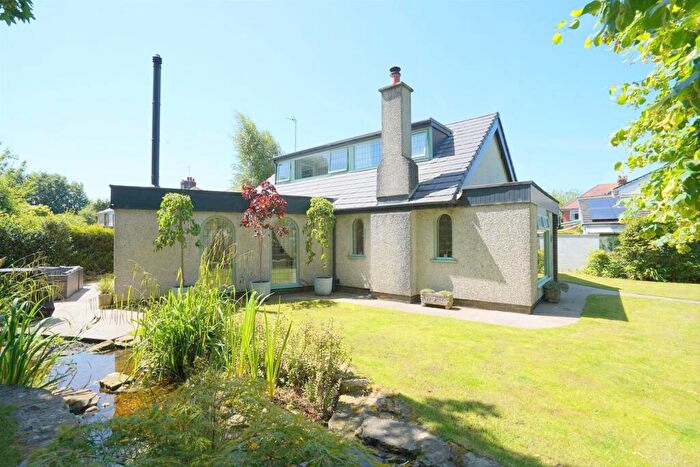
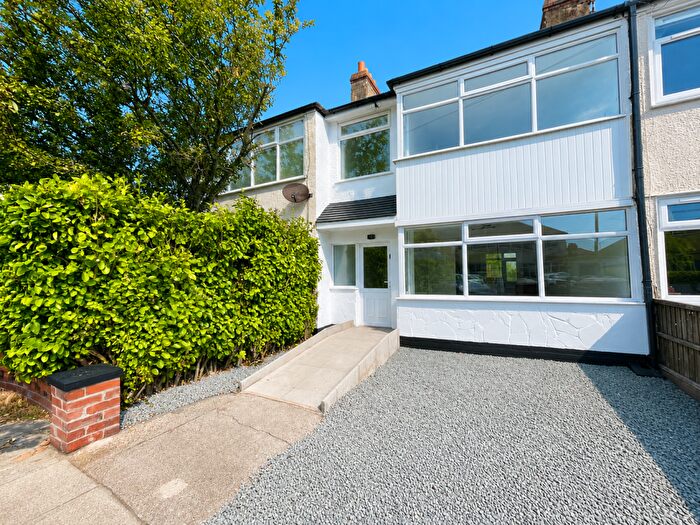
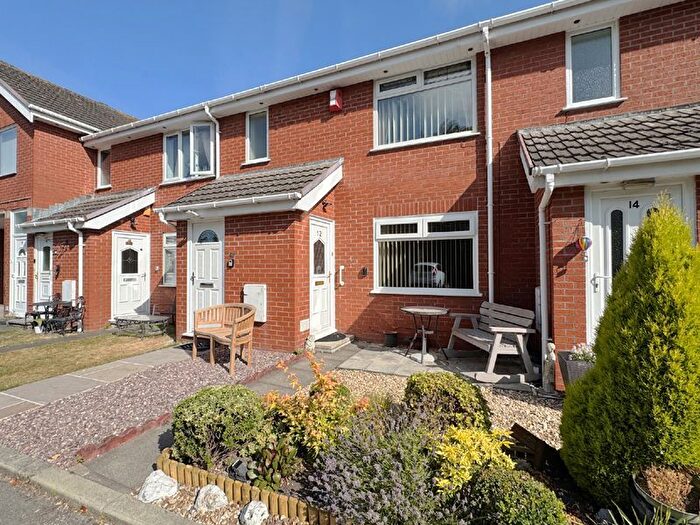
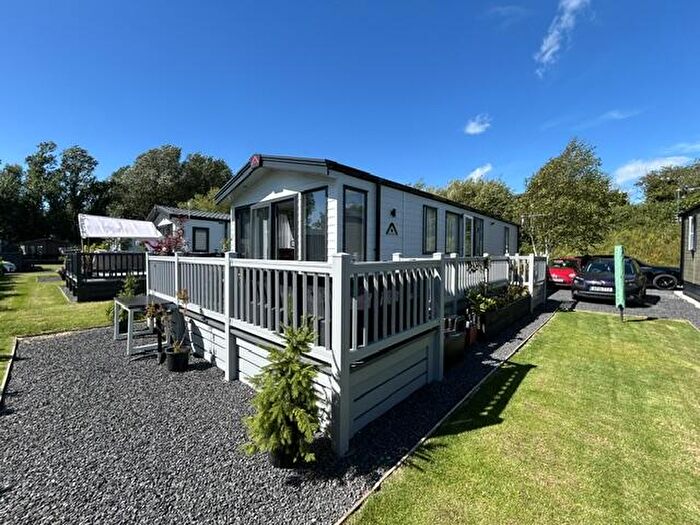
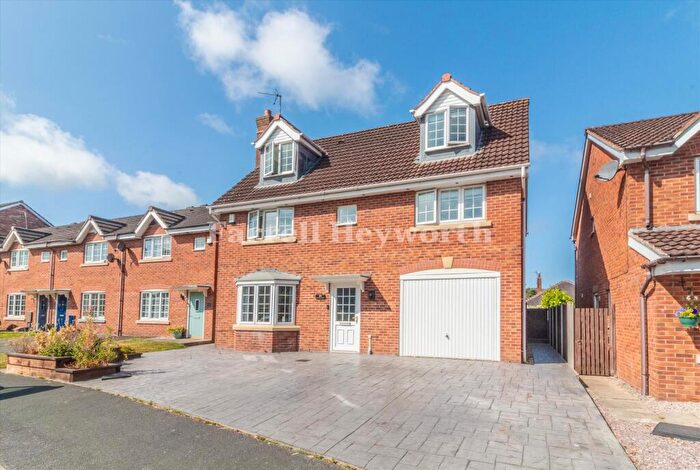
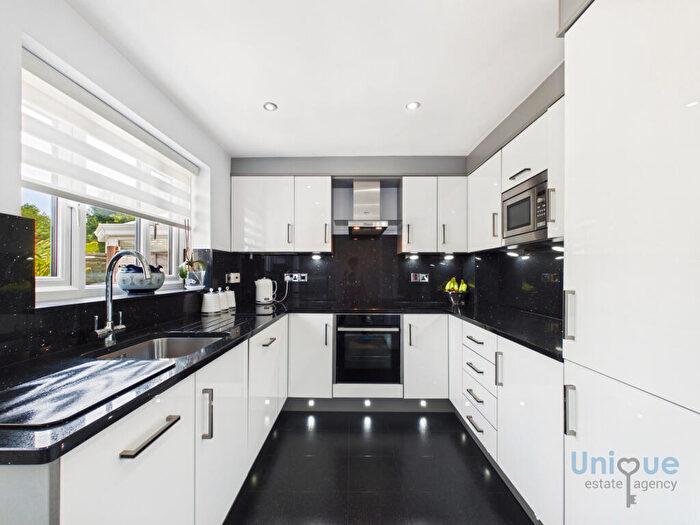
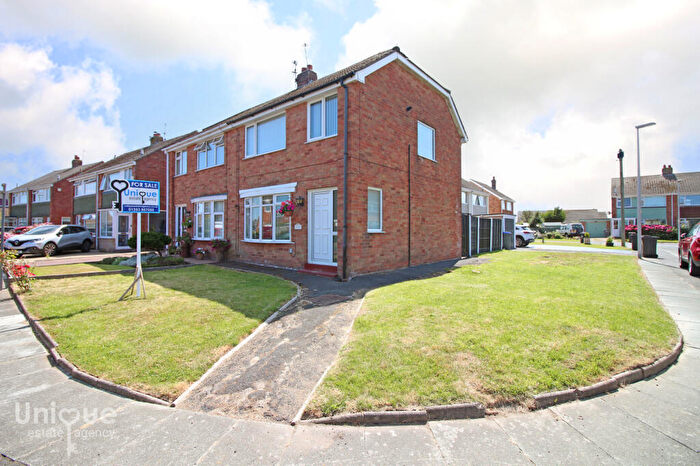
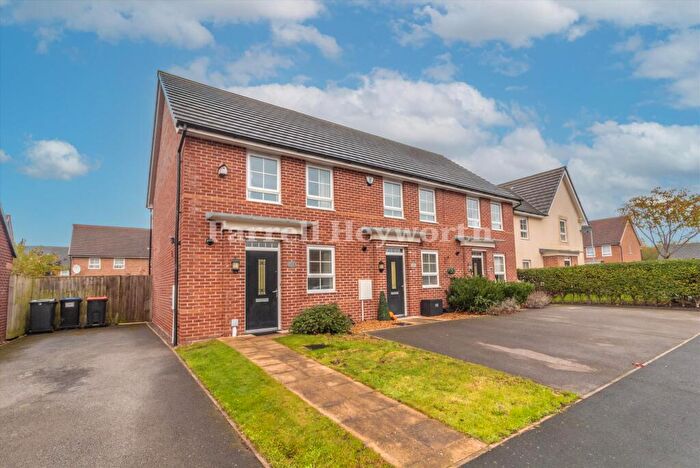
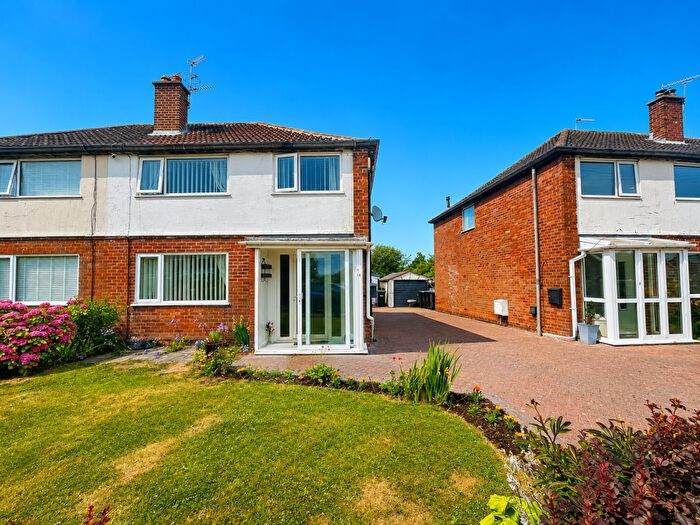
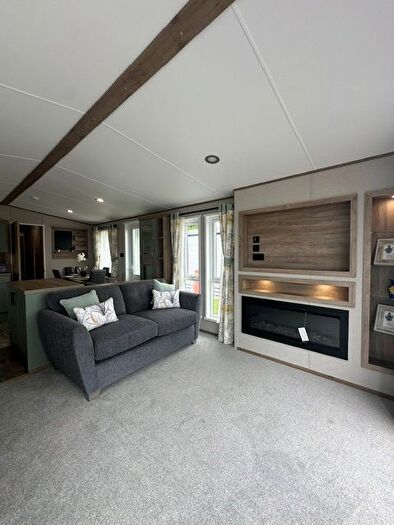
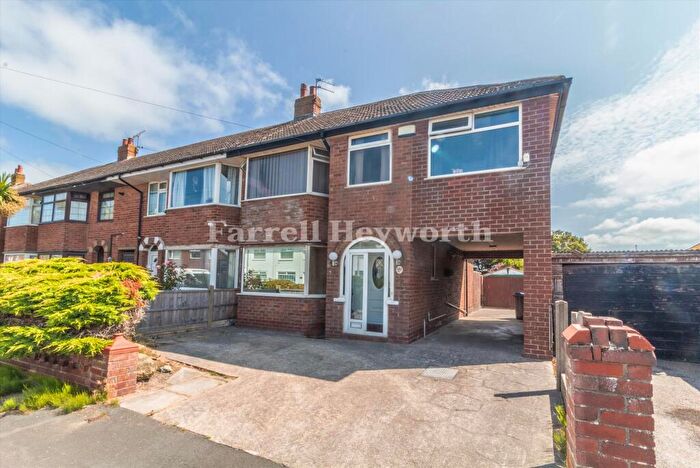
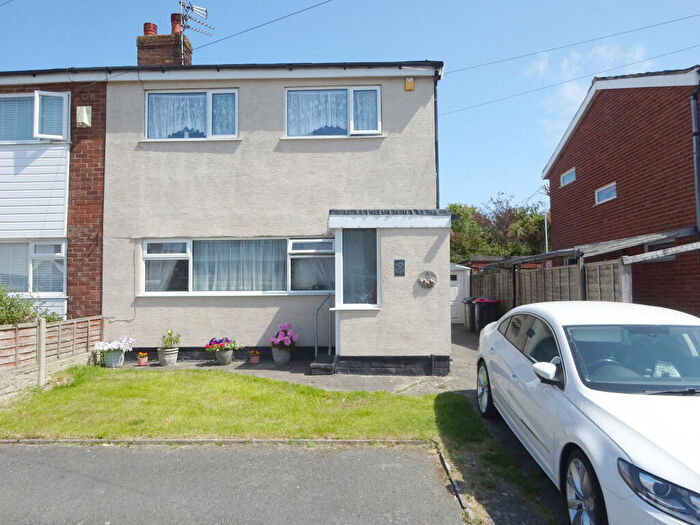
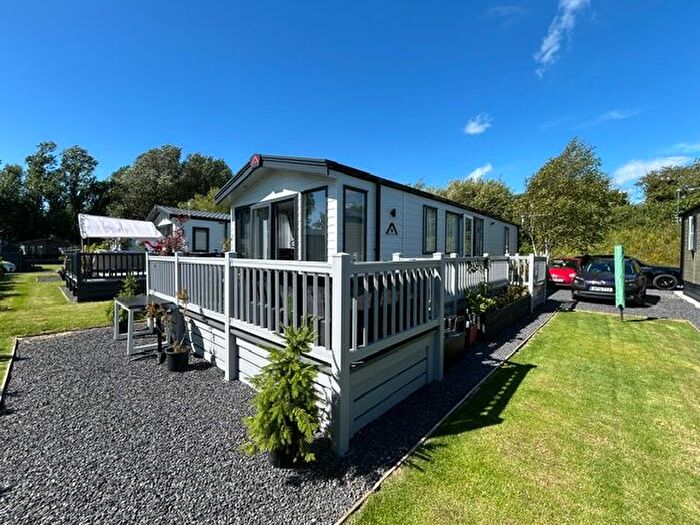
Houses and Flats for sale in FY5, Thornton-Cleveleys
There are 406 results. Property prices in FY5 range from £25k to £925k with an average price of £227k.

![]()
If you are looking to sell your house, let it out, or receive a property valuation, an expert can help you.
Click the button below to get started.

Frequently Asked Questions about FY5
What is the average price for a property for sale in FY5?
The average price for a property for sale in FY5 is £179,836. There are 406 property listings for sale in FY5.
Which areas are included in the FY5 postcode district?
The main area within FY5 is Thornton-Cleveleys.
What are the most common property types in FY5?
The most common property types in FY5 are Semi Detached Houses, Detached Houses, Terraced Houses and Flats.
What has been the average sold property price in FY5 over the last three years?
Semi Detached Houses in FY5 have an average sold price of £169,404, while Detached Houses have an average of £280,560. Terraced Houses have an average of £140,992 and Flats have an average of £95,957. The average sold property price in FY5 over the last three years is approximately £180,158.