
Properties for sale in OX
Oxford
- Info
- Price Paid By Year
- Property Type Price
House Prices in OX
Properties in OX have an average house price of £459,194 and had 23120 Property Transactions within the last 3 years.
The most expensive property was sold for £31,500,000.
Property Price Paid in OX by Year
The average sold property price by year was:
| Year | Average Sold Price | Sold Properties |
|---|---|---|
| 2025 | £453,817.00 | 7,025 Properties |
| 2024 | £458,515.00 | 8,499 Properties |
| 2023 | £464,928.00 | 7,596 Properties |
| 2022 | £463,008.00 | 9,586 Properties |
| 2021 | £442,647.00 | 12,991 Properties |
| 2020 | £427,169.00 | 9,252 Properties |
| 2019 | £392,753.00 | 10,275 Properties |
| 2018 | £399,408.00 | 10,516 Properties |
| 2017 | £390,046.00 | 10,485 Properties |
| 2016 | £376,377.00 | 11,016 Properties |
| 2015 | £357,776.00 | 11,032 Properties |
| 2014 | £334,075.00 | 11,195 Properties |
| 2013 | £308,331.00 | 9,638 Properties |
| 2012 | £305,446.00 | 7,900 Properties |
| 2011 | £297,000.00 | 7,728 Properties |
| 2010 | £298,485.00 | 8,116 Properties |
| 2009 | £262,930.00 | 7,696 Properties |
| 2008 | £282,321.00 | 6,707 Properties |
| 2007 | £277,222.00 | 12,598 Properties |
| 2006 | £258,042.00 | 14,254 Properties |
| 2005 | £237,313.00 | 11,479 Properties |
| 2004 | £233,729.00 | 12,842 Properties |
| 2003 | £218,315.00 | 12,297 Properties |
| 2002 | £194,255.00 | 13,924 Properties |
| 2001 | £165,088.00 | 14,210 Properties |
| 2000 | £150,473.00 | 12,064 Properties |
| 1999 | £124,098.00 | 14,413 Properties |
| 1998 | £110,523.00 | 12,690 Properties |
| 1997 | £96,897.00 | 13,307 Properties |
| 1996 | £88,192.00 | 12,014 Properties |
| 1995 | £85,626.00 | 9,812 Properties |
Property Price per Property Type in OX
Here you can find historic sold price data in order to help with your property search.
The average Property Paid Price for specific property types in the last three years are:
| Property Type | Average Sold Price | Sold Properties |
|---|---|---|
| Semi Detached House | £435,513.00 | 7,175 Semi Detached Houses |
| Terraced House | £383,207.00 | 6,074 Terraced Houses |
| Detached House | £673,013.00 | 6,333 Detached Houses |
| Flat | £254,941.00 | 3,538 Flats |
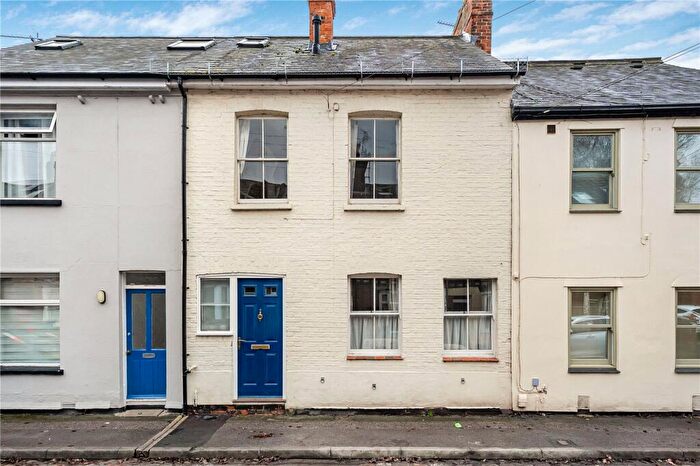
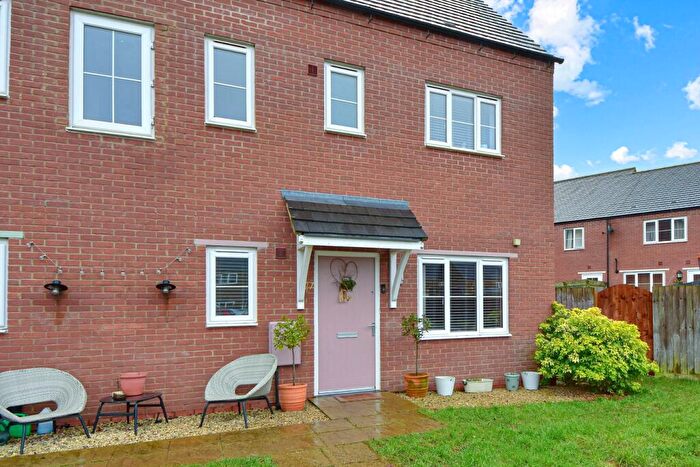
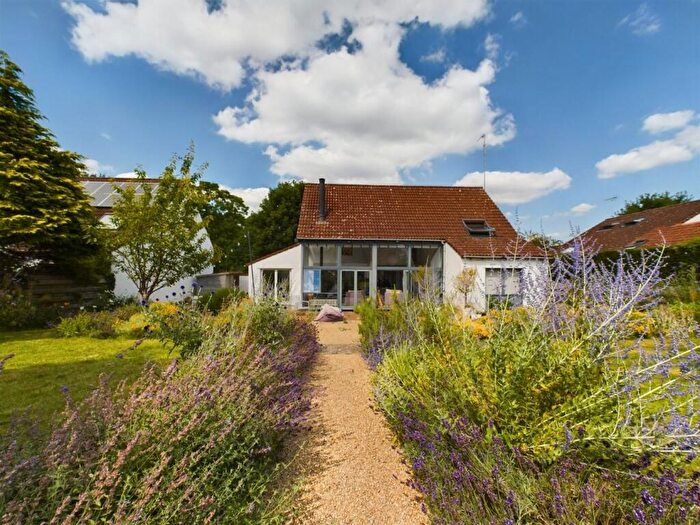
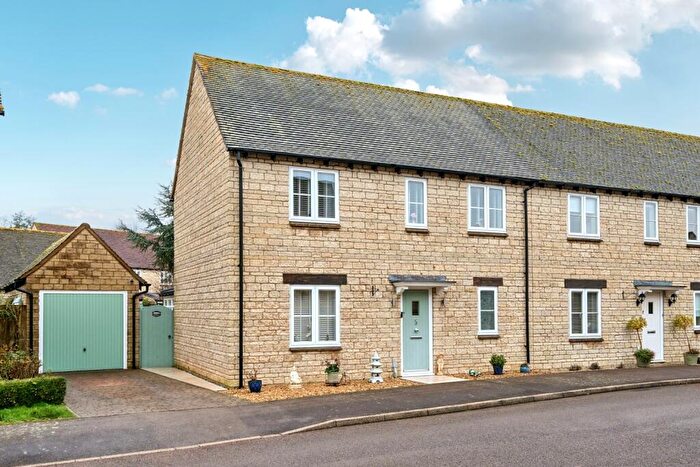
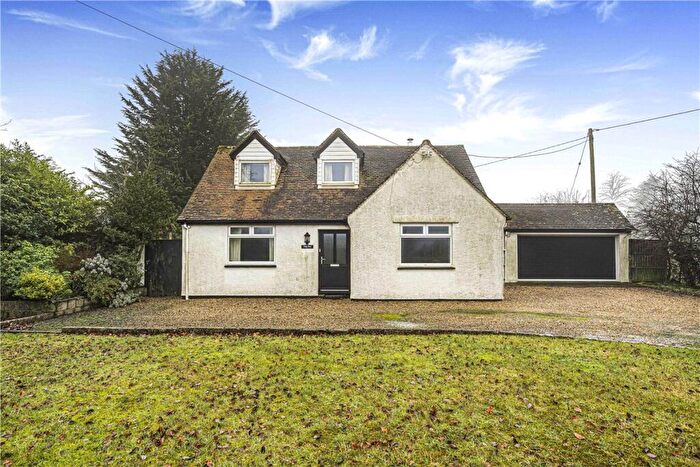
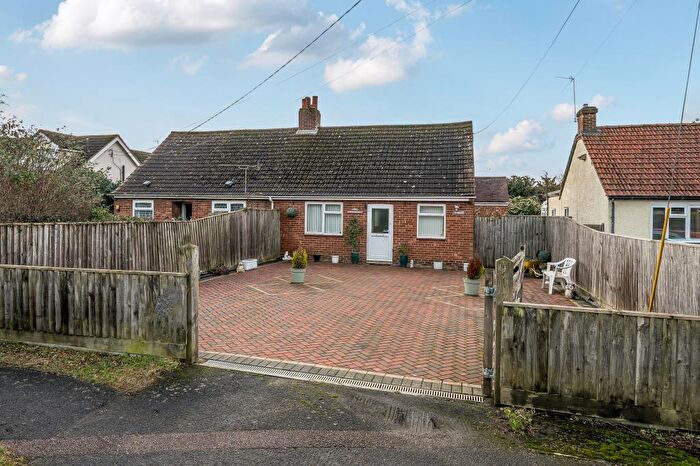
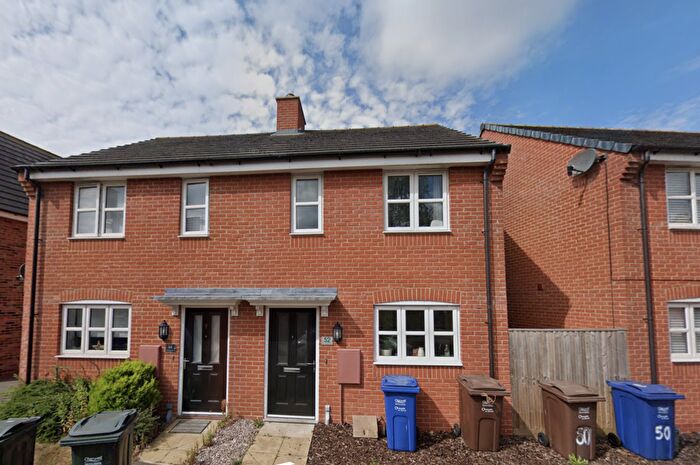
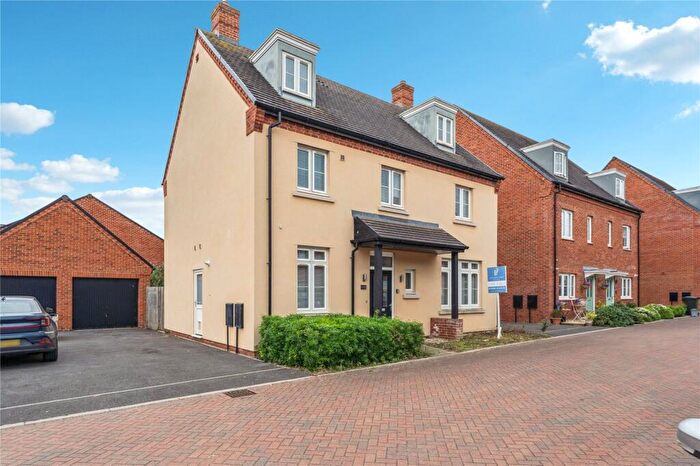
Houses and Flats for sale in OX, Oxford
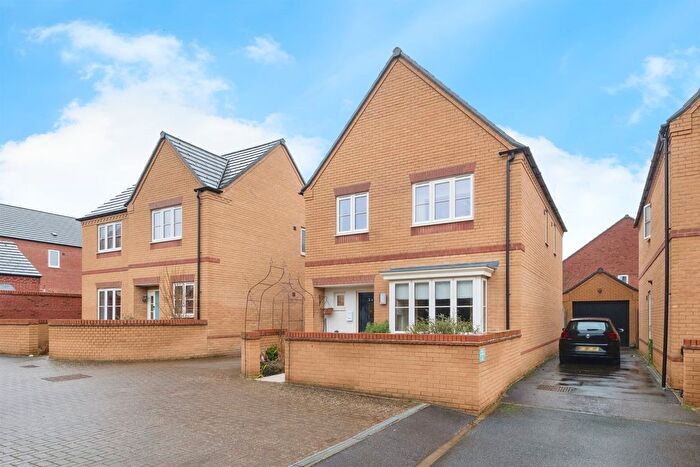
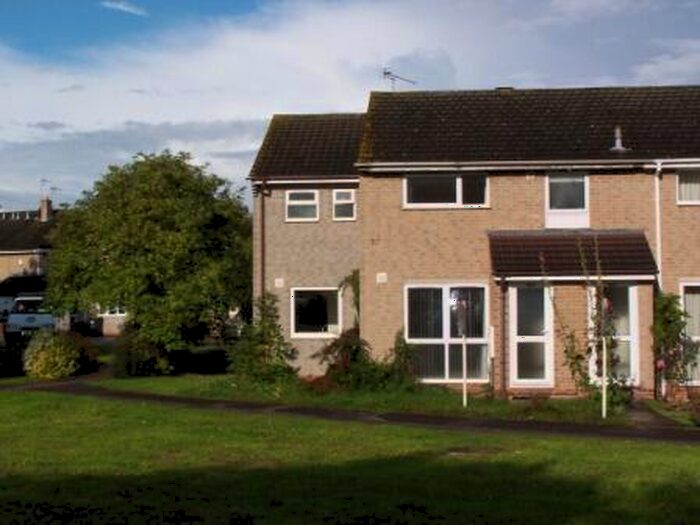
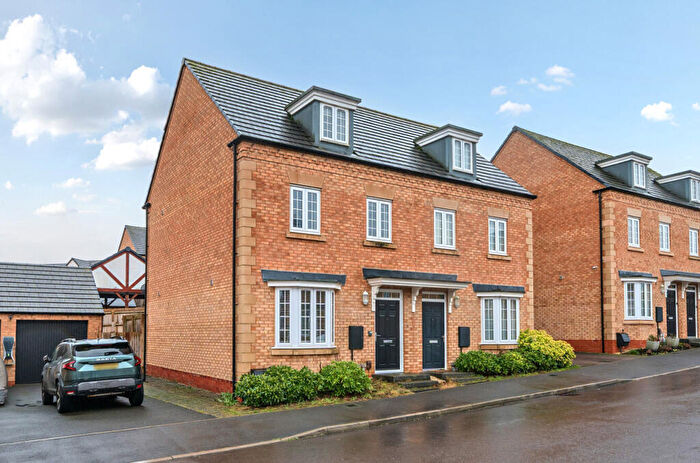
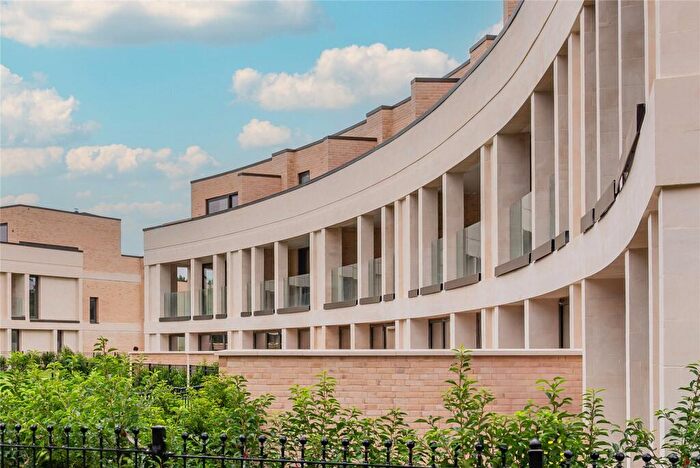
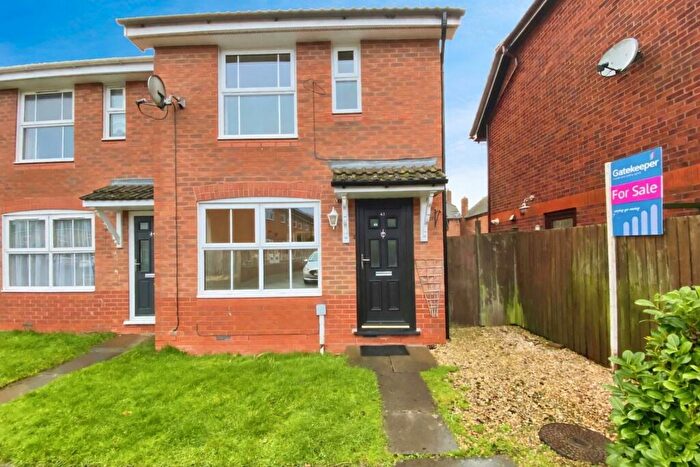
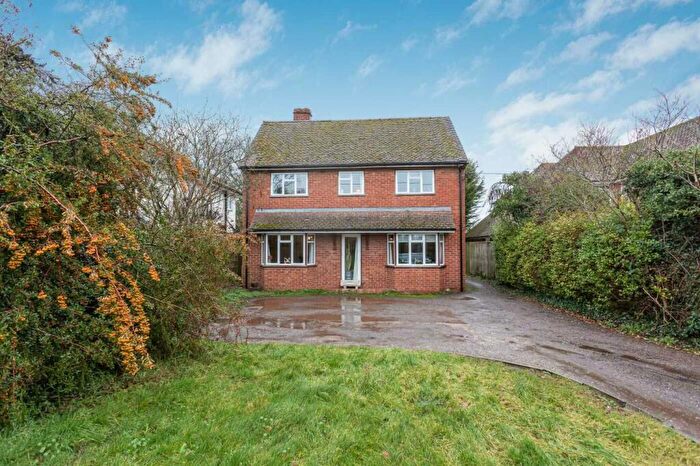
![]()
If you are looking to sell your house, let it out, or receive a property valuation, an expert can help you.
Click the button below to get started.
Postcode districts in OX, Oxford
Navigate through our locations to find the location of your next house in OX, Oxford, England for sale or to rent.
Transport in OX, Oxford
Please see below transportation links in this area:

Frequently asked questions about OX
What is the average price for a property for sale in OX?
The average price for a property for sale in OX is £459,194. This amount is 28% higher than the average price in England. There are 4,239 property listings for sale in OX.
What locations have the most expensive properties for sale in OX?
The locations with the most expensive properties for sale in OX are OX2 at an average of £793,983, OX49 at an average of £632,973 and OX20 at an average of £591,473.
What locations have the most affordable properties for sale in OX?
The locations with the most affordable properties for sale in OX are OX16 at an average of £282,034, OX28 at an average of £352,456 and OX26 at an average of £355,609.
Which train stations are available in or near OX?
Some of the train stations available in or near OX are Oxford Parkway, Oxford and Islip.