
Properties for sale in SS
Southend-on-Sea
- Info
- Price Paid By Year
- Property Type Price
House Prices in SS
Properties in SS have an average house price of £371,360 and had 21237 Property Transactions within the last 3 years.
The most expensive property was sold for £10,200,000.
Property Price Paid in SS by Year
The average sold property price by year was:
| Year | Average Sold Price | Sold Properties |
|---|---|---|
| 2026 | £370,675.00 | 156 Properties |
| 2025 | £375,906.00 | 6,891 Properties |
| 2024 | £369,181.00 | 7,638 Properties |
| 2023 | £369,136.00 | 6,552 Properties |
| 2022 | £377,940.00 | 8,723 Properties |
| 2021 | £359,165.00 | 11,568 Properties |
| 2020 | £334,194.00 | 7,748 Properties |
| 2019 | £320,555.00 | 8,652 Properties |
| 2018 | £318,930.00 | 9,309 Properties |
| 2017 | £308,833.00 | 9,703 Properties |
| 2016 | £281,972.00 | 10,034 Properties |
| 2015 | £250,820.00 | 10,319 Properties |
| 2014 | £230,727.00 | 9,985 Properties |
| 2013 | £213,658.00 | 7,979 Properties |
| 2012 | £208,996.00 | 6,684 Properties |
| 2011 | £206,095.00 | 6,493 Properties |
| 2010 | £209,996.00 | 6,340 Properties |
| 2009 | £194,161.00 | 6,057 Properties |
| 2008 | £203,804.00 | 6,192 Properties |
| 2007 | £207,535.00 | 12,791 Properties |
| 2006 | £191,297.00 | 12,801 Properties |
| 2005 | £181,358.00 | 10,303 Properties |
| 2004 | £173,319.00 | 12,225 Properties |
| 2003 | £156,802.00 | 11,955 Properties |
| 2002 | £130,404.00 | 13,398 Properties |
| 2001 | £107,365.00 | 12,889 Properties |
| 2000 | £92,708.00 | 11,797 Properties |
| 1999 | £81,569.00 | 13,257 Properties |
| 1998 | £74,654.00 | 11,398 Properties |
| 1997 | £68,417.00 | 11,903 Properties |
| 1996 | £61,364.00 | 10,752 Properties |
| 1995 | £59,367.00 | 8,924 Properties |
Property Price per Property Type in SS
Here you can find historic sold price data in order to help with your property search.
The average Property Paid Price for specific property types in the last three years are:
| Property Type | Average Sold Price | Sold Properties |
|---|---|---|
| Semi Detached House | £393,769.00 | 7,187 Semi Detached Houses |
| Terraced House | £327,872.00 | 5,029 Terraced Houses |
| Detached House | £537,425.00 | 4,625 Detached Houses |
| Flat | £209,761.00 | 4,396 Flats |
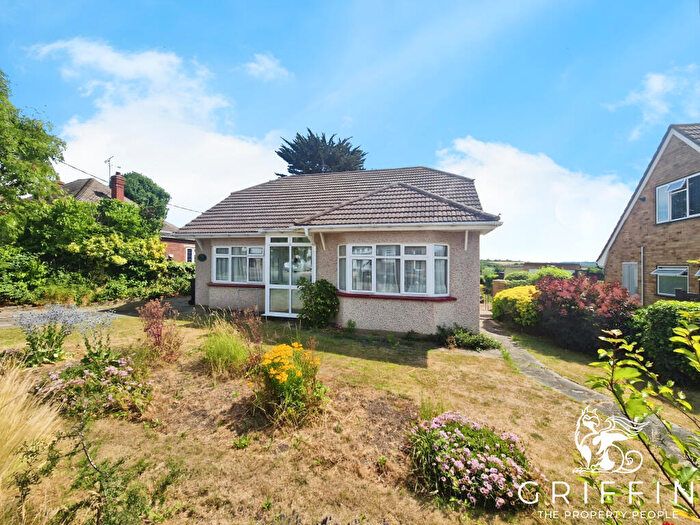
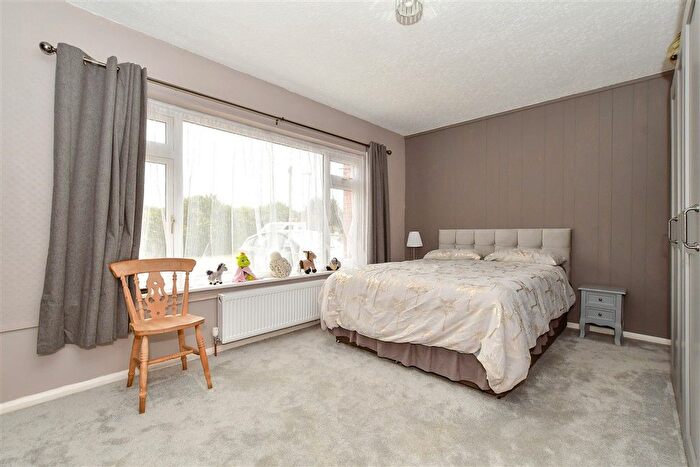
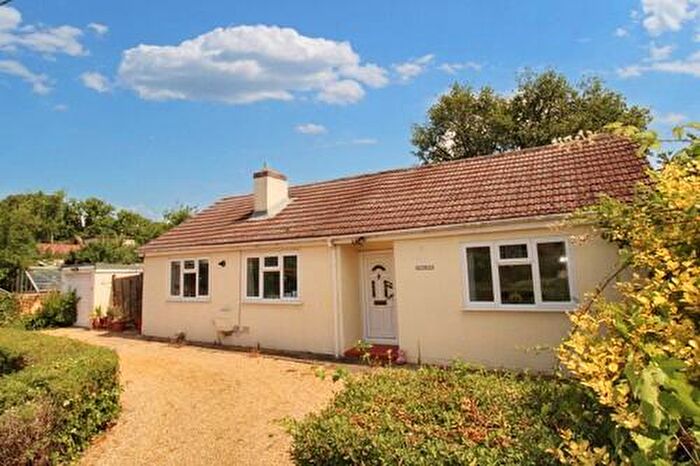
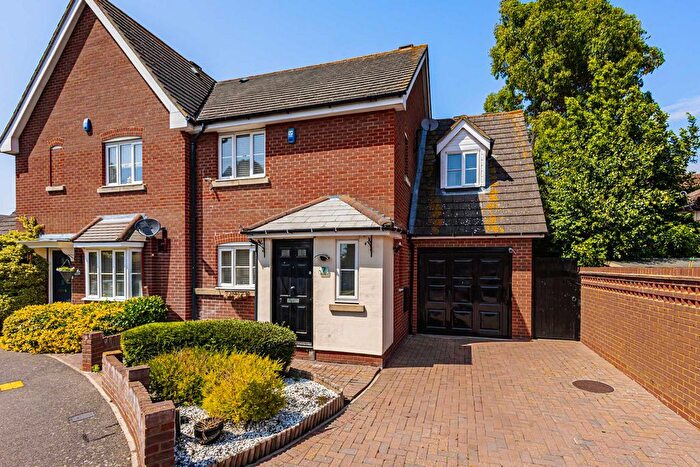
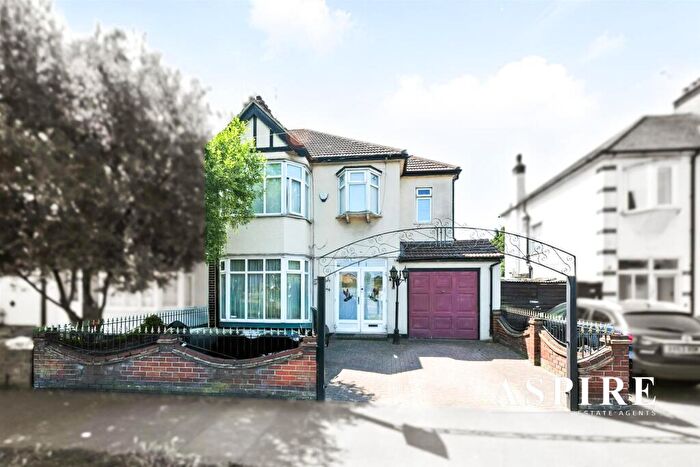
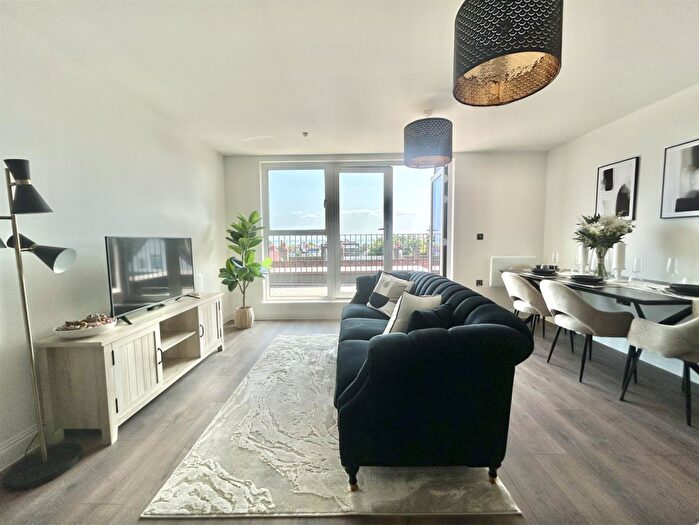
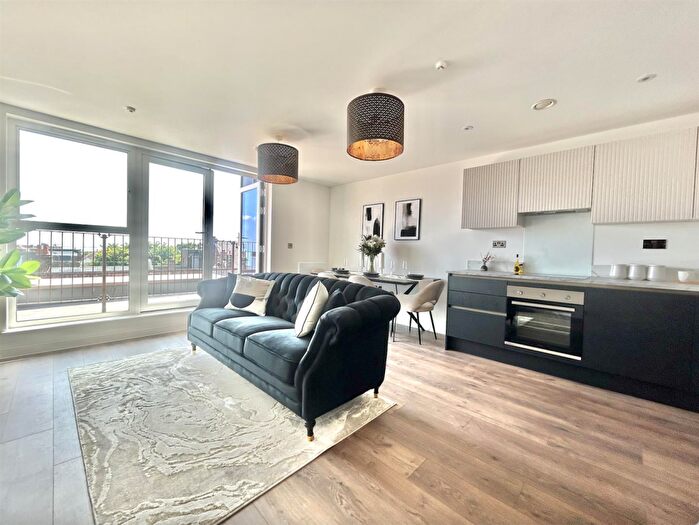
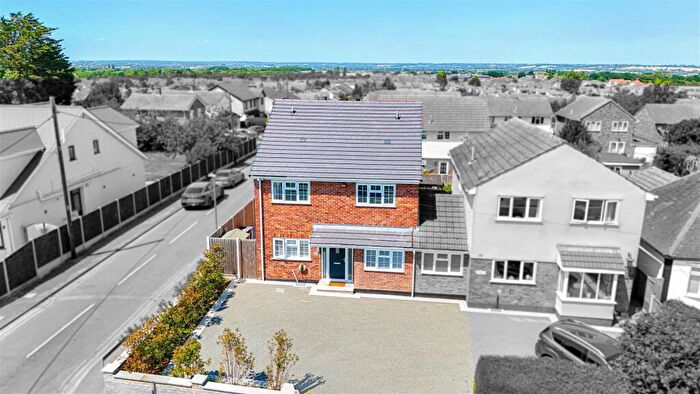
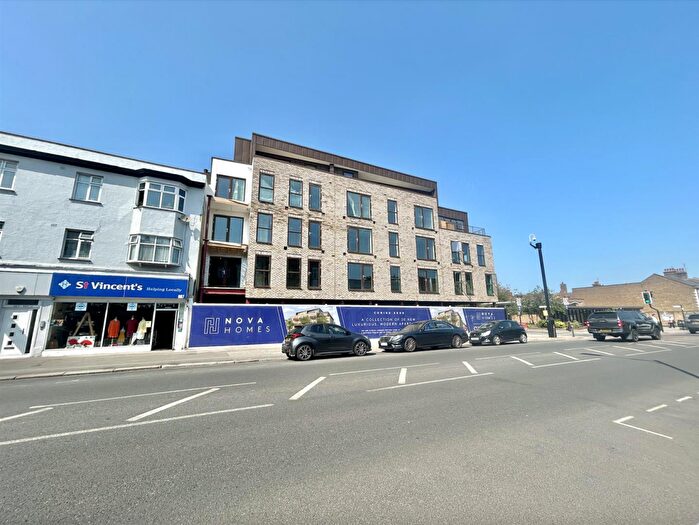
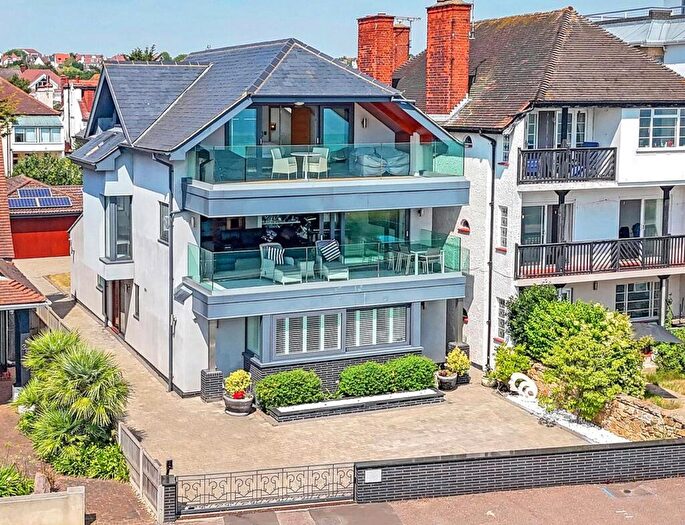
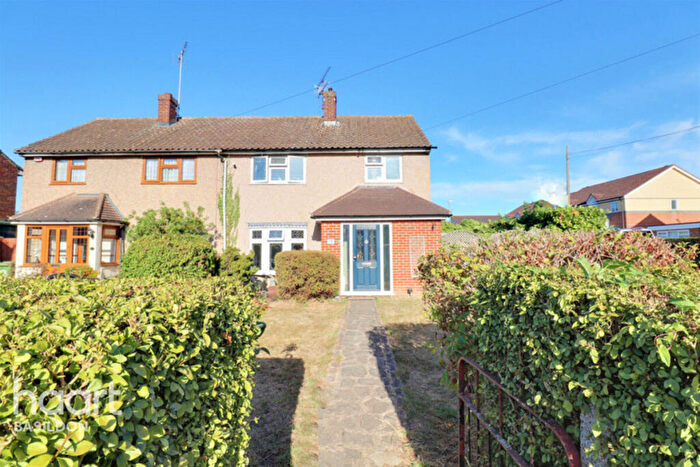
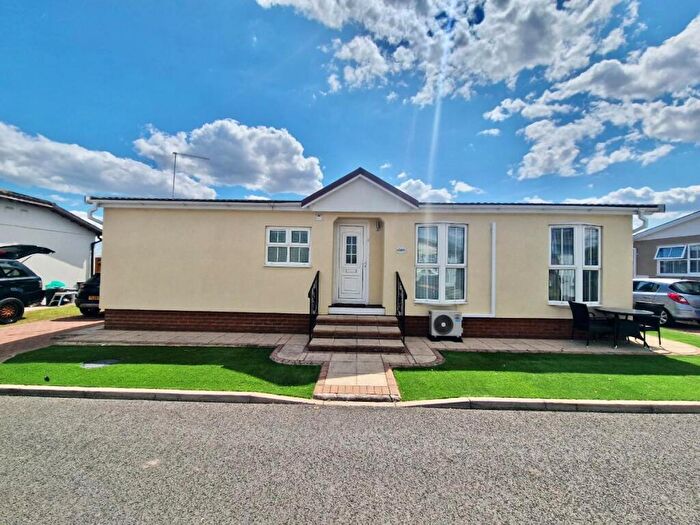
Houses and Flats for sale in SS, Southend-on-Sea

![]()
If you are looking to sell your house, let it out, or receive a property valuation, an expert can help you.
Click the button below to get started.

Postcode districts in SS, Southend-on-Sea
Navigate through our locations to find the location of your next house in SS, Southend-on-Sea, England for sale or to rent.
Transport in SS, Southend-on-Sea
Please see below transportation links in this area:

Frequently asked questions about SS
What is the average price for a property for sale in SS?
The average price for a property for sale in SS is £371,360. This amount is 3% higher than the average price in England. There are 4,336 property listings for sale in SS.
What locations have the most expensive properties for sale in SS?
The locations with the most expensive properties for sale in SS are SS5 at an average of £449,029, SS9 at an average of £438,824 and SS6 at an average of £427,391.
What locations have the most affordable properties for sale in SS?
The locations with the most affordable properties for sale in SS are SS2 at an average of £299,642, SS13 at an average of £300,733 and SS14 at an average of £306,589.
Which train stations are available in or near SS?
Some of the train stations available in or near SS are Rayleigh, Benfleet and Leigh-On-Sea.