
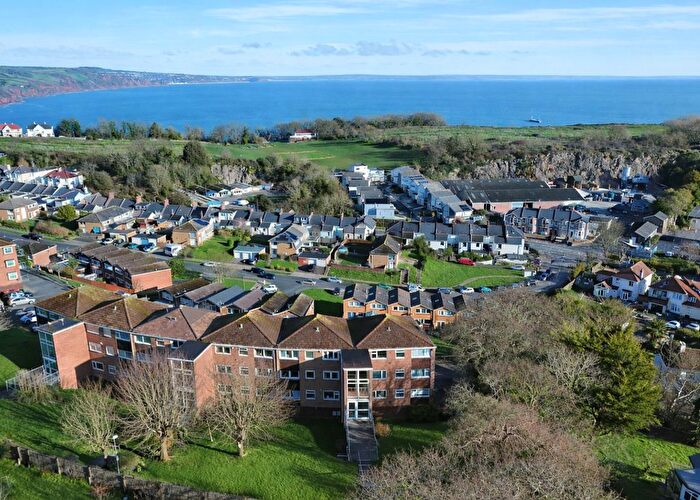
Properties for sale in TQ1
Torquay, St Marychurch
- Info
- Price Paid By Year
- Property Type Price
- Transport
House Prices in TQ1
Properties in TQ1 have an average house price of £262,416.00 and had 1600 Property Transactions within the last 3 years.
The most expensive property was sold for £3,110,000.00.
Property Price Paid in TQ1 by Year
The average sold property price by year was:
| Year | Average Sold Price | Sold Properties |
|---|---|---|
| 2026 | £249,230.00 | 13 Properties |
| 2025 | £241,390.00 | 481 Properties |
| 2024 | £265,453.00 | 551 Properties |
| 2023 | £277,933.00 | 555 Properties |
| 2022 | £263,597.00 | 826 Properties |
| 2021 | £260,163.00 | 1,071 Properties |
| 2020 | £241,583.00 | 615 Properties |
| 2019 | £213,724.00 | 769 Properties |
| 2018 | £217,344.00 | 818 Properties |
| 2017 | £213,412.00 | 841 Properties |
| 2016 | £203,951.00 | 847 Properties |
| 2015 | £197,752.00 | 782 Properties |
| 2014 | £183,272.00 | 731 Properties |
| 2013 | £188,417.00 | 576 Properties |
| 2012 | £186,640.00 | 535 Properties |
| 2011 | £184,580.00 | 500 Properties |
| 2010 | £194,065.00 | 469 Properties |
| 2009 | £179,882.00 | 514 Properties |
| 2008 | £192,393.00 | 534 Properties |
| 2007 | £202,978.00 | 1,033 Properties |
| 2006 | £181,813.00 | 1,083 Properties |
| 2005 | £175,741.00 | 803 Properties |
| 2004 | £161,923.00 | 1,051 Properties |
| 2003 | £136,174.00 | 1,121 Properties |
| 2002 | £116,974.00 | 1,333 Properties |
| 2001 | £98,497.00 | 1,242 Properties |
| 2000 | £88,202.00 | 1,144 Properties |
| 1999 | £76,431.00 | 1,084 Properties |
| 1998 | £68,463.00 | 958 Properties |
| 1997 | £67,798.00 | 1,007 Properties |
| 1996 | £60,296.00 | 865 Properties |
| 1995 | £59,672.00 | 648 Properties |
Property Price per Property Type in TQ1
Here you can find historic sold price data in order to help with your property search.
The average Property Paid Price for specific property types in the last three years are:
| Property Type | Average Sold Price | Sold Properties |
|---|---|---|
| Semi Detached House | £334,345.00 | 133 Semi Detached Houses |
| Terraced House | £240,454.00 | 574 Terraced Houses |
| Detached House | £628,182.00 | 183 Detached Houses |
| Flat | £172,423.00 | 710 Flats |
Transport near TQ1

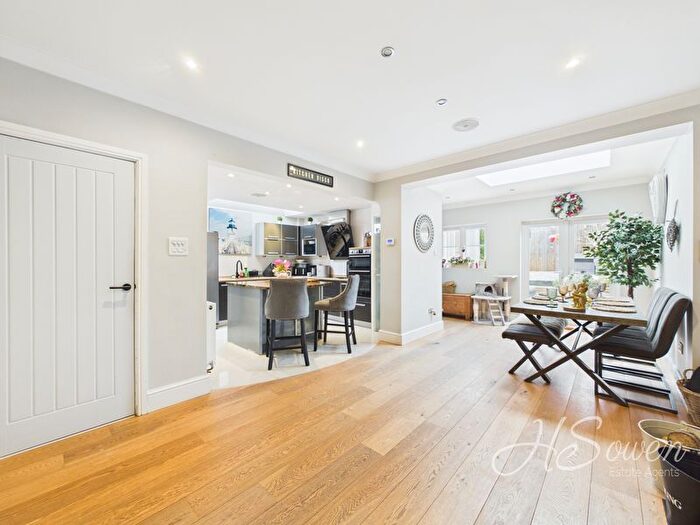
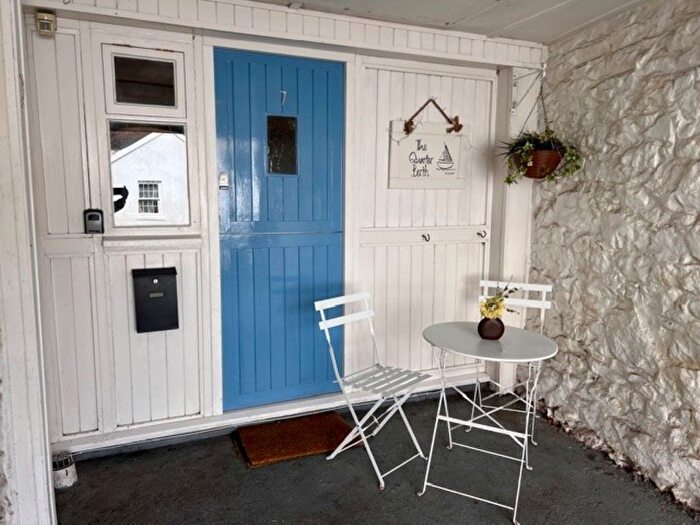
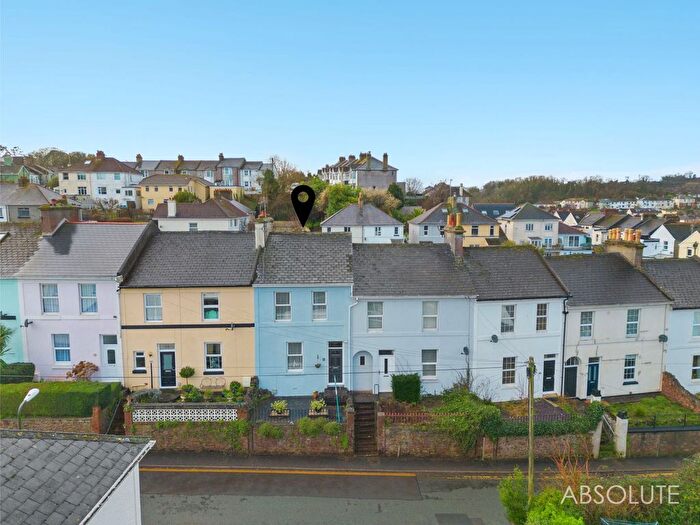
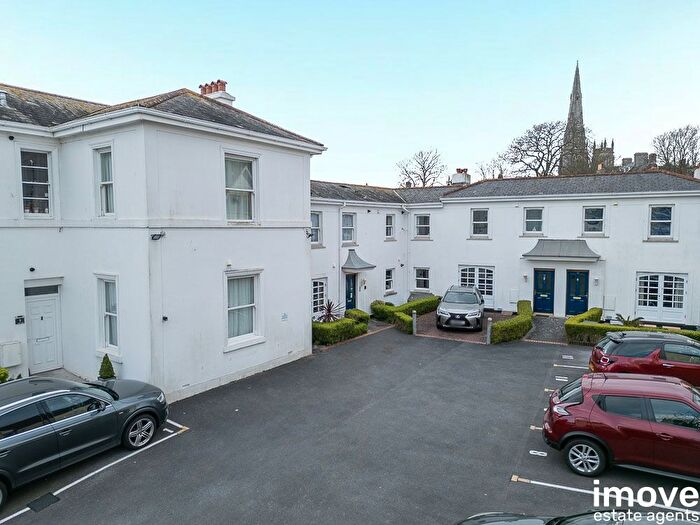
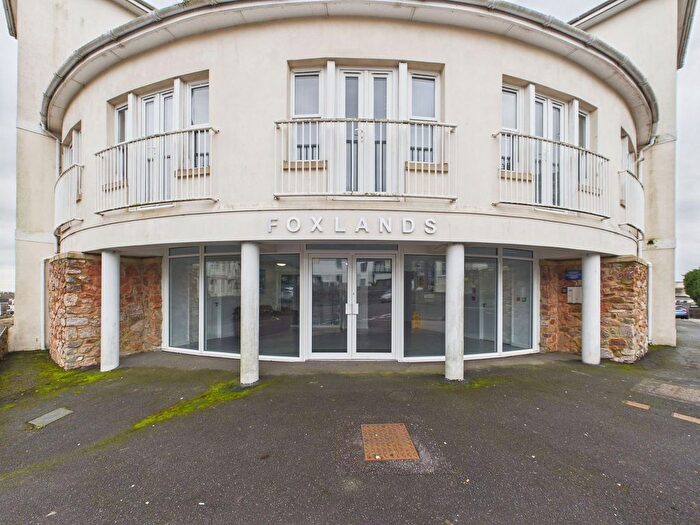
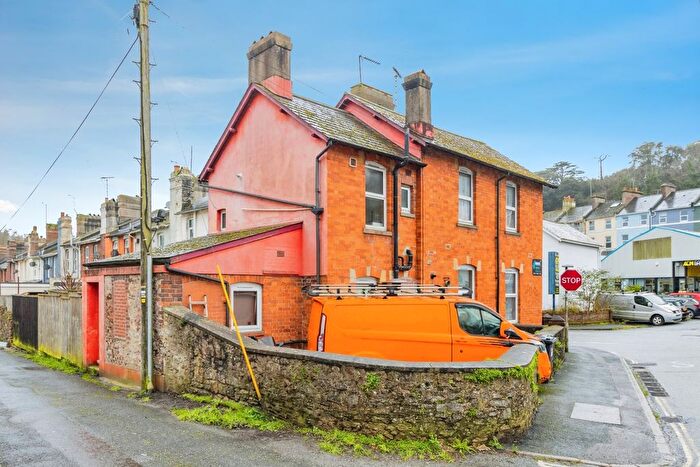
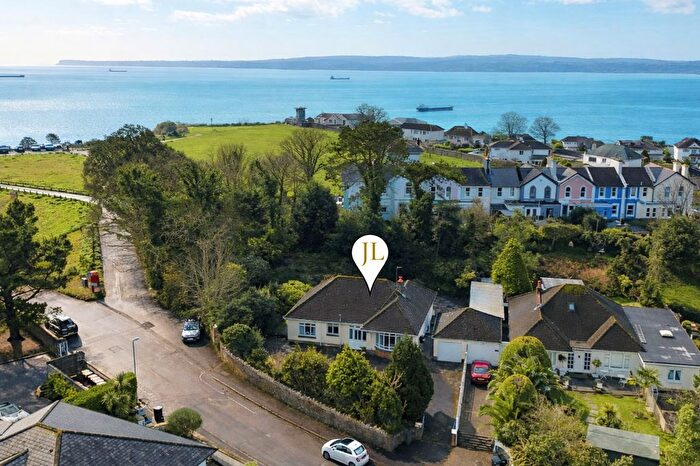
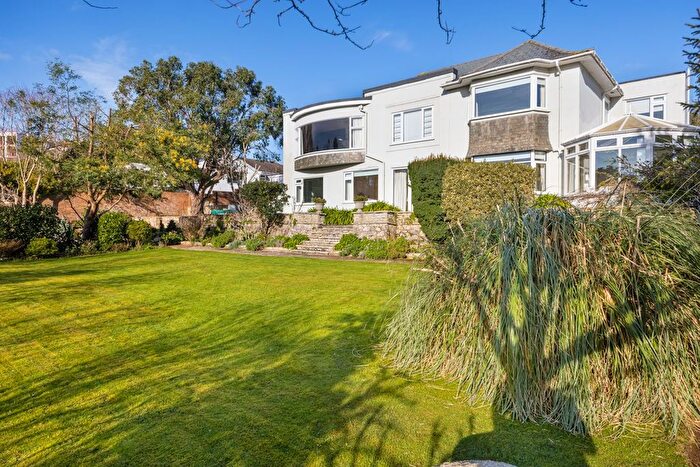
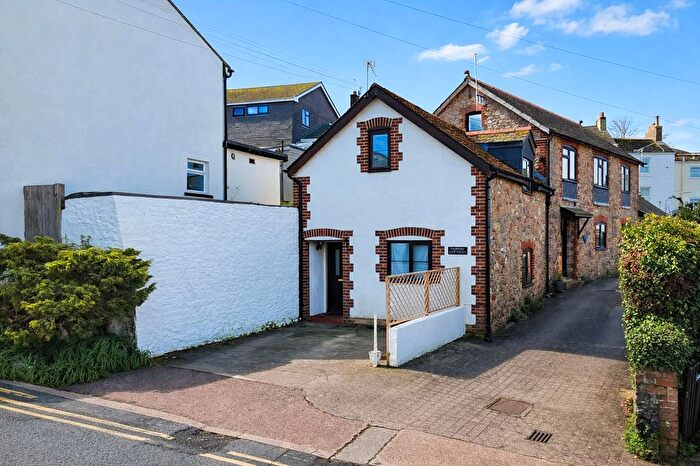
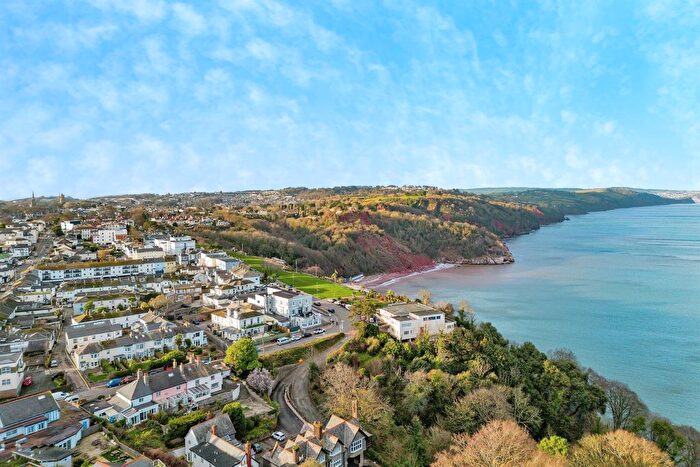
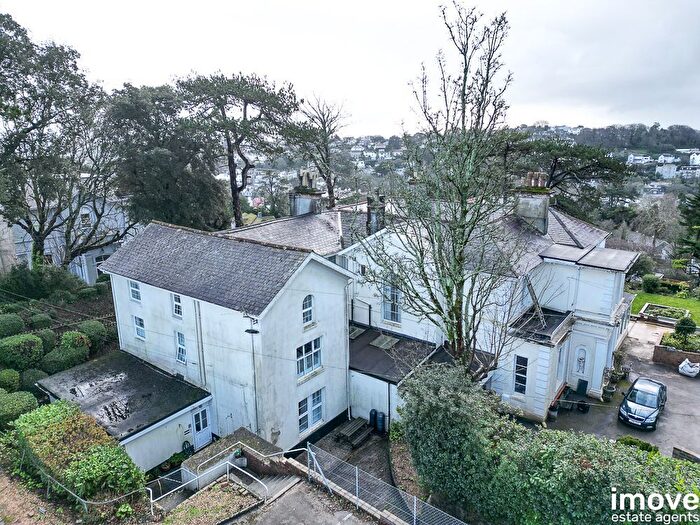
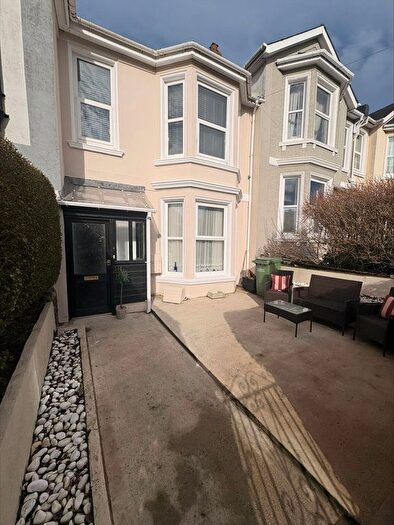
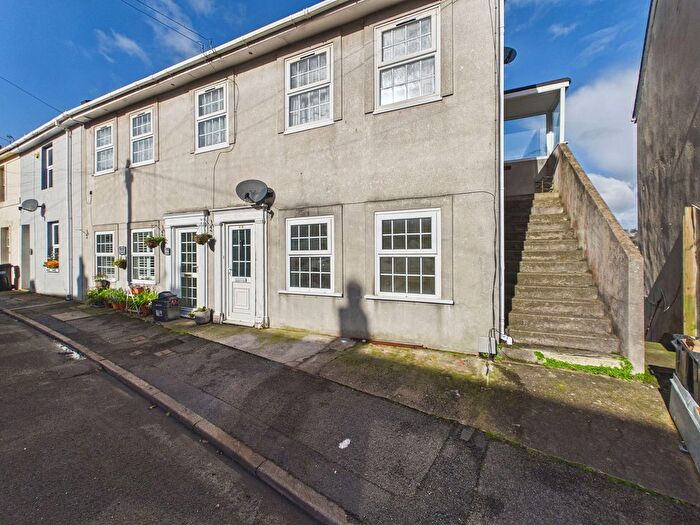
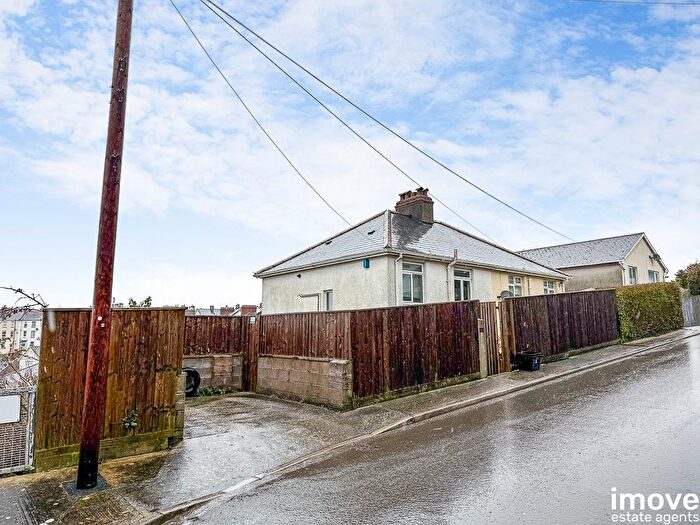
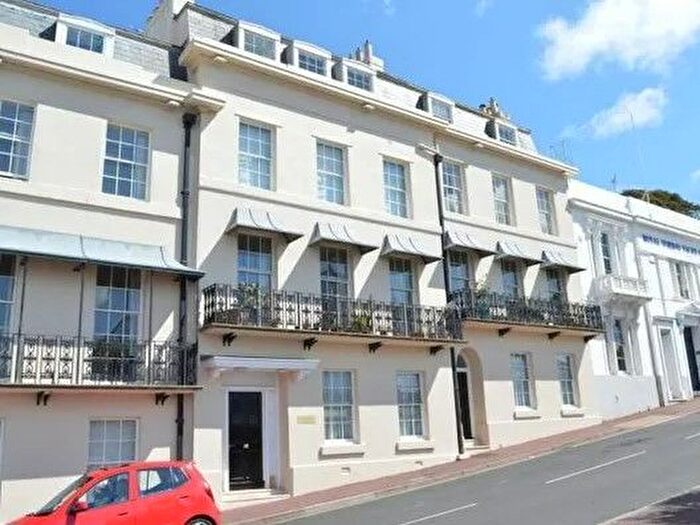
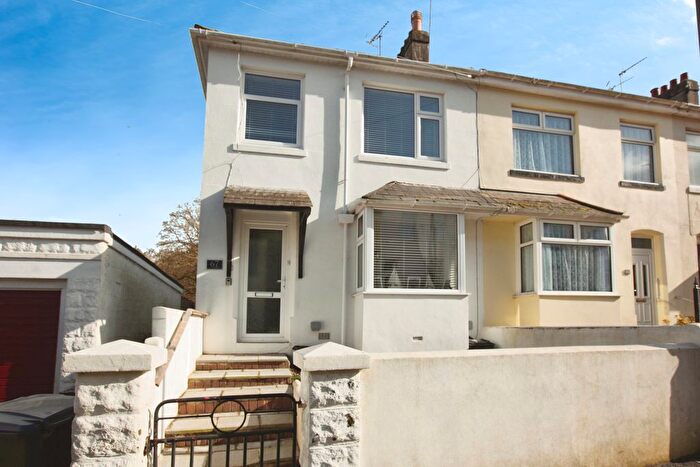
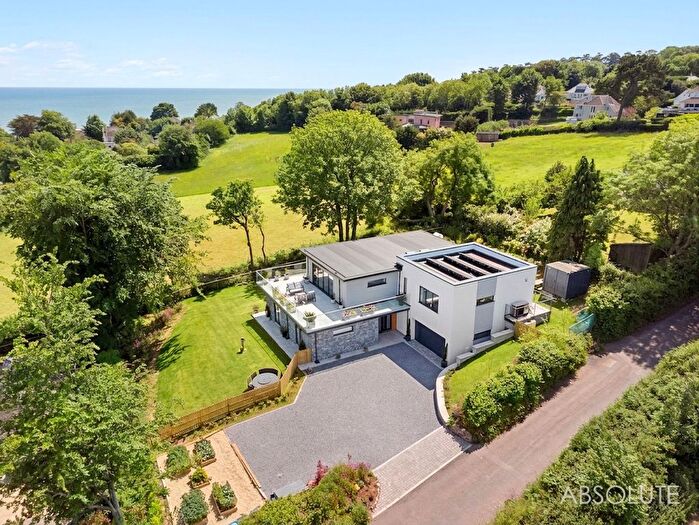
Houses and Flats for sale in TQ1, Torquay, St Marychurch
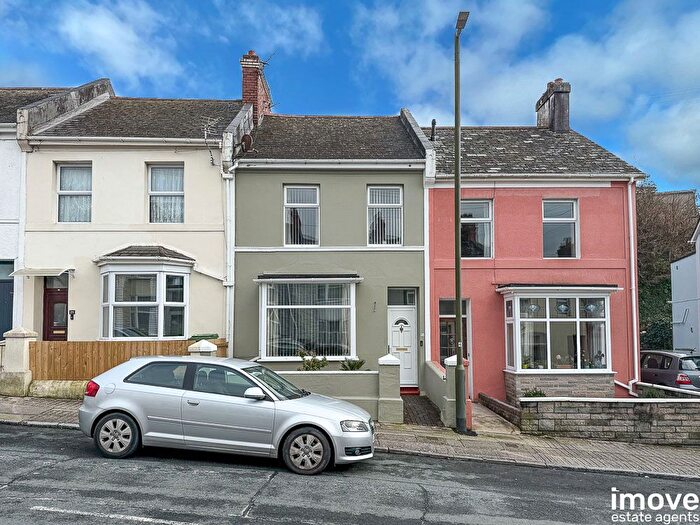
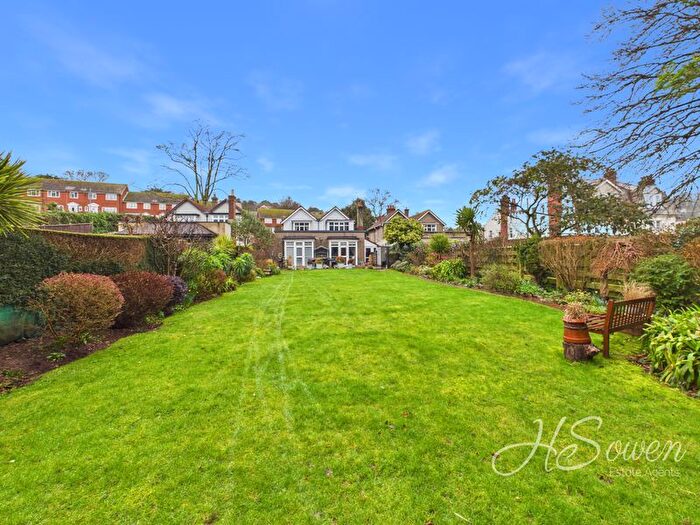
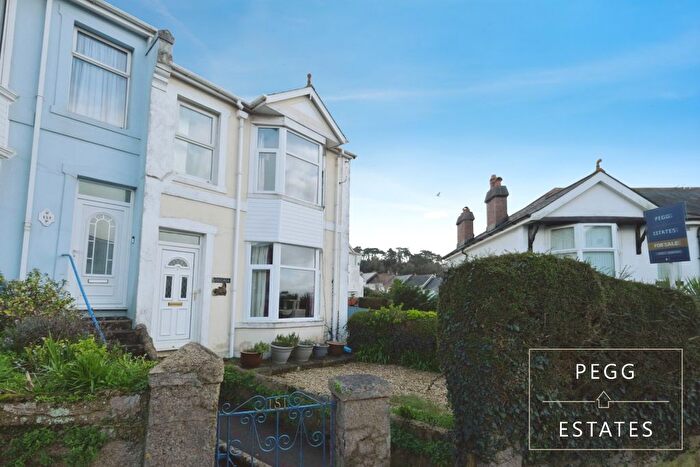
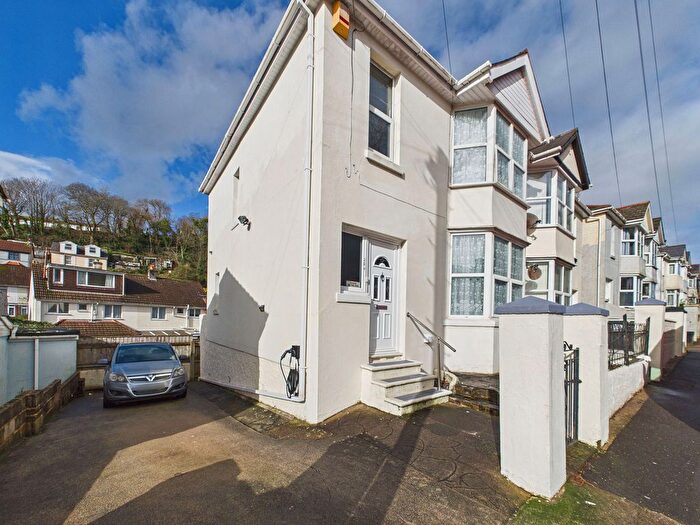
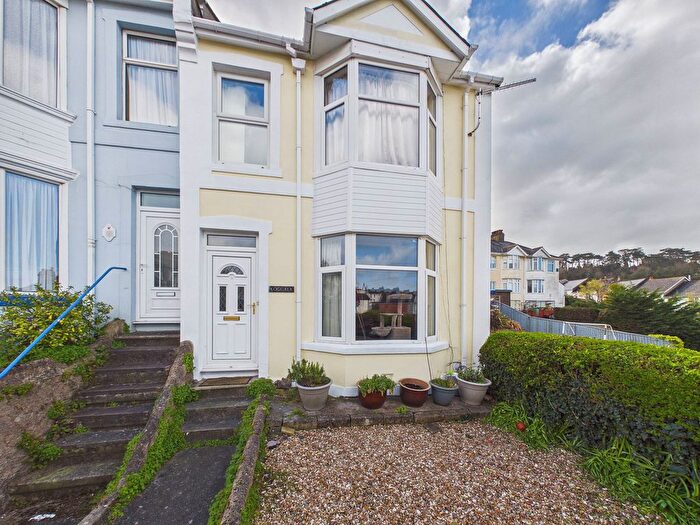
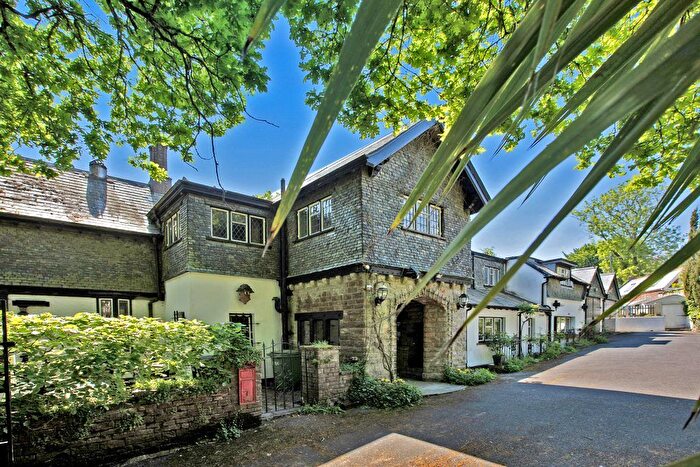
![]()
If you are looking to sell your house, let it out, or receive a property valuation, an expert can help you.
Click the button below to get started.
Frequently Asked Questions about TQ1
What is the average price for a property for sale in TQ1?
The average price for a property for sale in TQ1 is £262,416. There are 218 property listings for sale in TQ1.
Which areas are included in the TQ1 postcode district?
The main areas within TQ1 include Torquay (centre) and St Marychurch.
What are the most common property types in TQ1?
The most common property types in TQ1 are Flats, Terraced Houses, Detached Houses and Semi Detached Houses.
What has been the average sold property price in TQ1 over the last three years?
Flats in TQ1 have an average sold price of £172,423, while Terraced Houses have an average of £240,454. Detached Houses have an average of £628,182 and Semi Detached Houses have an average of £334,345. The average sold property price in TQ1 over the last three years is approximately £252,024.
Which train stations are available in TQ1?
The train stations available in TQ1 are Newton Abbot Station and Teignmouth Station..