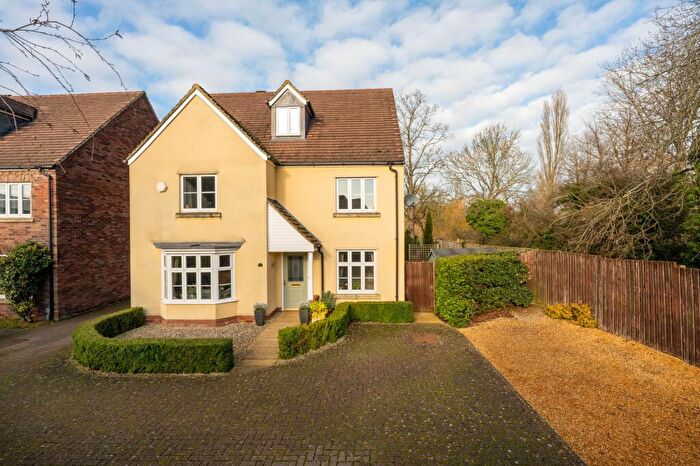
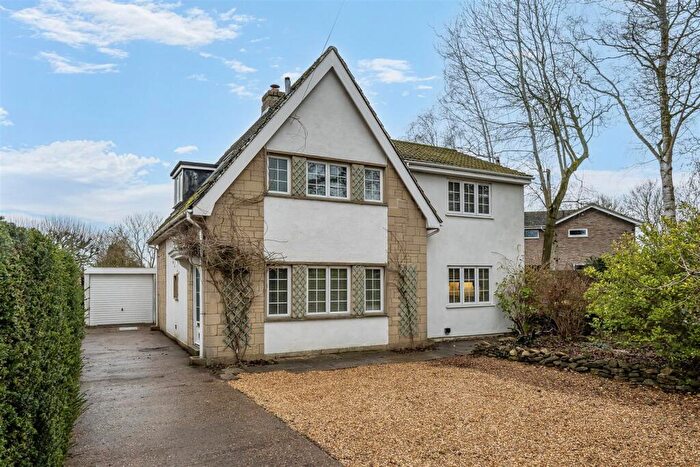
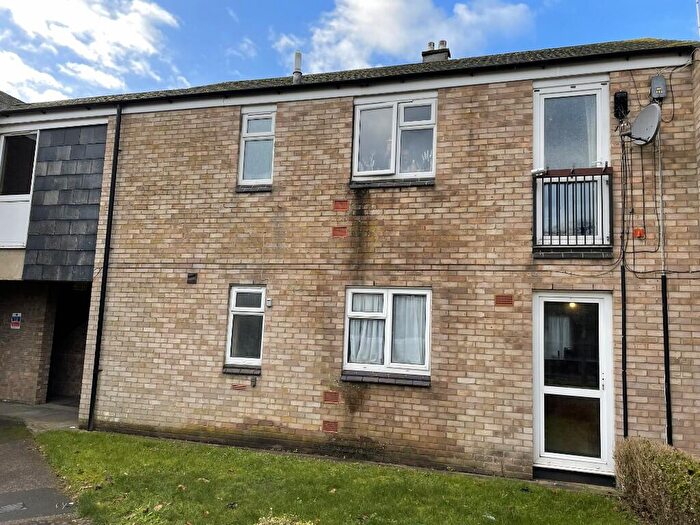
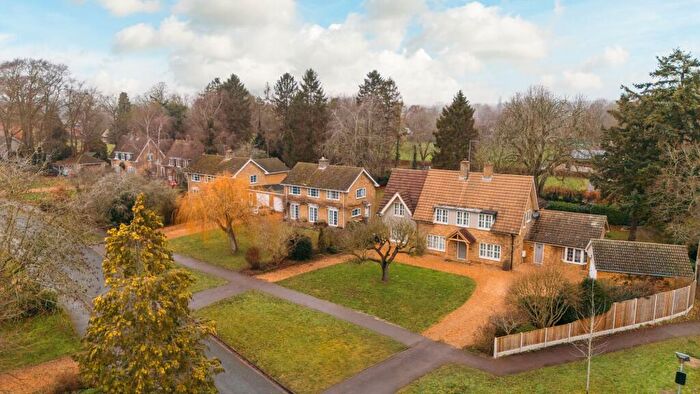
Houses for sale & to rent in Harrold, Bedford
House Prices in Harrold
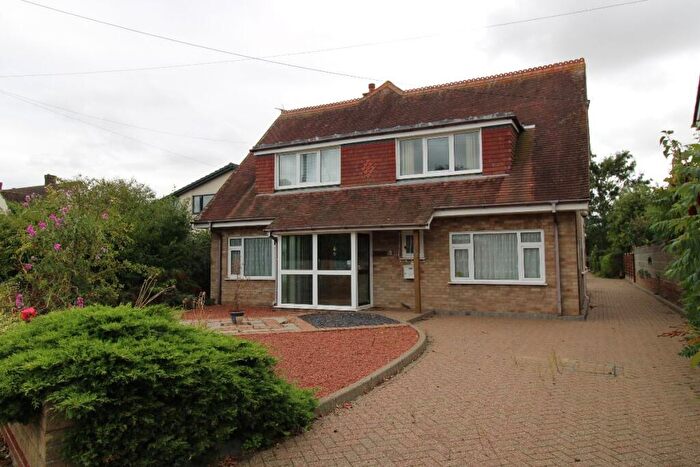
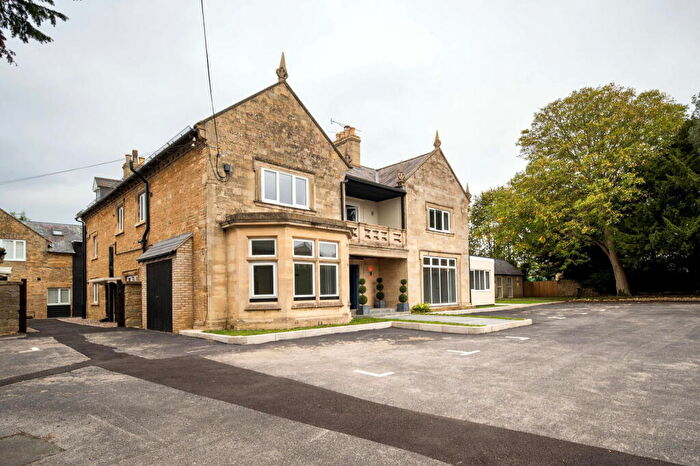
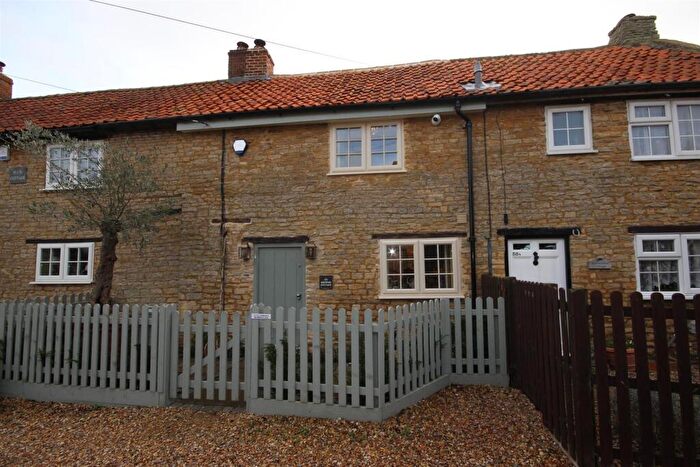
Properties in Harrold have an average house price of £427,203.00 and had 101 Property Transactions within the last 3 years¹.
Harrold is an area in Bedford, Bedfordshire with 1,189 households², where the most expensive property was sold for £1,310,000.00.
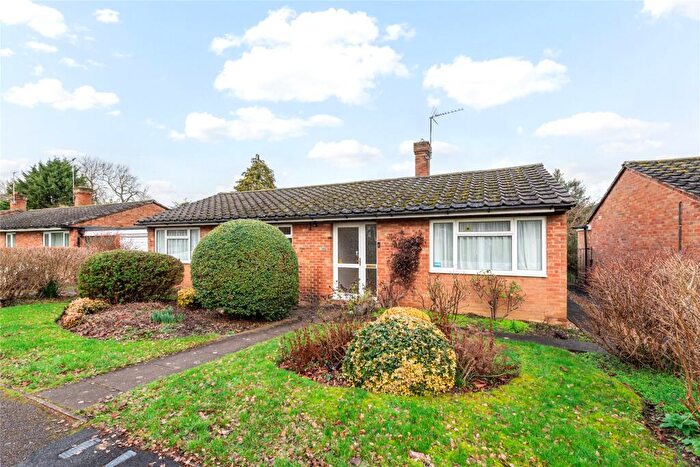
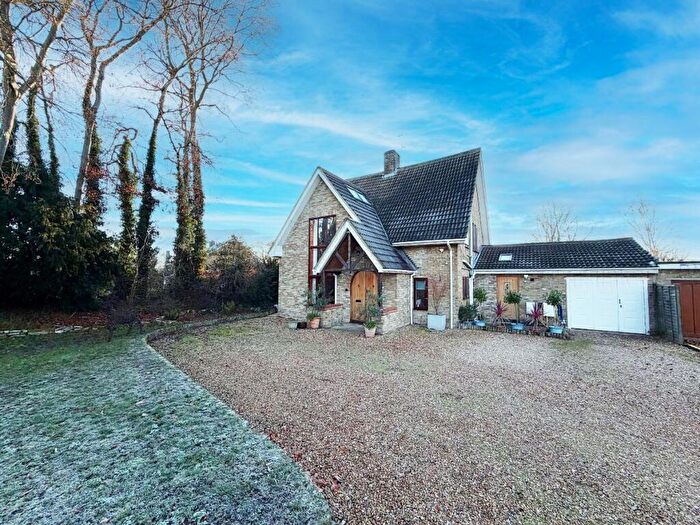
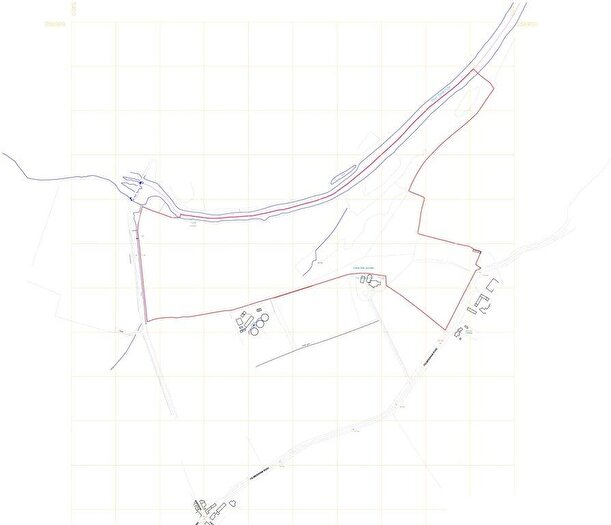
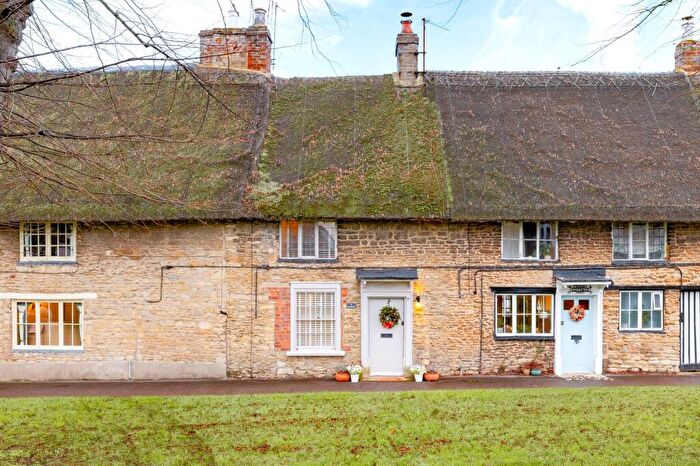
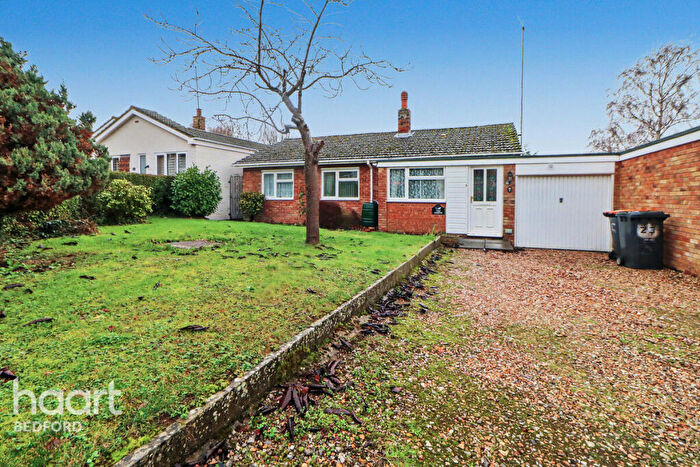
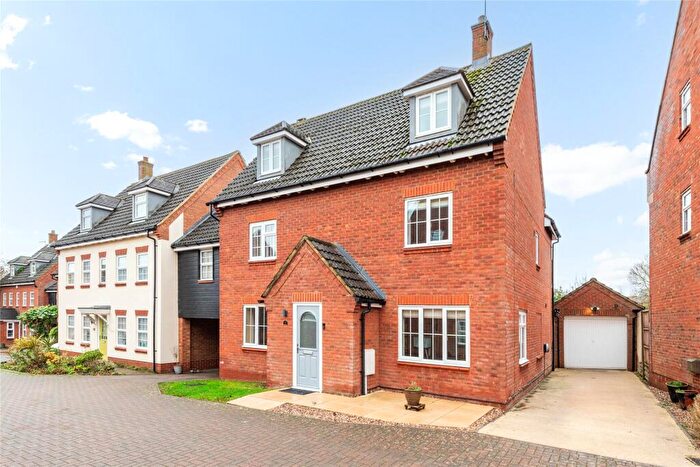
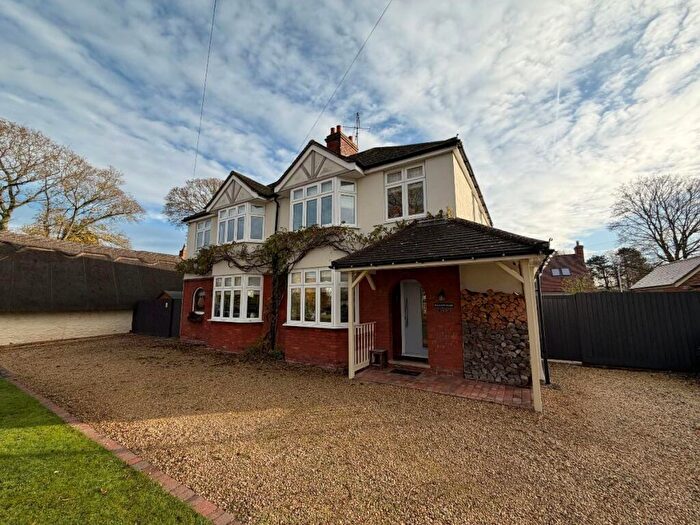
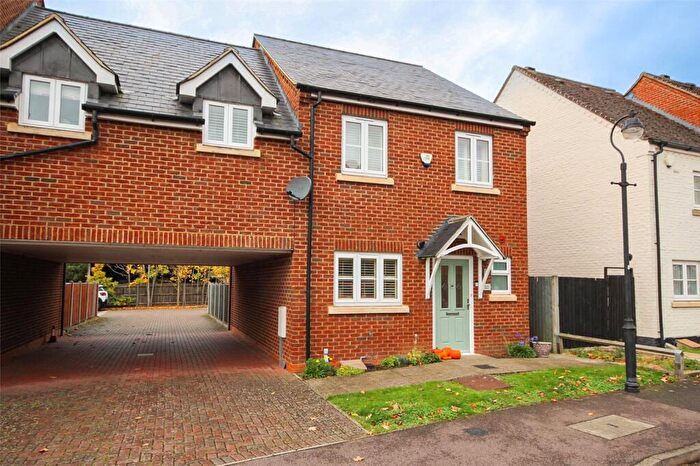
Properties for sale in Harrold
Roads and Postcodes in Harrold
Navigate through our locations to find the location of your next house in Harrold, Bedford for sale or to rent.
| Streets | Postcodes |
|---|---|
| Barley Kiln Lane | MK43 7FB |
| Bedford Road | NN10 0SG |
| Beeby Way | MK43 7LW |
| Bramley Court | MK43 7BG |
| Bridge End | MK43 7LP |
| Brook Lane | MK43 7BW |
| Carlton Road | MK43 7DS MK43 7DT |
| Carriers Way | MK43 7LN |
| Chapel Lane | MK44 1HD |
| Church Lane | MK43 7AA MK43 7AB MK43 7AD |
| Church Walk | MK43 7DG |
| Colworth Estate | MK44 1LB |
| Dickens Close | MK43 7ER |
| Dove Lane | MK43 7DF |
| Dungee Road | MK43 7AF MK43 7AH |
| Eagle Way | MK43 7EW |
| Edens Lane | MK43 7LE |
| Felmersham Road | MK43 7NA MK43 7LR |
| Hall Close | MK43 7DU |
| Harewelle Way | MK43 7DW MK43 7DY |
| High Elms | MK43 7LF |
| High Street | MK43 7AR MK43 7AS MK43 7BB MK43 7BH MK43 7BJ MK43 7DA MK43 7DQ MK43 7EA MK43 7ED MK43 7JX MK43 7LA MK43 7AX MK43 7DJ |
| Horsefair Lane | MK43 7AU |
| Lavendon Road | MK43 7EE MK43 7EF MK43 7EG |
| Manor Close | MK43 7LD |
| Mansion Lane | MK43 7BN |
| Meadway | MK43 7DP MK43 7DR |
| Mill Lane | MK43 7AT |
| Mowhills | MK43 7EB |
| New Road | MK43 7EH MK43 7EJ MK43 7EL MK43 7EP |
| Odell Road | MK43 7AE MK43 7AP MK43 7DH MK44 1JW |
| Orchard Lane | MK43 7BE MK43 7BP MK43 7BT MK43 7BU |
| Pavenham Road | MK43 7LS MK43 7ND MK43 7NB |
| Peachs Close | MK43 7DX |
| Priory Close | MK43 7DL |
| Rectory Close | MK43 7JT |
| Roman Paddock | MK43 7FR |
| Saxon House End | MK43 7FS |
| School Lane | MK43 7DE MK43 7LG MK43 7LQ |
| Sharpe Close | MK43 7AW |
| Street Close | MK43 7LB |
| Tannery Lane | MK43 7AJ |
| The Causeway | MK43 7LT MK43 7LU MK43 7LX |
| The Green | MK43 7DB |
| The Marsh | MK43 7JU |
| The Moor | MK43 7JR MK43 7JS |
| Turvey Road | MK43 7LH |
| Wood Road | MK43 7BS |
Transport near Harrold
-
Bedford Midland Station
-
Bedford St.Johns Station
-
Wellingborough Station
-
Kempston Hardwick Station
-
Stewartby Station
- FAQ
- Price Paid By Year
- Property Type Price
Frequently asked questions about Harrold
What is the average price for a property for sale in Harrold?
The average price for a property for sale in Harrold is £427,203. This amount is 15% higher than the average price in Bedford. There are 819 property listings for sale in Harrold.
What streets have the most expensive properties for sale in Harrold?
The streets with the most expensive properties for sale in Harrold are Tannery Lane at an average of £1,310,000, Manor Close at an average of £1,220,000 and Meadway at an average of £548,333.
What streets have the most affordable properties for sale in Harrold?
The streets with the most affordable properties for sale in Harrold are Bramley Court at an average of £195,000, Peachs Close at an average of £198,333 and Mansion Lane at an average of £221,000.
Which train stations are available in or near Harrold?
Some of the train stations available in or near Harrold are Bedford Midland, Bedford St.Johns and Wellingborough.
Property Price Paid in Harrold by Year
The average sold property price by year was:
| Year | Average Sold Price | Price Change |
Sold Properties
|
|---|---|---|---|
| 2025 | £420,642 | 0,4% |
28 Properties |
| 2024 | £419,118 | -5% |
35 Properties |
| 2023 | £439,485 | -2% |
38 Properties |
| 2022 | £446,890 | 17% |
43 Properties |
| 2021 | £372,107 | -16% |
49 Properties |
| 2020 | £432,462 | 17% |
53 Properties |
| 2019 | £361,078 | -6% |
32 Properties |
| 2018 | £383,303 | 6% |
48 Properties |
| 2017 | £358,508 | 8% |
56 Properties |
| 2016 | £330,791 | -2% |
51 Properties |
| 2015 | £338,442 | 23% |
56 Properties |
| 2014 | £261,465 | -7% |
58 Properties |
| 2013 | £280,892 | -9% |
28 Properties |
| 2012 | £305,957 | 18% |
35 Properties |
| 2011 | £252,320 | -21% |
35 Properties |
| 2010 | £306,185 | 10% |
41 Properties |
| 2009 | £276,467 | 16% |
31 Properties |
| 2008 | £232,775 | -23% |
32 Properties |
| 2007 | £285,812 | 17% |
57 Properties |
| 2006 | £237,469 | -15% |
85 Properties |
| 2005 | £273,259 | 8% |
65 Properties |
| 2004 | £252,277 | 9% |
67 Properties |
| 2003 | £229,731 | 20% |
69 Properties |
| 2002 | £183,397 | 12% |
76 Properties |
| 2001 | £161,754 | 17% |
43 Properties |
| 2000 | £133,616 | 2% |
40 Properties |
| 1999 | £130,647 | 19% |
53 Properties |
| 1998 | £105,254 | 4% |
47 Properties |
| 1997 | £101,257 | 3% |
55 Properties |
| 1996 | £97,752 | 5% |
38 Properties |
| 1995 | £93,166 | - |
49 Properties |
Property Price per Property Type in Harrold
Here you can find historic sold price data in order to help with your property search.
The average Property Paid Price for specific property types in the last three years are:
| Property Type | Average Sold Price | Sold Properties |
|---|---|---|
| Semi Detached House | £352,083.00 | 24 Semi Detached Houses |
| Detached House | £607,027.00 | 40 Detached Houses |
| Terraced House | £305,810.00 | 29 Terraced Houses |
| Flat | £193,500.00 | 8 Flats |

