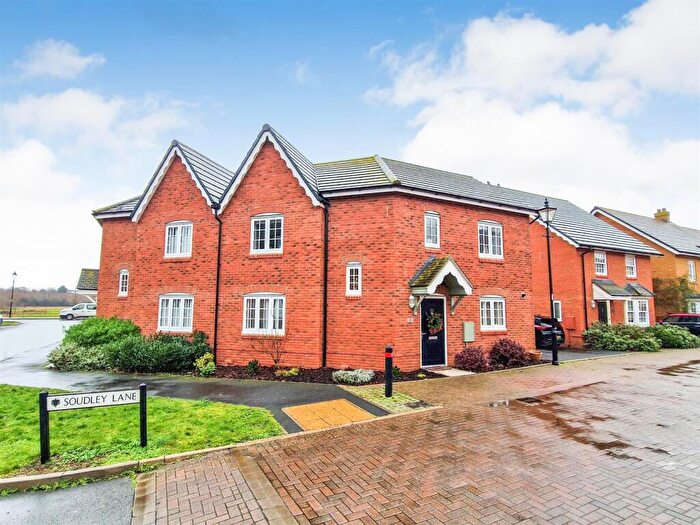
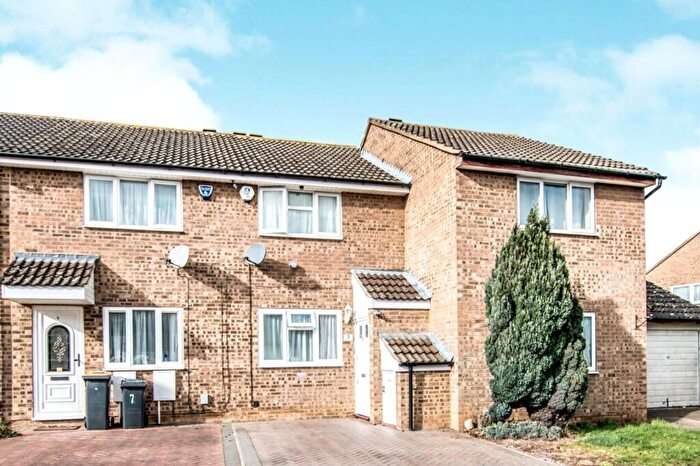
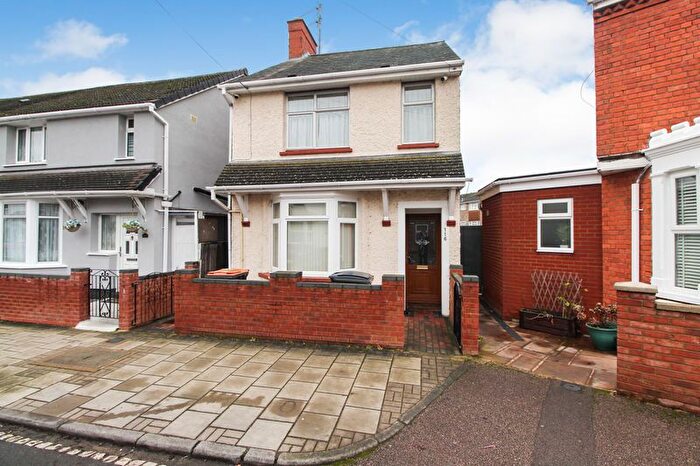
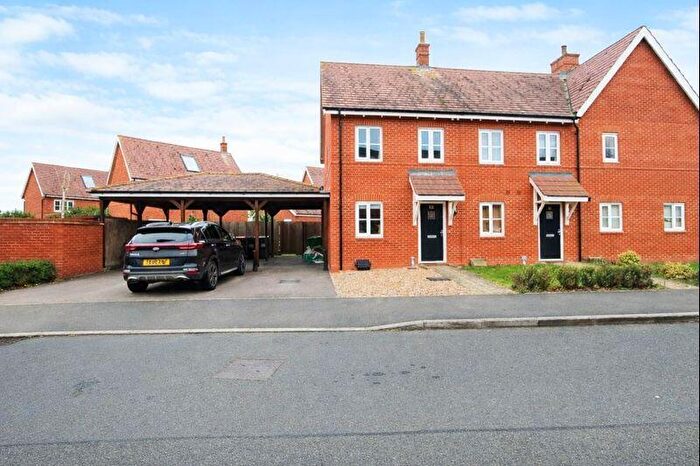
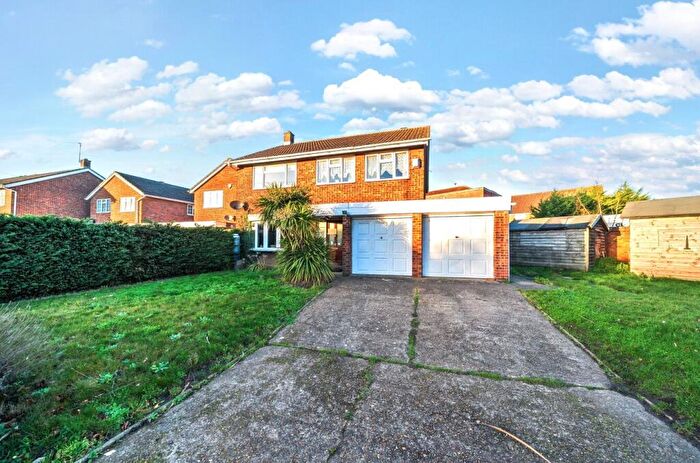
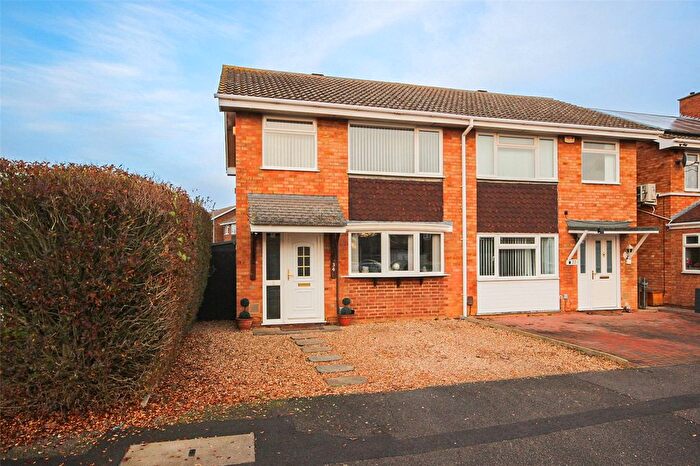
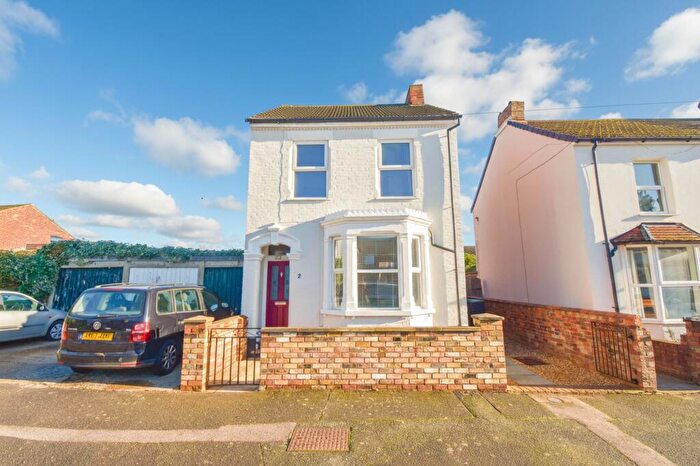
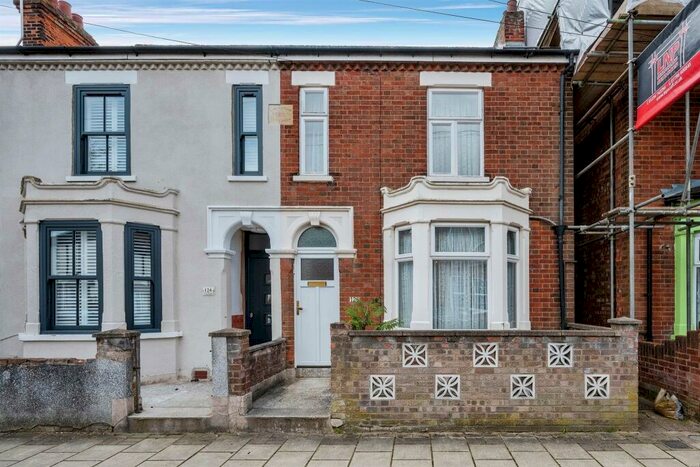
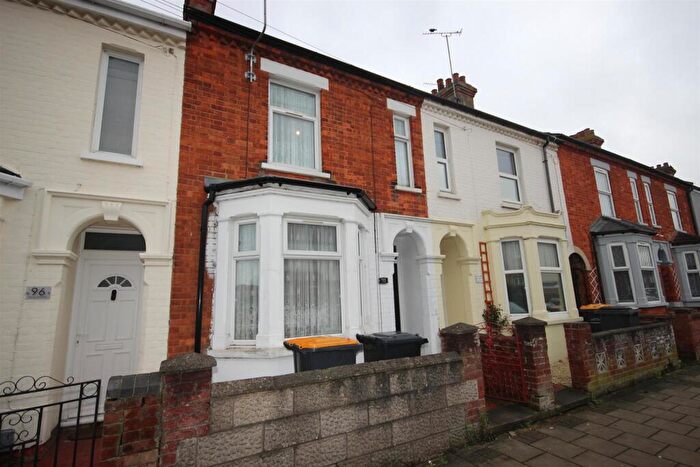
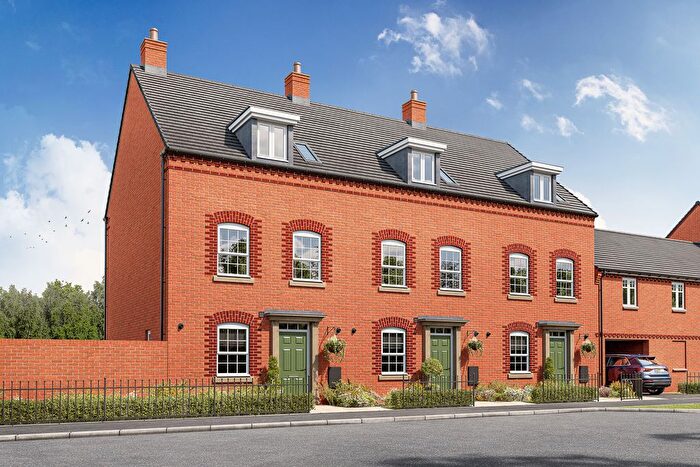
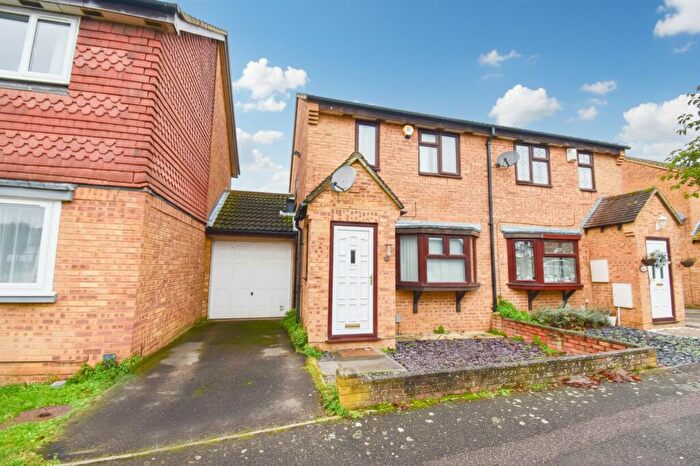
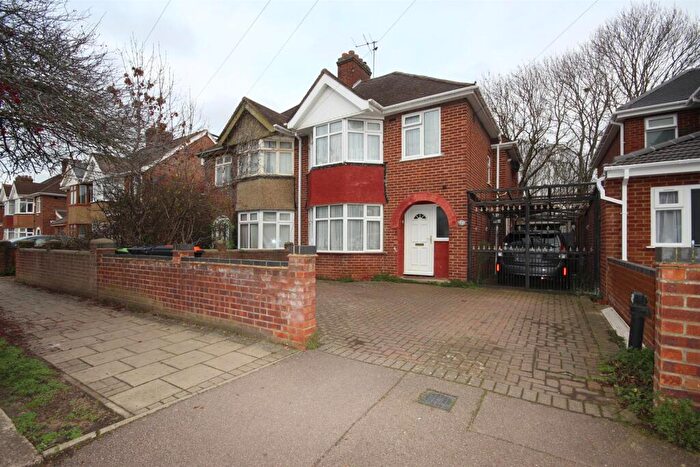
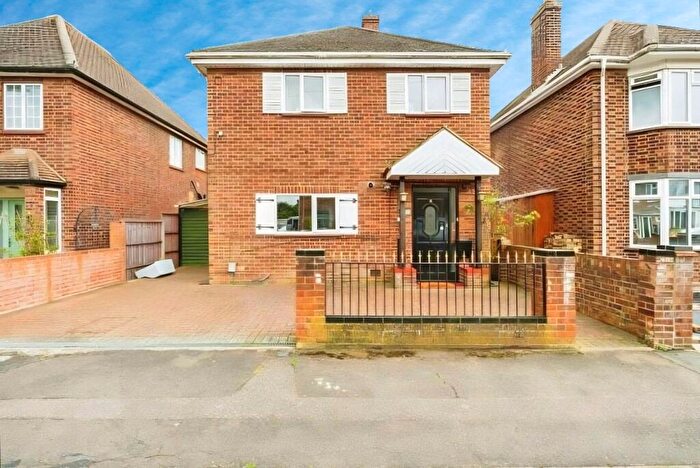
Houses for sale & to rent in Kempston North, Bedford
House Prices in Kempston North
Properties in Kempston North have an average house price of £319,698.00 and had 125 Property Transactions within the last 3 years¹.
Kempston North is an area in Bedford, Bedfordshire with 1,522 households², where the most expensive property was sold for £600,000.00.
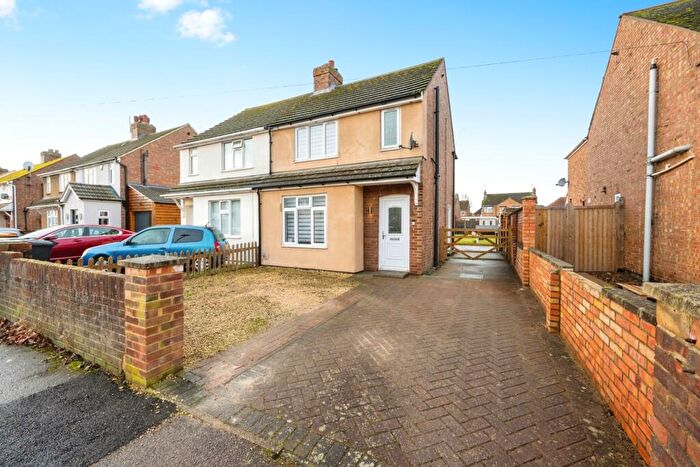
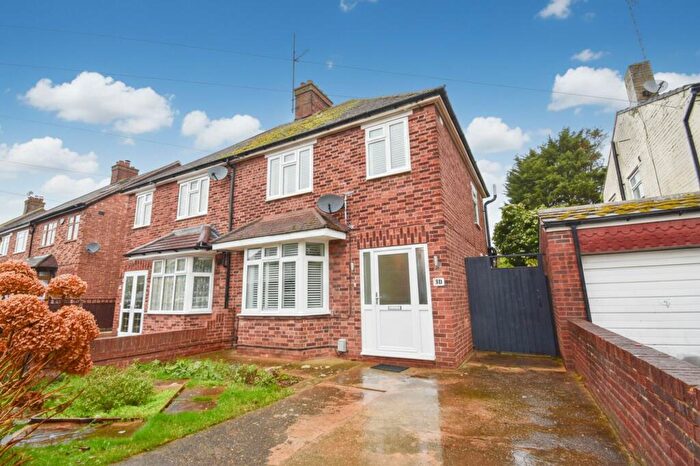
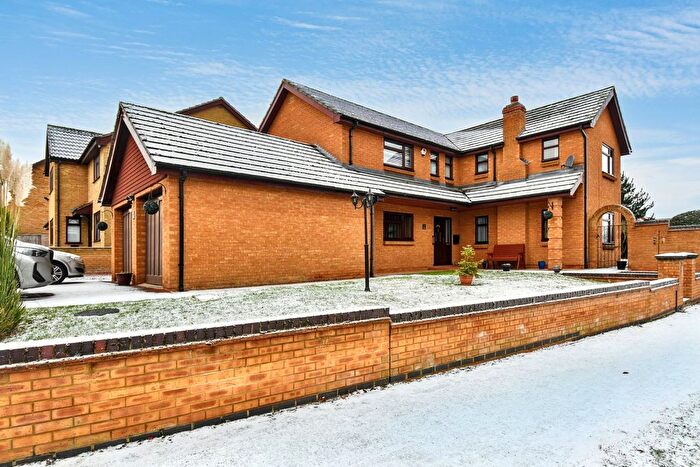
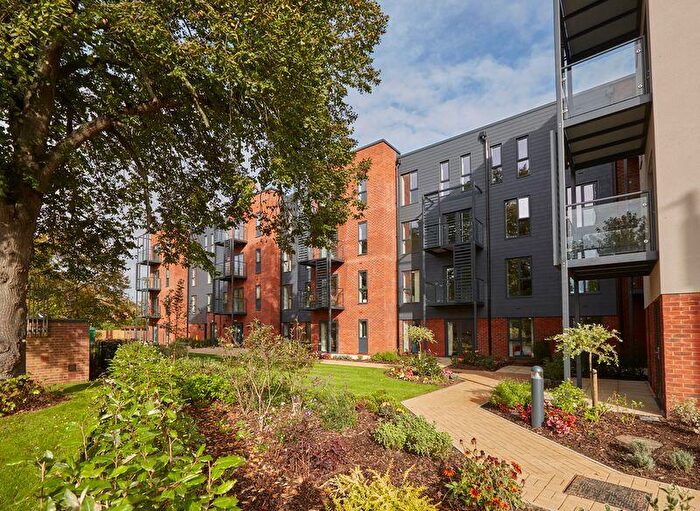
Properties for sale in Kempston North
Roads and Postcodes in Kempston North
Navigate through our locations to find the location of your next house in Kempston North, Bedford for sale or to rent.
| Streets | Postcodes |
|---|---|
| Adamson Walk | MK42 8QU MK42 8QT MK42 8QZ |
| Addison Howard Park Road | MK42 8AP |
| Bedford Road | MK42 8DG MK42 8PN MK42 8PU |
| Burgess Close | MK42 8RF |
| Butler Way | MK42 8TR MK42 8TT MK42 8UE MK42 8UF |
| Canterbury Close | MK42 8TU |
| Chandler Path | MK42 8QW |
| Chapman Close | MK42 8RU |
| Denton Close | MK42 8RY |
| Downfield Way | MK42 8UN MK42 8UW |
| Earls Holme | MK42 8PG |
| Egglestone Close | MK42 8QE |
| Ely Way | MK42 8TN MK42 8TW |
| Emmerton Road | MK42 8QS MK42 8QX |
| Foster Place | MK42 8BX |
| Foster Road | MK42 8BT MK42 8BU |
| Fountain Grove | MK42 8UH |
| Fowler Close | MK42 8RJ |
| Garden Close | MK42 8UJ |
| Gilbert Close | MK42 8RN |
| Gulliver Close | MK42 8RB |
| Halsey Road | MK42 8AT MK42 8AU |
| Hartwell Drive | MK42 8US MK42 8UY MK42 8SU MK42 8UL MK42 8UT MK42 8UU MK42 8UX |
| Hillgrounds Road | MK42 8QG MK42 8QH MK42 8QJ MK42 8QL MK42 8QP MK42 8QQ MK42 8RD MK42 8RG MK42 8RQ MK42 8SA MK42 8SB MK42 8TH MK42 8TP MK42 8HQ MK42 8HW MK42 8RL MK42 8SZ MK42 8UB |
| King Street | MK42 8BN MK42 8BW |
| Kingston Close | MK42 8WA |
| Lichfield Close | MK42 8UA |
| Loveridge Avenue | MK42 8SD MK42 8SE MK42 8SF MK42 8SG |
| Marshall Close | MK42 8RT |
| Mayfield Close | MK42 8UP |
| Mobbs Close | MK42 8RS |
| Mortimer Road | MK42 8RE |
| Newbury Close | MK42 8QF |
| Odell Close | MK42 8RZ |
| Penwright Close | MK42 8QR |
| Prentice Gardens | MK42 8TJ |
| Proctor Close | MK42 8RA |
| Ripon Close | MK42 8UZ |
| Sanders Close | MK42 8RX |
| Slater Close | MK42 8SQ |
| Stanton Road | MK42 8QY |
| Vanguard Close | MK42 8UG |
| Viking Grove | MK42 8UD |
| Vineyard Way | MK42 8UR |
| Vyne Close | MK42 8RH |
| Wells Close | MK42 8TS |
| Westminster Gardens | MK42 8TX |
Transport near Kempston North
- FAQ
- Price Paid By Year
- Property Type Price
Frequently asked questions about Kempston North
What is the average price for a property for sale in Kempston North?
The average price for a property for sale in Kempston North is £319,698. This amount is 14% lower than the average price in Bedford. There are 1,267 property listings for sale in Kempston North.
What streets have the most expensive properties for sale in Kempston North?
The streets with the most expensive properties for sale in Kempston North are Foster Place at an average of £495,000, Lichfield Close at an average of £412,952 and Hartwell Drive at an average of £405,833.
What streets have the most affordable properties for sale in Kempston North?
The streets with the most affordable properties for sale in Kempston North are Odell Close at an average of £193,250, Mayfield Close at an average of £220,000 and Burgess Close at an average of £224,250.
Which train stations are available in or near Kempston North?
Some of the train stations available in or near Kempston North are Bedford Midland, Bedford St.Johns and Kempston Hardwick.
Property Price Paid in Kempston North by Year
The average sold property price by year was:
| Year | Average Sold Price | Price Change |
Sold Properties
|
|---|---|---|---|
| 2025 | £321,947 | 5% |
30 Properties |
| 2024 | £306,344 | -6% |
38 Properties |
| 2023 | £323,642 | -2% |
28 Properties |
| 2022 | £331,062 | 13% |
29 Properties |
| 2021 | £289,431 | 11% |
47 Properties |
| 2020 | £258,571 | -6% |
28 Properties |
| 2019 | £274,446 | -5% |
33 Properties |
| 2018 | £289,089 | 16% |
28 Properties |
| 2017 | £242,423 | 1% |
29 Properties |
| 2016 | £238,933 | 16% |
31 Properties |
| 2015 | £200,637 | 12% |
47 Properties |
| 2014 | £175,853 | 8% |
46 Properties |
| 2013 | £161,614 | -9% |
33 Properties |
| 2012 | £175,903 | 8% |
29 Properties |
| 2011 | £162,562 | -8% |
32 Properties |
| 2010 | £174,887 | 1% |
33 Properties |
| 2009 | £173,350 | -6% |
40 Properties |
| 2008 | £184,299 | 6% |
28 Properties |
| 2007 | £172,356 | 3% |
56 Properties |
| 2006 | £166,953 | 4% |
60 Properties |
| 2005 | £160,448 | 3% |
49 Properties |
| 2004 | £154,995 | 7% |
56 Properties |
| 2003 | £144,618 | 21% |
73 Properties |
| 2002 | £114,129 | 17% |
74 Properties |
| 2001 | £94,329 | 5% |
89 Properties |
| 2000 | £89,958 | 16% |
72 Properties |
| 1999 | £75,888 | 12% |
76 Properties |
| 1998 | £66,760 | 1% |
76 Properties |
| 1997 | £66,064 | 8% |
98 Properties |
| 1996 | £60,933 | 8% |
82 Properties |
| 1995 | £56,070 | - |
61 Properties |
Property Price per Property Type in Kempston North
Here you can find historic sold price data in order to help with your property search.
The average Property Paid Price for specific property types in the last three years are:
| Property Type | Average Sold Price | Sold Properties |
|---|---|---|
| Semi Detached House | £308,872.00 | 29 Semi Detached Houses |
| Detached House | £389,952.00 | 49 Detached Houses |
| Terraced House | £259,371.00 | 44 Terraced Houses |
| Flat | £161,666.00 | 3 Flats |

