
Houses for sale & to rent in Kempston South, Bedford
House Prices in Kempston South
Properties in Kempston South have an average house price of £295k and had 147 Property Transactions within the last 3 years¹.
Kempston South is an area in Bedford, Bedfordshire with 1,618 households², where the most expensive property was sold for £470k.
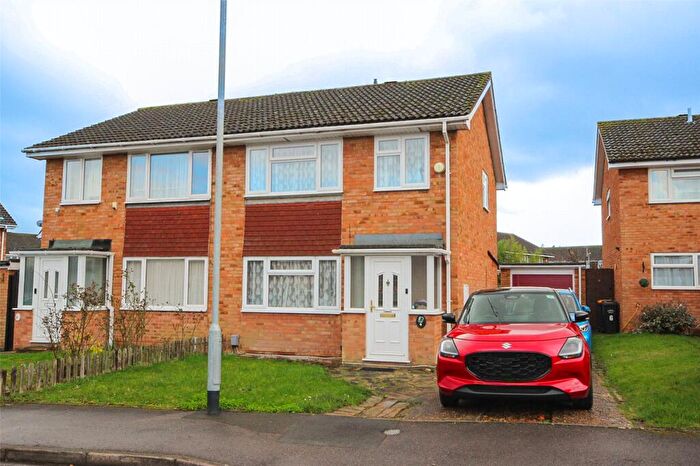
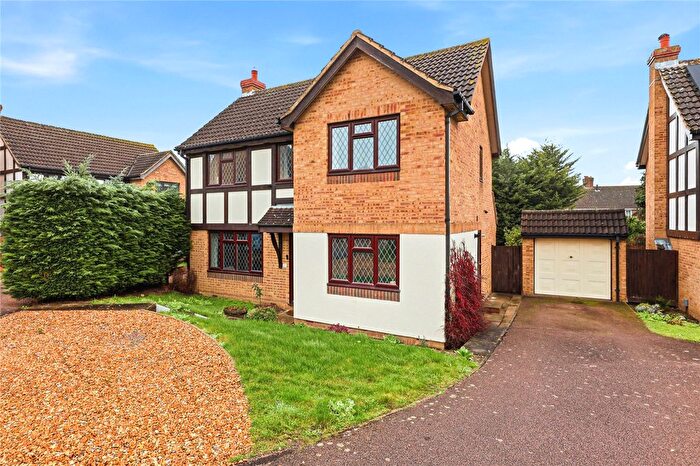
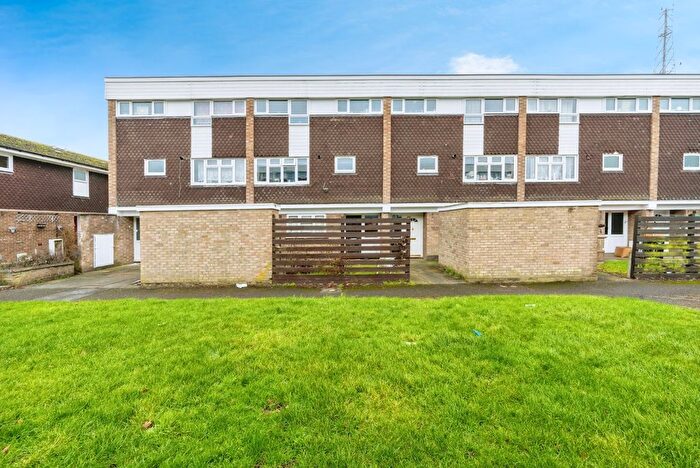
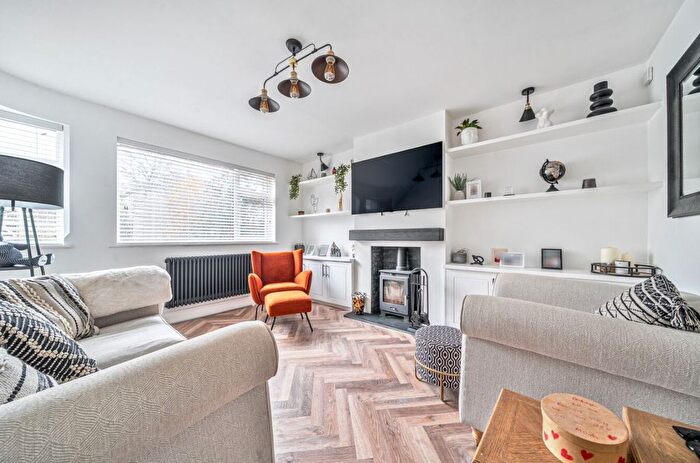
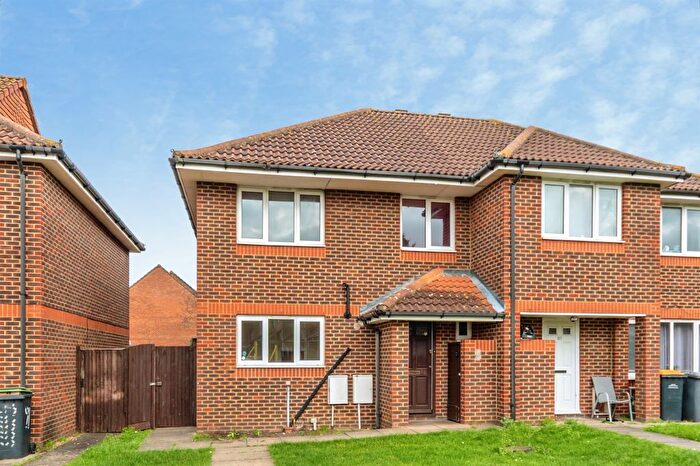
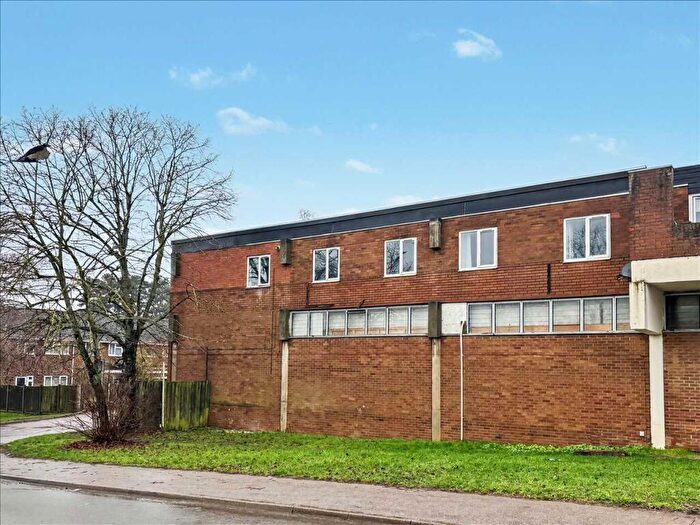
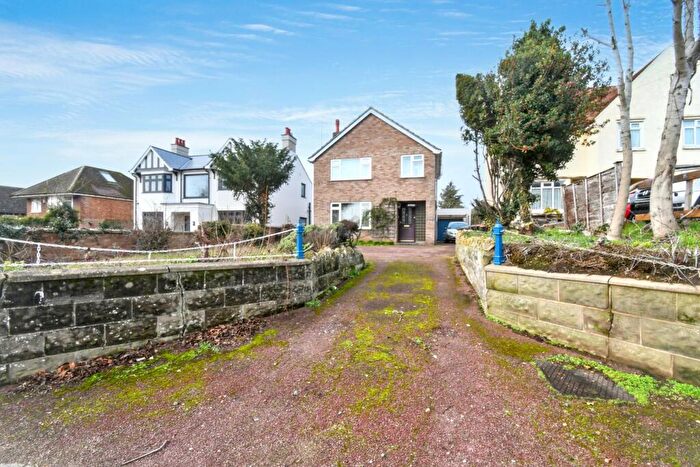
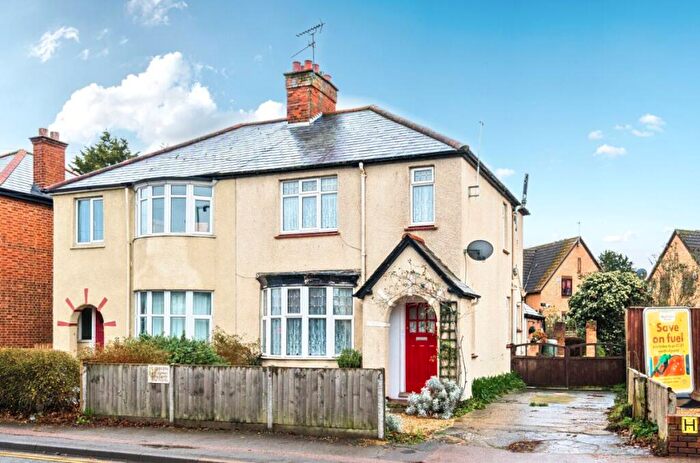
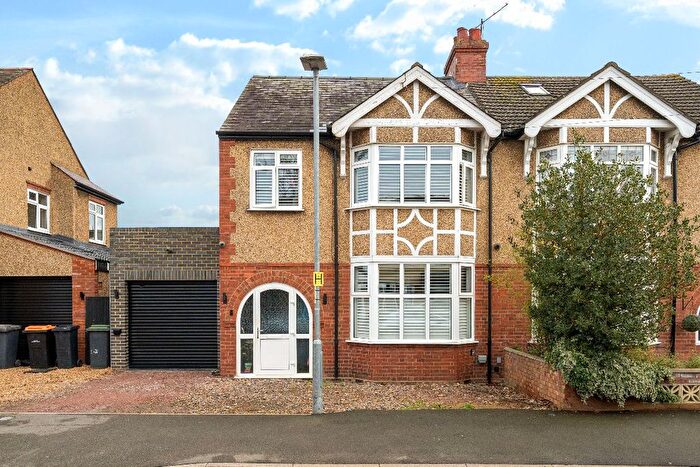
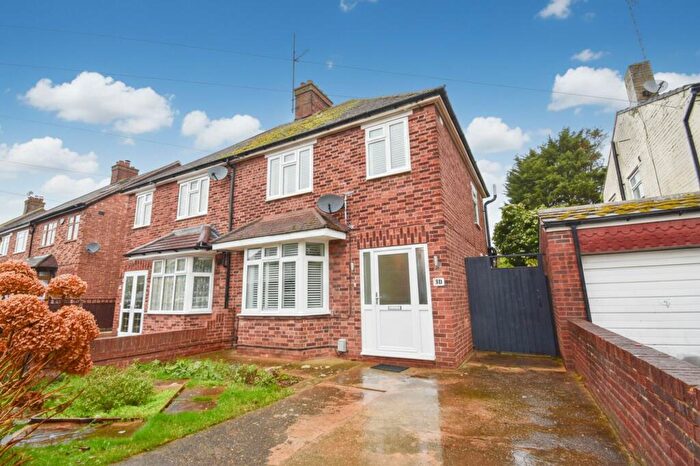
Properties for sale in Kempston South
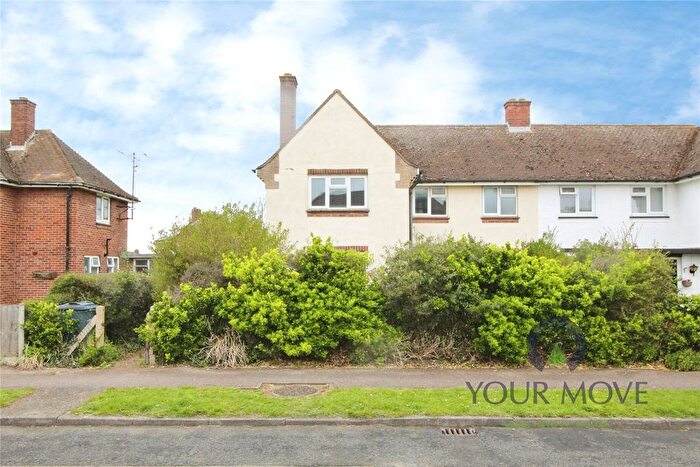
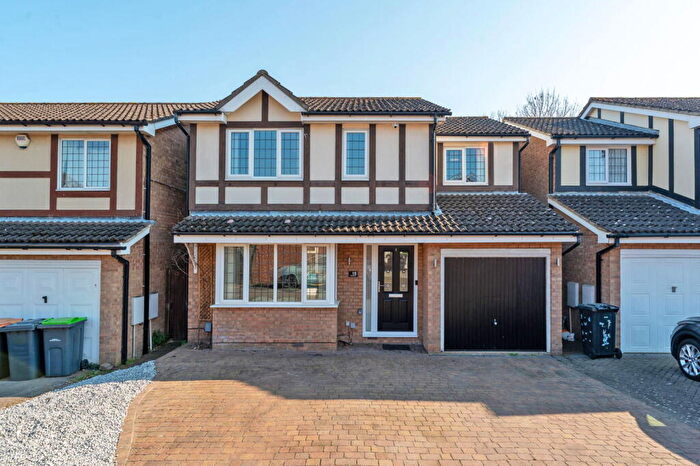

![]()
If you are looking to sell your house, let it out, or receive a property valuation, an expert can help you.
Click the button below to get started.

Roads and Postcodes in Kempston South
Navigate through our locations to find the location of your next house in Kempston South, Bedford for sale or to rent.
Transport near Kempston South

- FAQ
- Price Paid By Year
- Property Type Price
Frequently asked questions about Kempston South
What is the average price for a property for sale in Kempston South?
The average price for a property for sale in Kempston South is £294,719. This amount is 21% lower than the average price in Bedford. There are 948 property listings for sale in Kempston South.
What streets have the most expensive properties for sale in Kempston South?
The streets with the most expensive properties for sale in Kempston South are Harrier Way at an average of £421,250, Osprey Close at an average of £402,500 and Naylor Avenue at an average of £391,250.
What streets have the most affordable properties for sale in Kempston South?
The streets with the most affordable properties for sale in Kempston South are Juniper Walk at an average of £226,000, Woburn Road at an average of £240,000 and Magnolia Close at an average of £240,250.
Which train stations are available in or near Kempston South?
Some of the train stations available in or near Kempston South are Kempston Hardwick, Bedford St.Johns and Bedford Midland.
Property Price Paid in Kempston South by Year
The average sold property price by year was:
| Year | Average Sold Price | Price Change |
Sold Properties
|
|---|---|---|---|
| 2026 | £365,000 | 13% |
1 Property |
| 2025 | £316,234 | 6% |
49 Properties |
| 2024 | £295,976 | 10% |
55 Properties |
| 2023 | £266,297 | -3% |
42 Properties |
| 2022 | £273,766 | 6% |
46 Properties |
| 2021 | £257,480 | 6% |
76 Properties |
| 2020 | £240,908 | -2% |
55 Properties |
| 2019 | £246,016 | 4% |
54 Properties |
| 2018 | £236,651 | -1% |
73 Properties |
| 2017 | £239,882 | 10% |
62 Properties |
| 2016 | £215,990 | 11% |
64 Properties |
| 2015 | £192,028 | 10% |
52 Properties |
| 2014 | £173,029 | 10% |
70 Properties |
| 2013 | £154,995 | 5% |
66 Properties |
| 2012 | £147,022 | -8% |
44 Properties |
| 2011 | £158,142 | 6% |
54 Properties |
| 2010 | £149,404 | 5% |
45 Properties |
| 2009 | £141,946 | -11% |
49 Properties |
| 2008 | £158,107 | -8% |
49 Properties |
| 2007 | £170,137 | 11% |
92 Properties |
| 2006 | £151,443 | -1% |
80 Properties |
| 2005 | £153,105 | 8% |
99 Properties |
| 2004 | £141,179 | 10% |
105 Properties |
| 2003 | £127,079 | 16% |
85 Properties |
| 2002 | £106,760 | 16% |
110 Properties |
| 2001 | £89,820 | 17% |
106 Properties |
| 2000 | £74,958 | 8% |
98 Properties |
| 1999 | £68,964 | 11% |
126 Properties |
| 1998 | £61,406 | 7% |
88 Properties |
| 1997 | £57,253 | 8% |
109 Properties |
| 1996 | £52,827 | 1% |
89 Properties |
| 1995 | £52,082 | - |
86 Properties |
Property Price per Property Type in Kempston South
Here you can find historic sold price data in order to help with your property search.
The average Property Paid Price for specific property types in the last three years are:
| Property Type | Average Sold Price | Sold Properties |
|---|---|---|
| Semi Detached House | £298,095.00 | 70 Semi Detached Houses |
| Detached House | £347,484.00 | 32 Detached Houses |
| Terraced House | £255,079.00 | 44 Terraced Houses |
| Flat | £114,000.00 | 1 Flat |