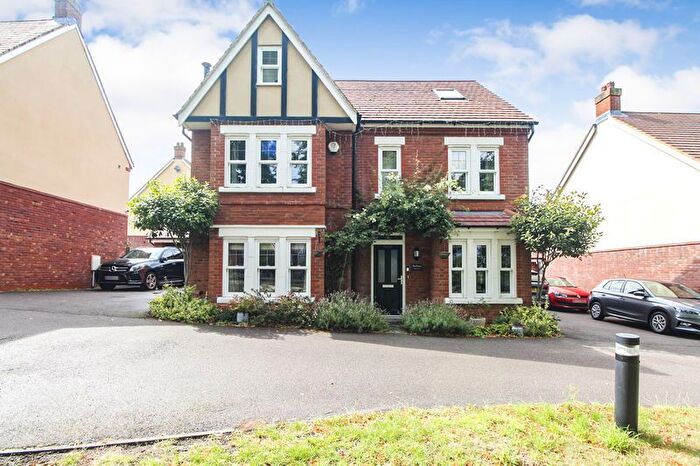
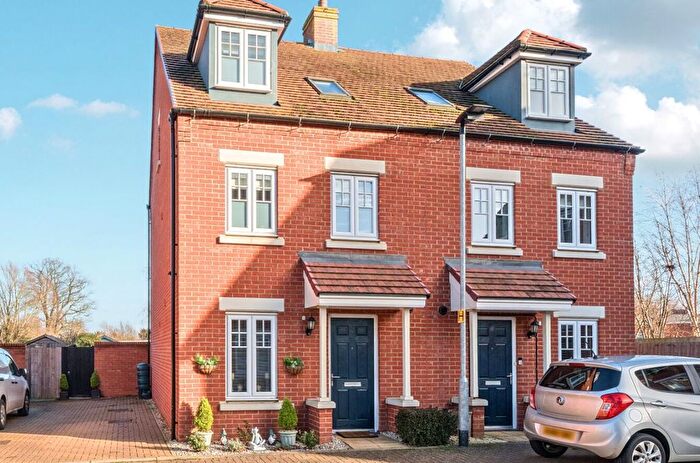
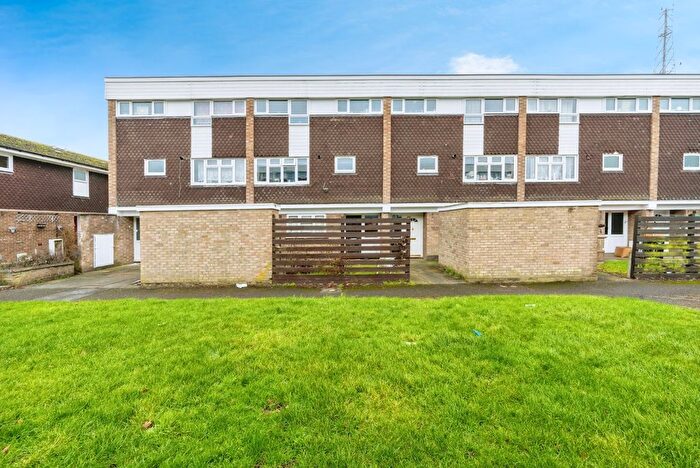
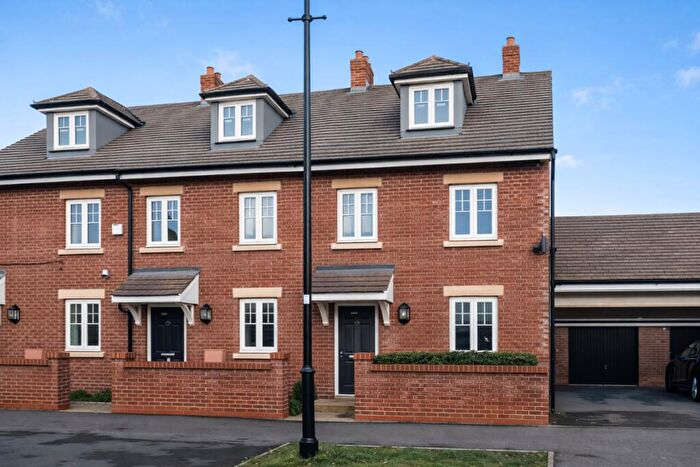
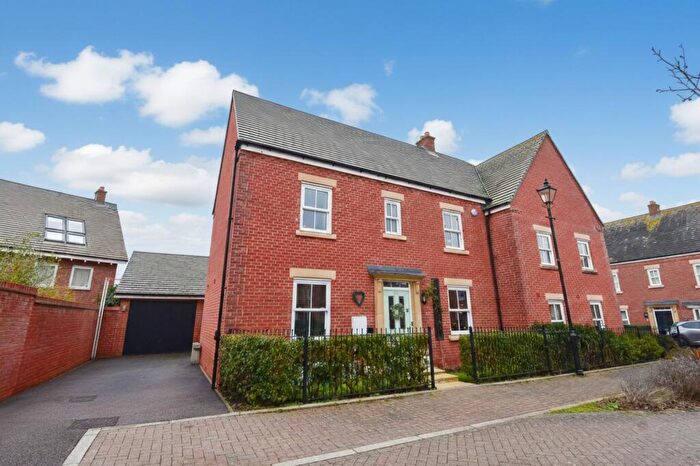
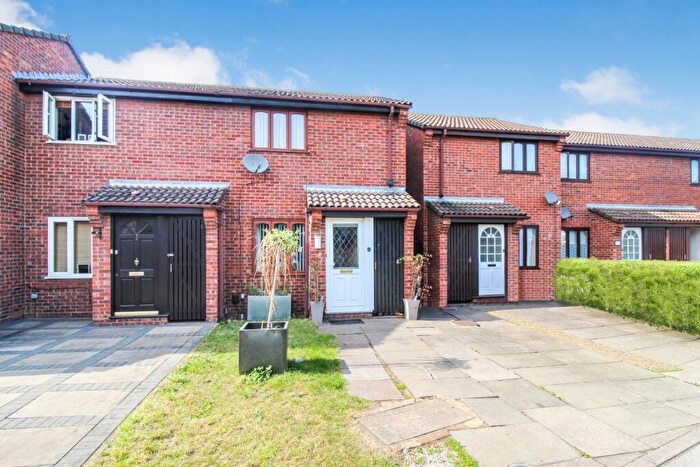
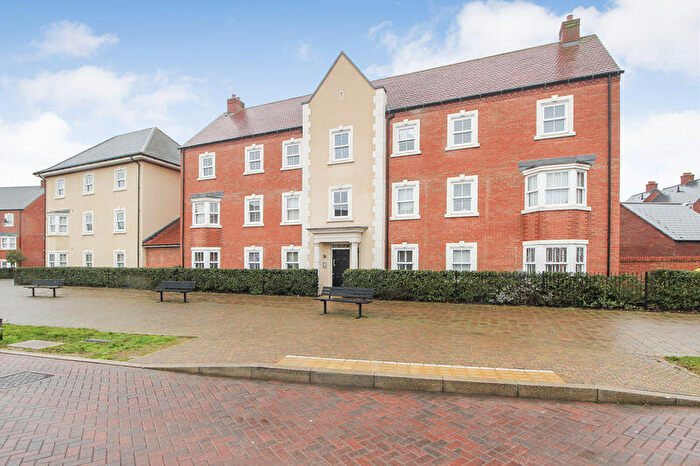
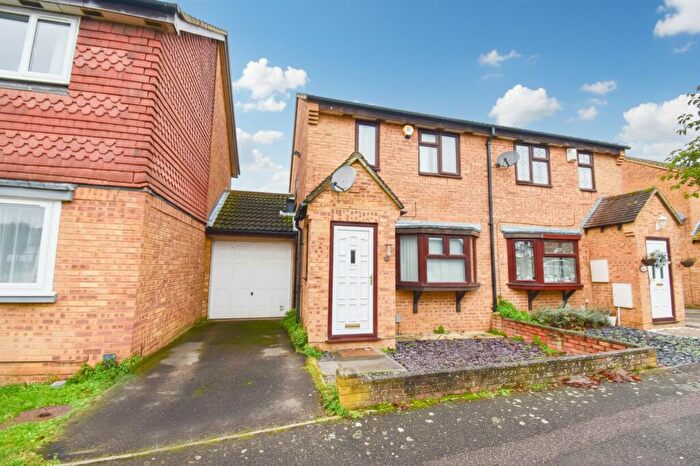
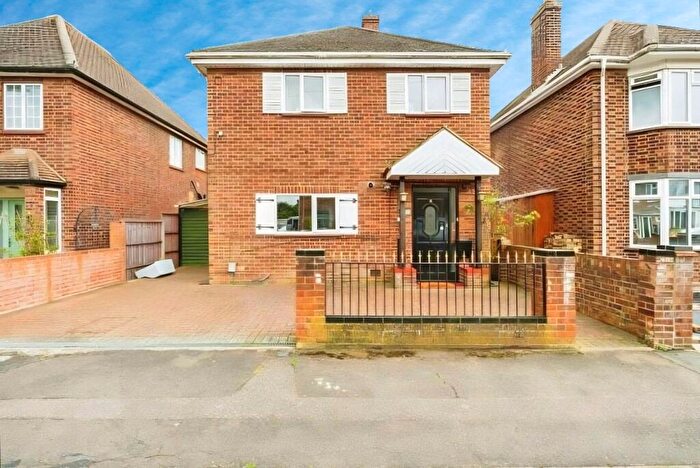
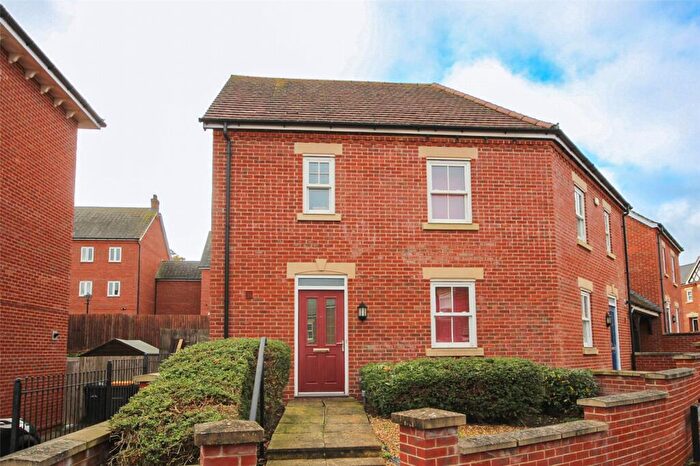
Houses for sale & to rent in Kempston West, Bedford
House Prices in Kempston West
Properties in Kempston West have an average house price of £294,178.00 and had 171 Property Transactions within the last 3 years¹.
Kempston West is an area in Bedford, Bedfordshire with 1,544 households², where the most expensive property was sold for £740,000.00.
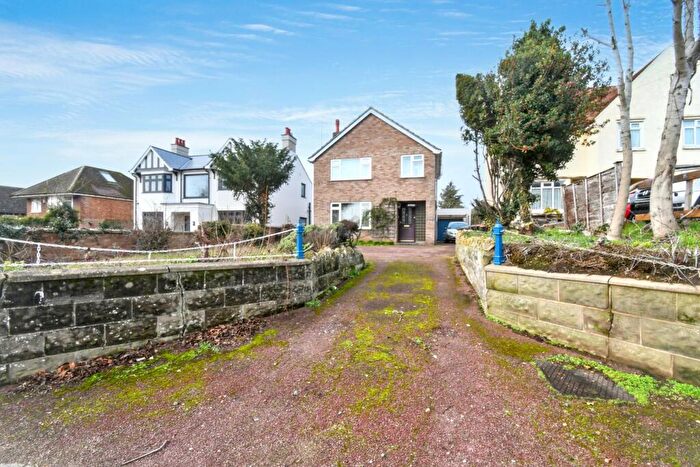
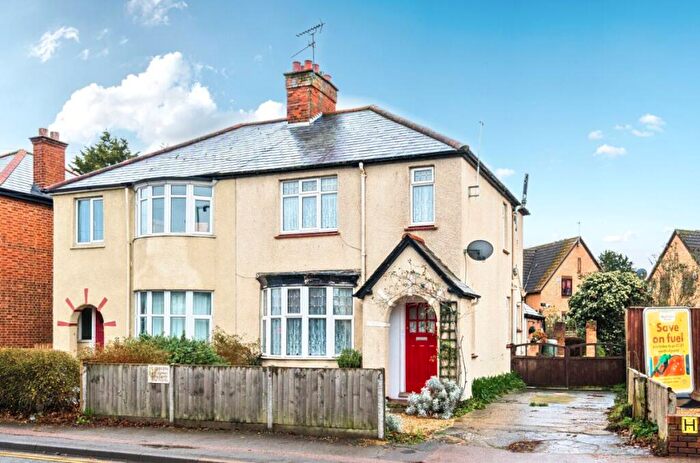
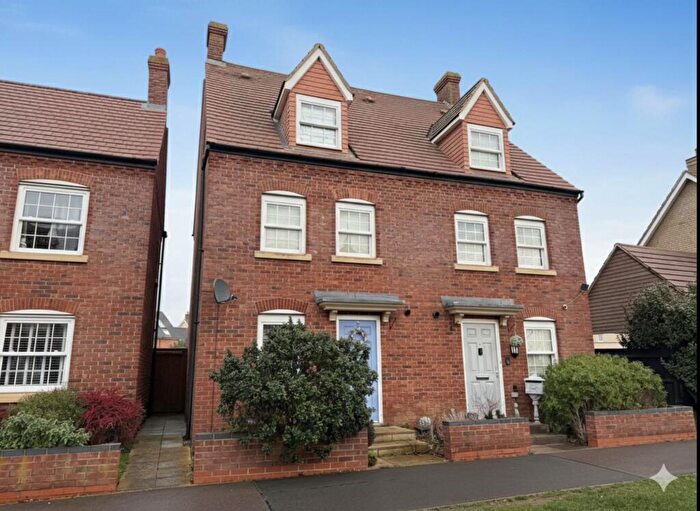
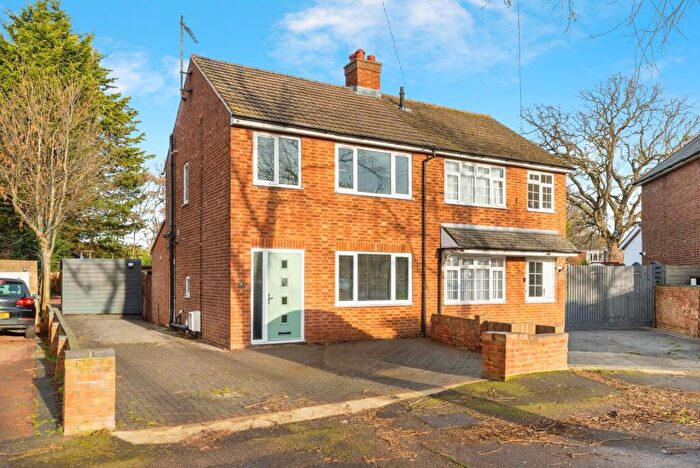
Properties for sale in Kempston West
Roads and Postcodes in Kempston West
Navigate through our locations to find the location of your next house in Kempston West, Bedford for sale or to rent.
| Streets | Postcodes |
|---|---|
| Abbott Crescent | MK42 7QH MK42 7QJ |
| Balliol Road | MK42 7EP MK42 7ER MK42 7ES MK42 7ET MK42 7HX |
| Barnard Avenue | MK42 7DE |
| Bartrum Close | MK42 7FA |
| Basen Close | MK42 7FG |
| Brook Drive | MK42 7DB |
| Bruce Road | MK42 7EU |
| Burr Close | MK42 7FF |
| Campbell Close | MK42 7EJ |
| Carnell Close | MK42 7HP |
| Cemetery Road | MK43 8RA MK43 8RB MK43 8RD |
| Chibnall Close | MK42 7FL |
| Church Walk | MK42 7BH MK42 7BL |
| Countess Gardens | MK42 7EG |
| Crowsley Road | MK42 7FN |
| Cryselco Close | MK42 7TJ |
| Deacon Avenue | MK42 7DT MK42 7DU |
| Dennis Road | MK42 7HF MK42 7HG |
| Diemer Croft | MK42 7LY |
| Ditmas Avenue | MK42 7DP MK42 7DR MK42 7DW |
| Drayton Road | MK42 7HD |
| Durler Avenue | MK42 7DG MK42 7DH |
| Eugster Avenue | MK42 7DF MK42 7DS |
| Galloway Close | MK42 7DX |
| Greenview Close | MK42 7BG |
| Guilas Close | MK42 7BF |
| Harter Road | MK42 7EY |
| Hastings Road | MK42 7EZ MK42 7HT |
| Haylock Close | MK42 7HN |
| Hebbes Close | MK42 7FQ |
| Henman Close | MK42 7FH |
| High Street | MK42 7AH MK42 7AL MK42 7AR MK42 7BN MK42 7BP MK42 7BS MK42 7BT MK42 7BX MK42 7AJ |
| Hill Rise | MK42 7DJ MK42 7DN MK42 7EB |
| Hooper Close | MK42 7HS |
| Huntingdon Road | MK42 7EX |
| Judith Gardens | MK42 7EQ |
| Kendall Road | MK42 7DZ |
| King William Close | MK42 7BA |
| King William Road | MK42 7AS MK42 7AT MK42 7AU |
| Lewis Close | MK42 7FX |
| Lincoln Road | MK42 7HB MK42 7HE |
| Lodge Avenue | MK42 7DD |
| Manley Way | MK42 7FU |
| Manor Close | MK42 7AA |
| Manor Drive | MK42 7AB MK42 7AX |
| Martell Drive | MK42 7FJ |
| Meadow View Road | MK42 7BE |
| Mill Lane | MK42 7BD MK42 7FB MK42 7FD MK42 7FE |
| Molly Moore Avenue | MK42 7LG |
| Oliver Close | MK42 7FW |
| Orchard Drive | MK42 7PG |
| Owen Close | MK42 7EA |
| Ramsey Close | MK42 7HQ |
| Ridge Road | MK42 7DA MK42 7LZ |
| Riverview Way | MK42 7BB |
| The Dell | MK42 7DL |
| The Glen | MK42 7EL |
| The Hoo | MK42 7DQ |
| The Old Yard | MK42 7LW |
| Water Lane | MK42 7BJ |
| Wenlock Road | MK42 7DY |
| White Lodge Close | MK42 7ED |
| Wilkinson Road | MK42 7FR |
| Williamson Road | MK42 7HA MK42 7HH MK42 7HL MK42 7HR MK42 7HY MK42 7HJ |
| Woburn Road | MK42 7QR MK43 9AX |
| Wyatt Road | MK42 7EH MK42 7EN MK42 7EW |
Transport near Kempston West
- FAQ
- Price Paid By Year
- Property Type Price
Frequently asked questions about Kempston West
What is the average price for a property for sale in Kempston West?
The average price for a property for sale in Kempston West is £294,178. This amount is 21% lower than the average price in Bedford. There are 1,051 property listings for sale in Kempston West.
What streets have the most expensive properties for sale in Kempston West?
The streets with the most expensive properties for sale in Kempston West are Eugster Avenue at an average of £565,000, Manley Way at an average of £475,333 and King William Close at an average of £460,000.
What streets have the most affordable properties for sale in Kempston West?
The streets with the most affordable properties for sale in Kempston West are Hastings Road at an average of £163,000, Ramsey Close at an average of £190,000 and High Street at an average of £193,390.
Which train stations are available in or near Kempston West?
Some of the train stations available in or near Kempston West are Kempston Hardwick, Bedford Midland and Bedford St.Johns.
Property Price Paid in Kempston West by Year
The average sold property price by year was:
| Year | Average Sold Price | Price Change |
Sold Properties
|
|---|---|---|---|
| 2025 | £300,677 | 8% |
48 Properties |
| 2024 | £275,841 | -11% |
60 Properties |
| 2023 | £306,690 | 7% |
63 Properties |
| 2022 | £286,721 | 5% |
79 Properties |
| 2021 | £271,598 | 6% |
110 Properties |
| 2020 | £254,970 | 2% |
65 Properties |
| 2019 | £249,669 | -8% |
67 Properties |
| 2018 | £270,387 | 12% |
90 Properties |
| 2017 | £237,426 | 0,5% |
110 Properties |
| 2016 | £236,325 | -3% |
101 Properties |
| 2015 | £243,188 | 6% |
90 Properties |
| 2014 | £228,553 | 14% |
105 Properties |
| 2013 | £196,996 | -4% |
141 Properties |
| 2012 | £205,167 | 15% |
132 Properties |
| 2011 | £175,307 | -10% |
79 Properties |
| 2010 | £191,990 | 20% |
63 Properties |
| 2009 | £153,177 | -7% |
40 Properties |
| 2008 | £163,842 | -15% |
28 Properties |
| 2007 | £187,863 | 8% |
64 Properties |
| 2006 | £173,251 | 11% |
70 Properties |
| 2005 | £153,885 | 5% |
64 Properties |
| 2004 | £146,589 | 6% |
61 Properties |
| 2003 | £137,715 | 20% |
50 Properties |
| 2002 | £109,672 | 16% |
68 Properties |
| 2001 | £92,134 | 10% |
70 Properties |
| 2000 | £82,578 | 16% |
61 Properties |
| 1999 | £68,988 | 7% |
61 Properties |
| 1998 | £63,857 | 6% |
54 Properties |
| 1997 | £59,940 | 23% |
69 Properties |
| 1996 | £46,427 | -13% |
55 Properties |
| 1995 | £52,669 | - |
50 Properties |
Property Price per Property Type in Kempston West
Here you can find historic sold price data in order to help with your property search.
The average Property Paid Price for specific property types in the last three years are:
| Property Type | Average Sold Price | Sold Properties |
|---|---|---|
| Semi Detached House | £327,437.00 | 56 Semi Detached Houses |
| Detached House | £473,562.00 | 24 Detached Houses |
| Terraced House | £273,317.00 | 41 Terraced Houses |
| Flat | £187,930.00 | 50 Flats |

