
Houses for sale & to rent in B44 0HQ, THE MEWS, Kingstanding, Birmingham
House Prices in B44 0HQ, THE MEWS, Kingstanding
Properties in B44 0HQ have no sales history available within the last 3 years. B44 0HQ is a postcode in THE MEWS located in Kingstanding, an area in Birmingham, Birmingham, with 1 household².
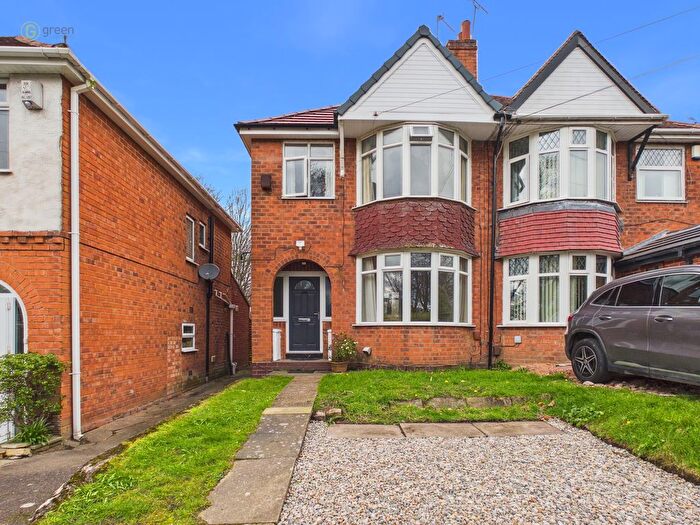
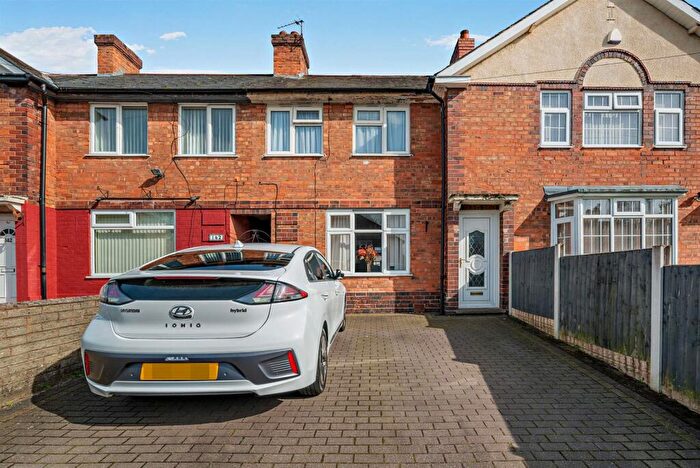
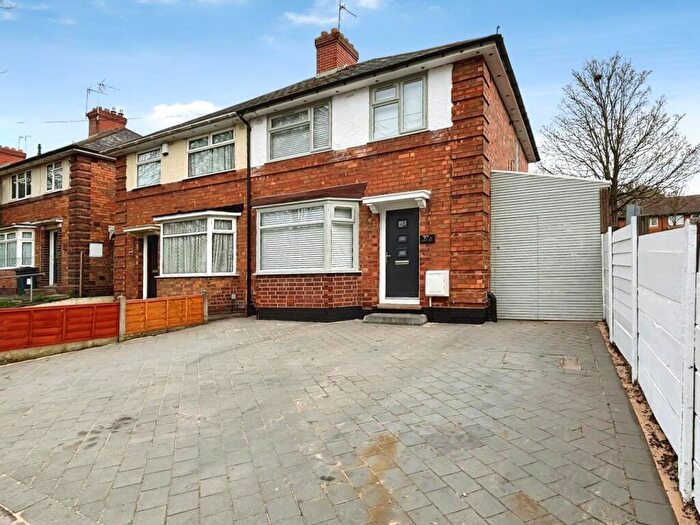
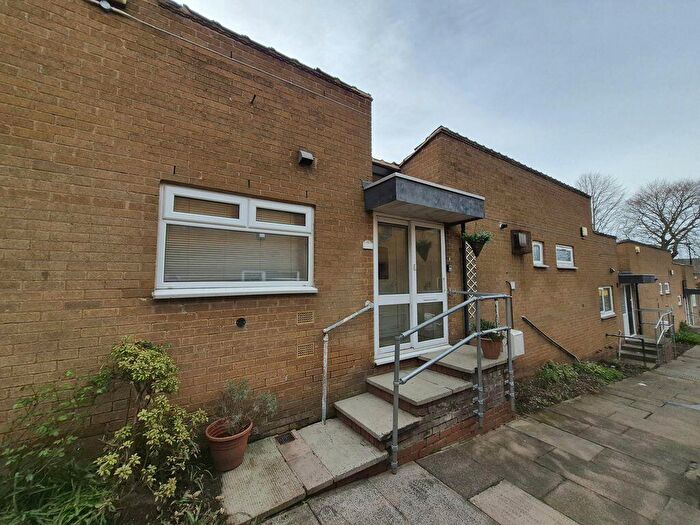
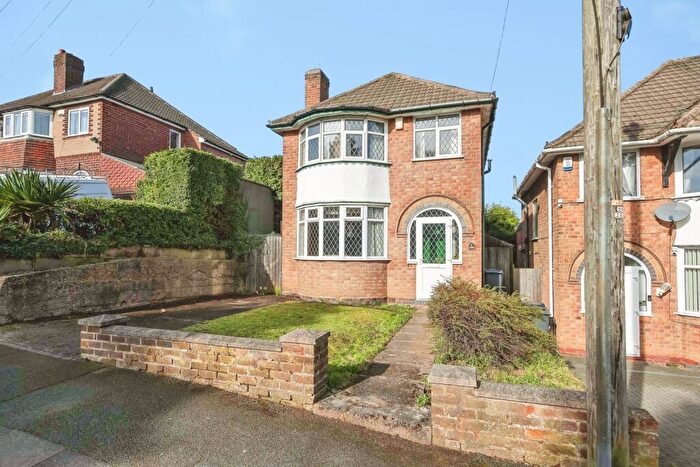
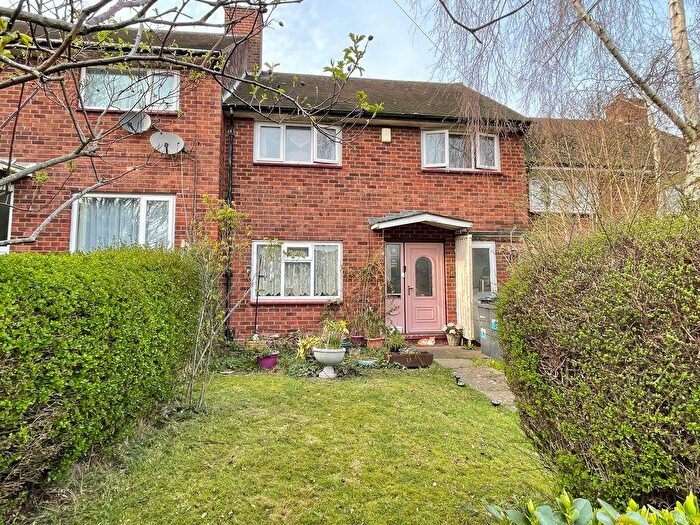
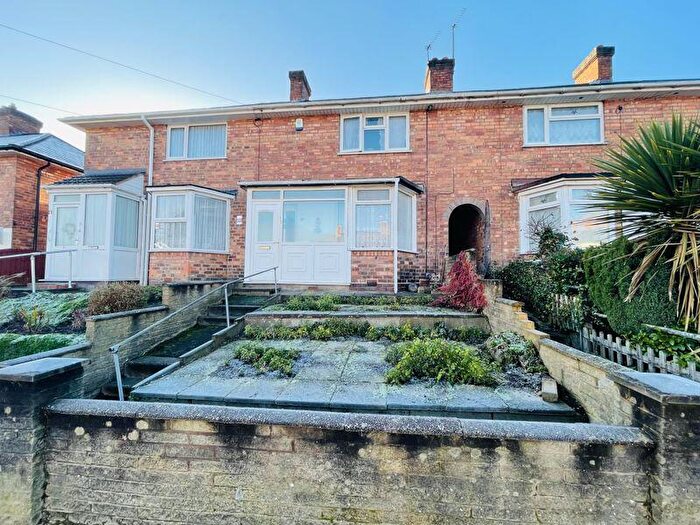
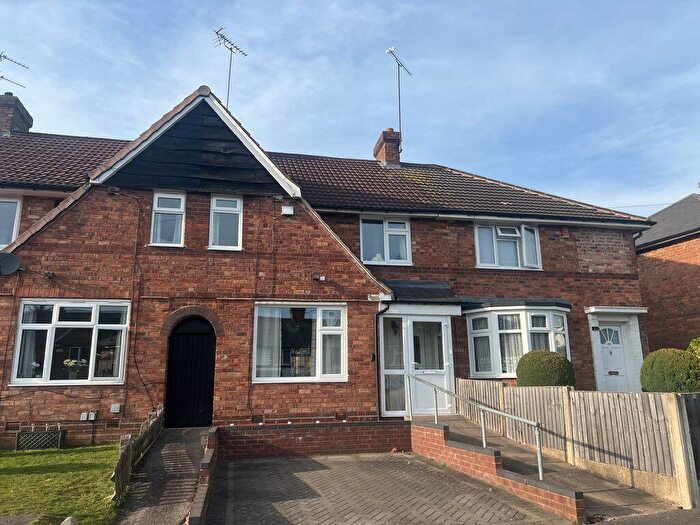
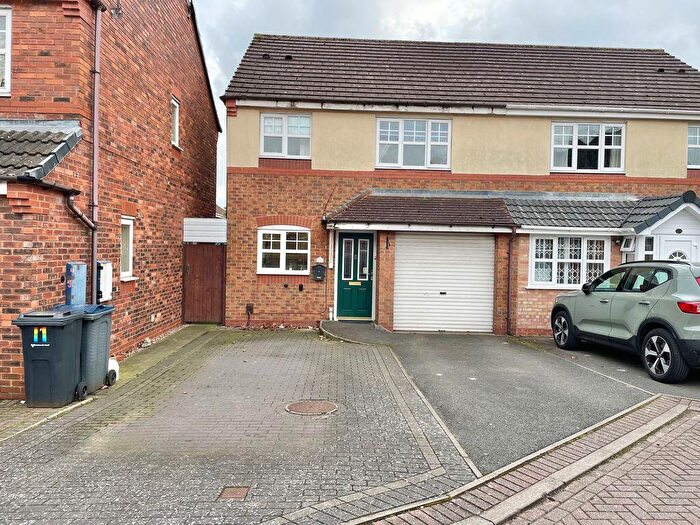
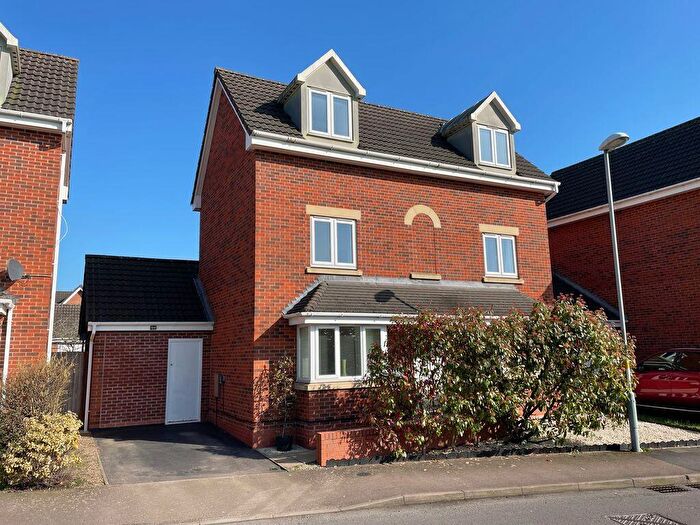
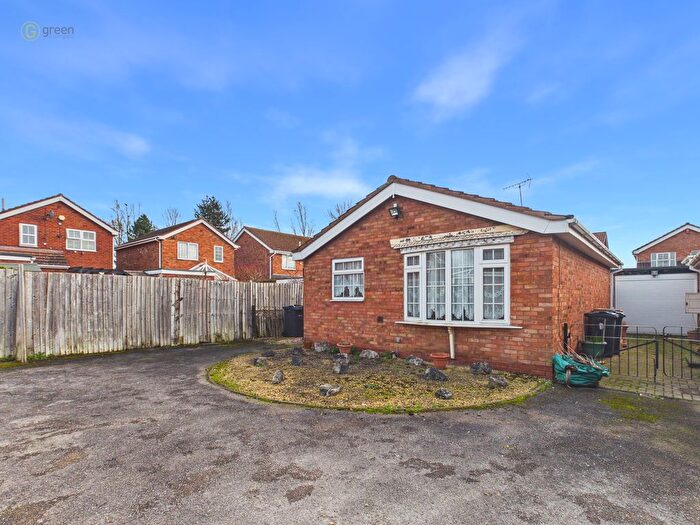
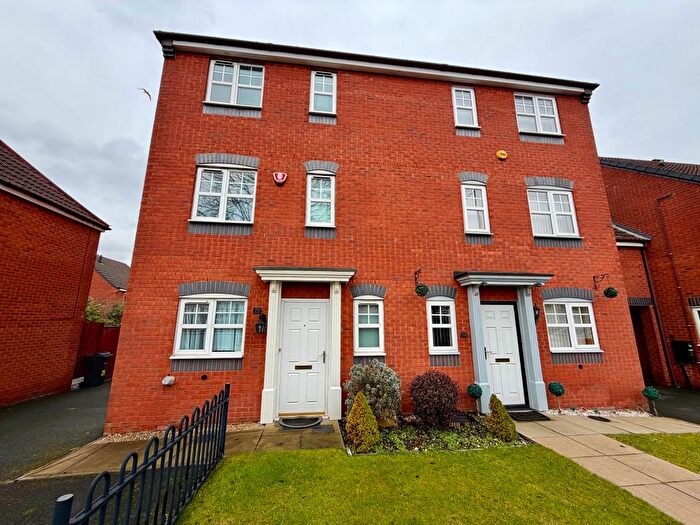
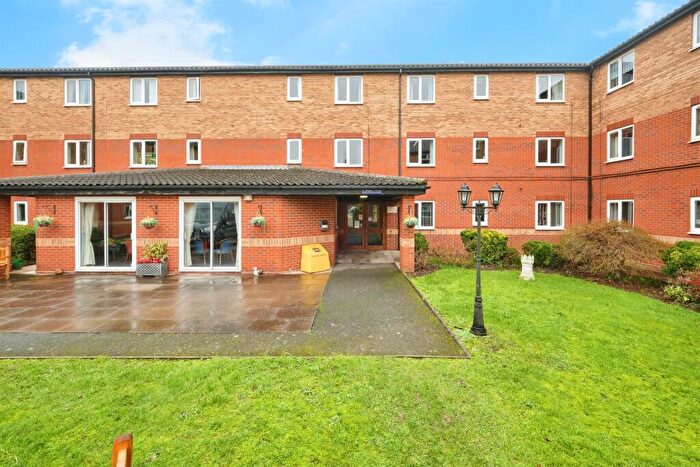
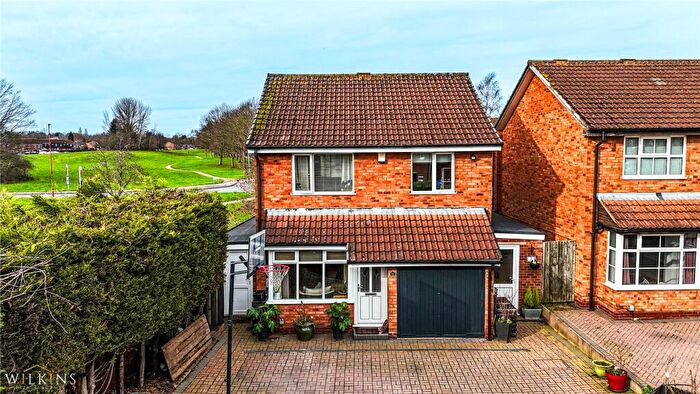
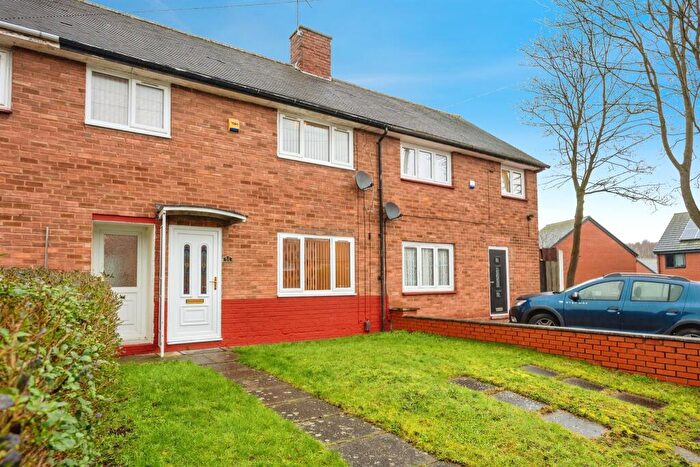
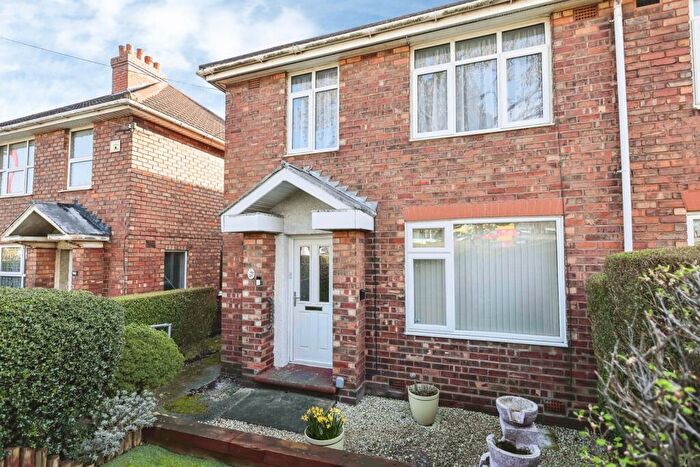
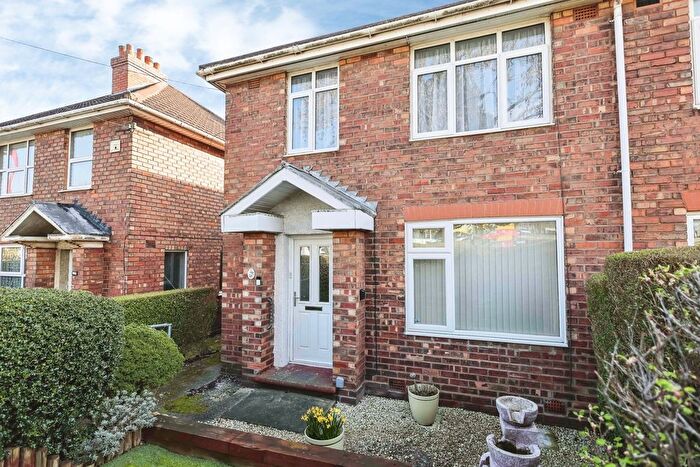
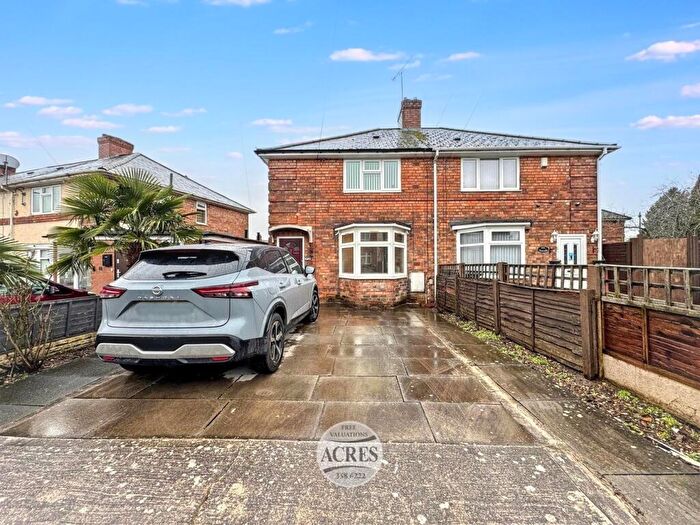
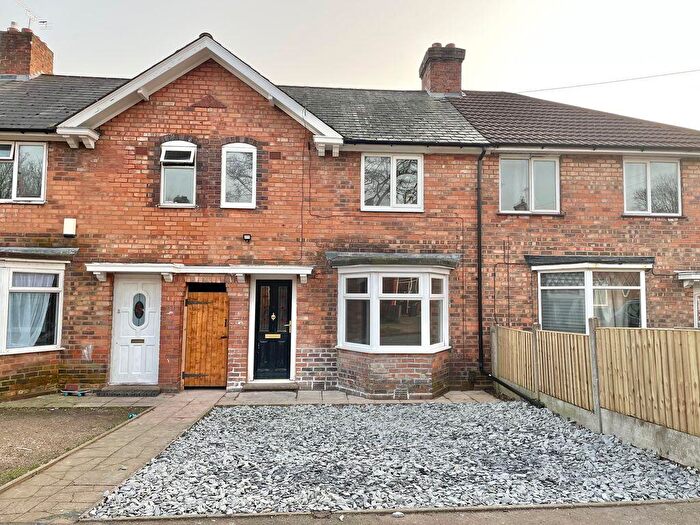
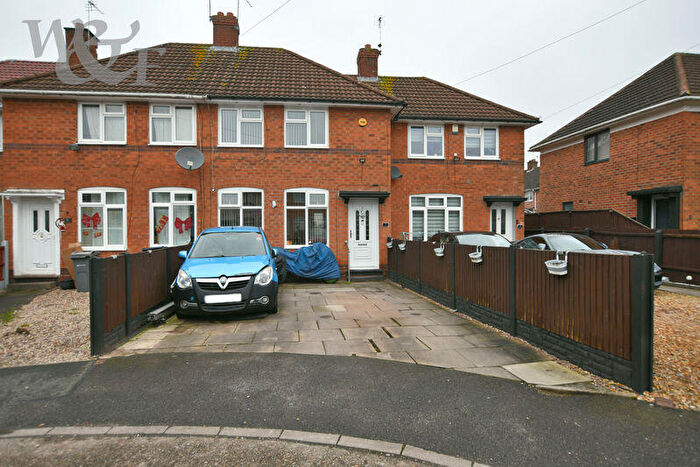
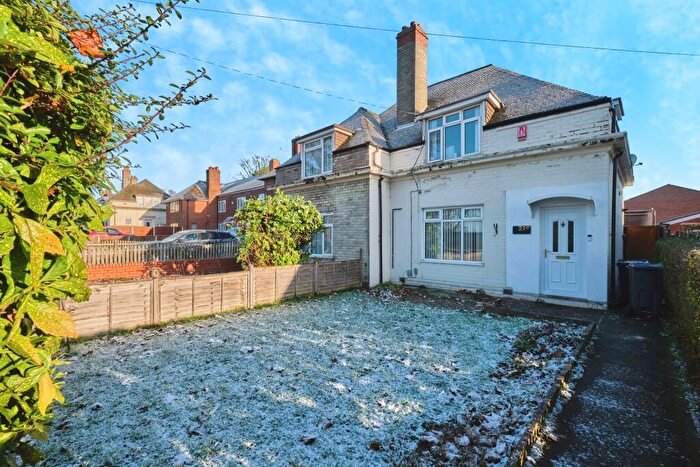
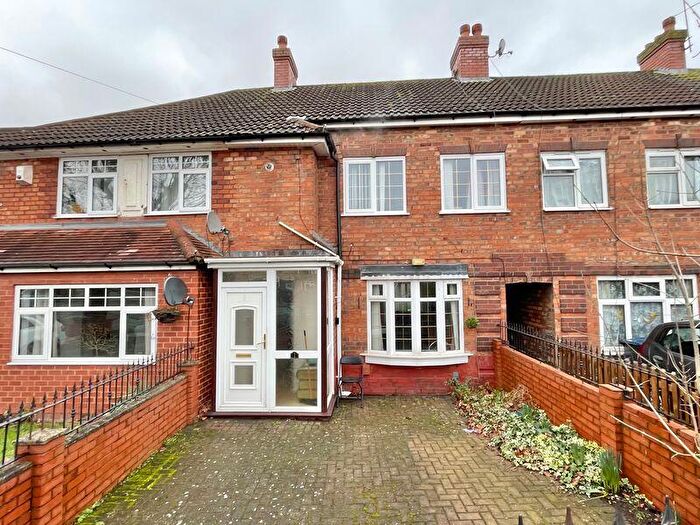
Properties for sale near B44 0HQ, THE MEWS
![]()
If you are looking to sell your house, let it out, or receive a property valuation, an expert can help you.
Click the button below to get started.


Price Paid in THE MEWS, B44 0HQ, Kingstanding
2 THE MEWS, B44 0HQ, Kingstanding Birmingham
Property 2 has been sold 5 times. The last time it was sold was in 09/11/2018 and the sold price was £115,000.00.
This terraced house, sold as a freehold on 09/11/2018, is a 63 sqm mid-terrace house with an EPC rating of D.
| Date | Price | Property Type | Tenure | Classification |
|---|---|---|---|---|
| 09/11/2018 | £115,000.00 | Terraced House | freehold | Established Building |
| 01/11/2016 | £110,000.00 | Terraced House | freehold | Established Building |
| 12/09/2014 | £91,000.00 | Terraced House | freehold | Established Building |
| 31/10/2003 | £97,000.00 | Terraced House | freehold | Established Building |
| 31/05/2002 | £63,950.00 | Terraced House | freehold | Established Building |
3 THE MEWS, B44 0HQ, Kingstanding Birmingham
Property 3 has been sold 2 times. The last time it was sold was in 27/09/2002 and the sold price was £32,500.00.
This is a Terraced House which was sold as a leasehold in 27/09/2002
| Date | Price | Property Type | Tenure | Classification |
|---|---|---|---|---|
| 27/09/2002 | £32,500.00 | Terraced House | leasehold | Established Building |
| 06/12/1996 | £23,000.00 | Terraced House | leasehold | Established Building |
Transport near B44 0HQ, THE MEWS
-
 Erdington Station
 -
Chester Road Station
-
Wylde Green Station
-
Gravelly Hill Station
-
Witton Station
-
Perry Barr Station
-
Aston Station
-
Hamstead Station
-
Sutton Coldfield Station
House price paid reports for B44 0HQ, THE MEWS
Click on the buttons below to see price paid reports by year or property price:
- Price Paid By Year
Property Price Paid in B44 0HQ, THE MEWS by Year
The average sold property price by year was:
| Year | Average Sold Price | Price Change |
Sold Properties
|
|---|---|---|---|
| 2018 | £115,000 | 4% |
1 Property |
| 2016 | £110,000 | 17% |
1 Property |
| 2014 | £91,000 | -7% |
1 Property |
| 2003 | £97,000 | 50% |
1 Property |
| 2002 | £48,225 | 52% |
2 Properties |
| 1996 | £23,000 | - |
1 Property |