
Houses for sale & to rent in B32 2ET, Balden Road, Quinton, Birmingham
House Prices in B32 2ET, Balden Road, Quinton
Properties in B32 2ET have no sales history available within the last 3 years. B32 2ET is a postcode in Balden Road located in Quinton, an area in Birmingham, Birmingham, with 3 households².
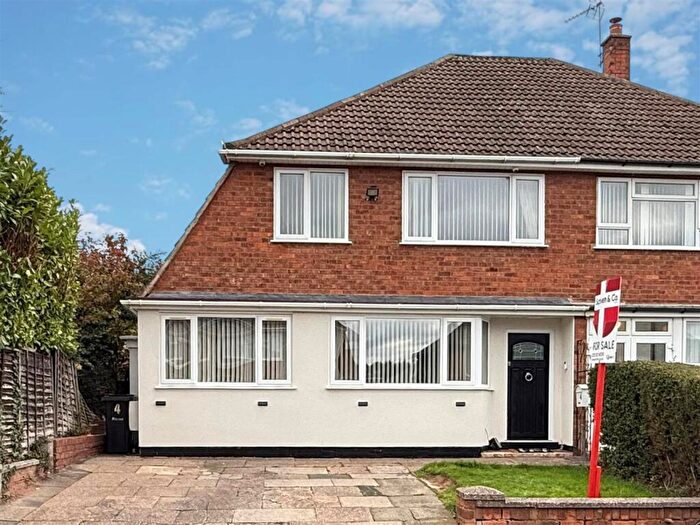
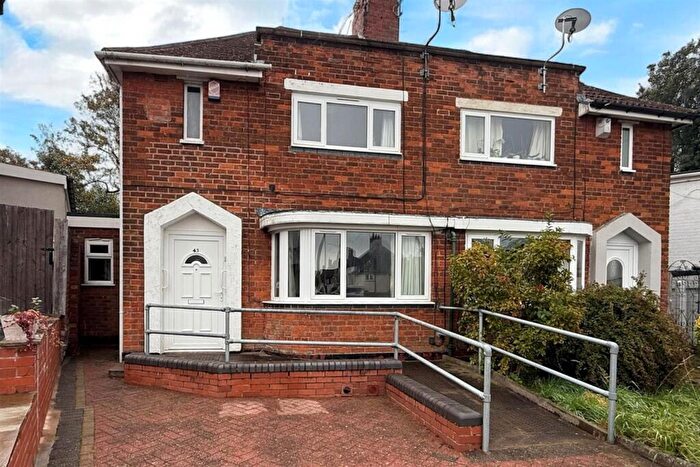
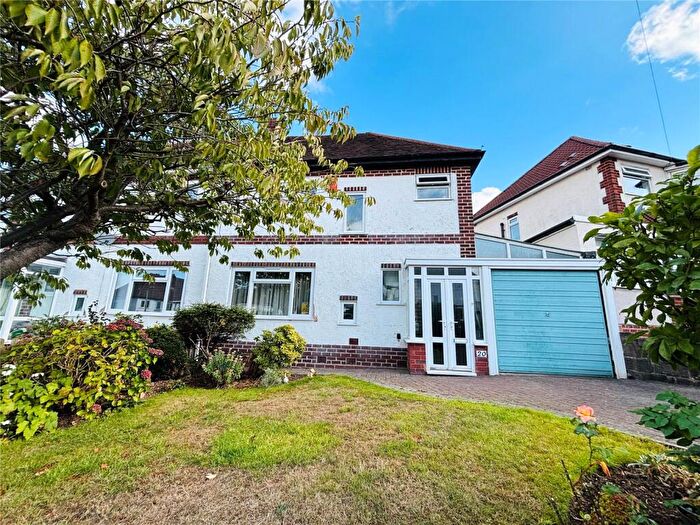
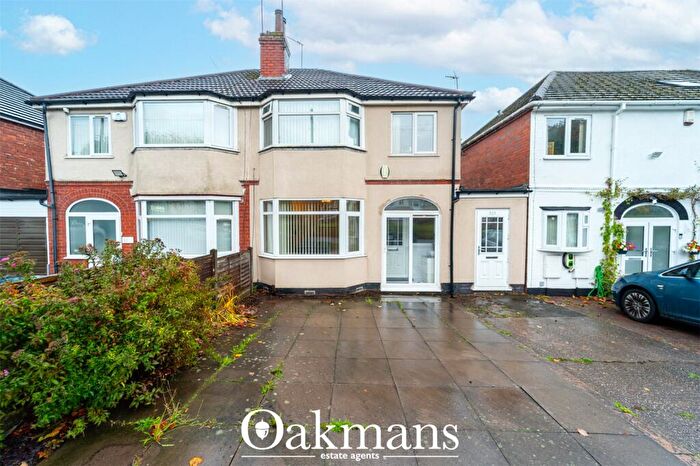
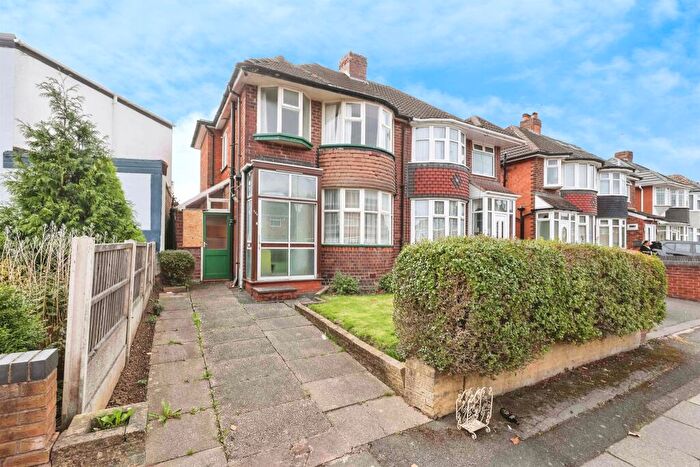
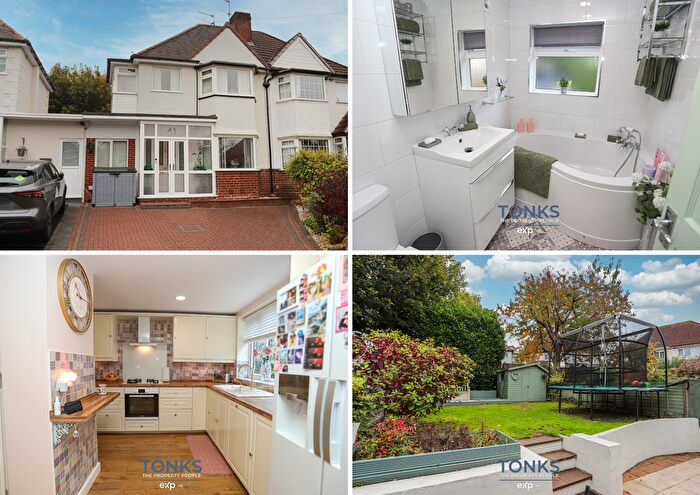
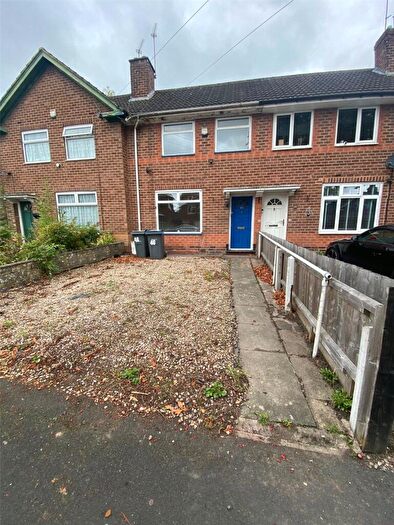
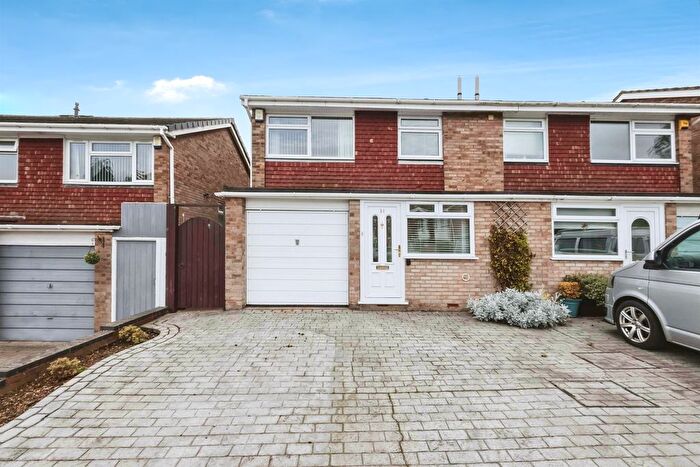
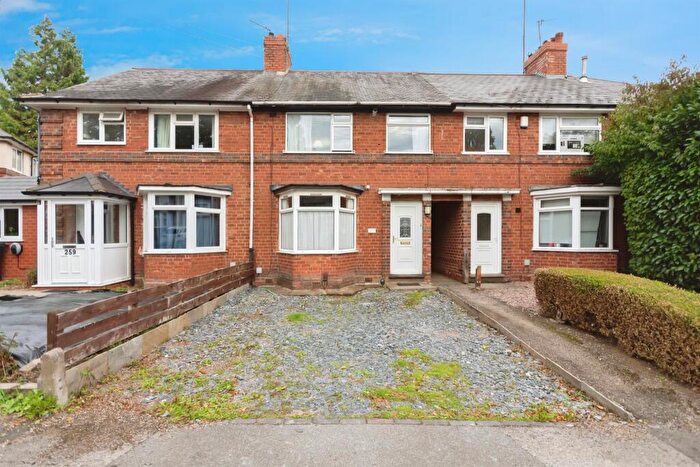
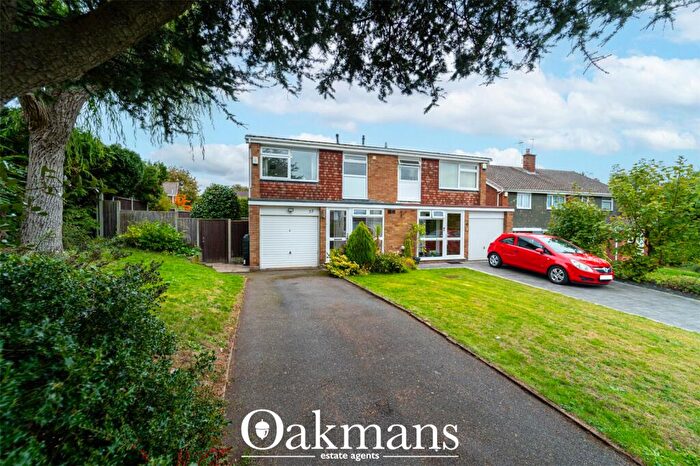
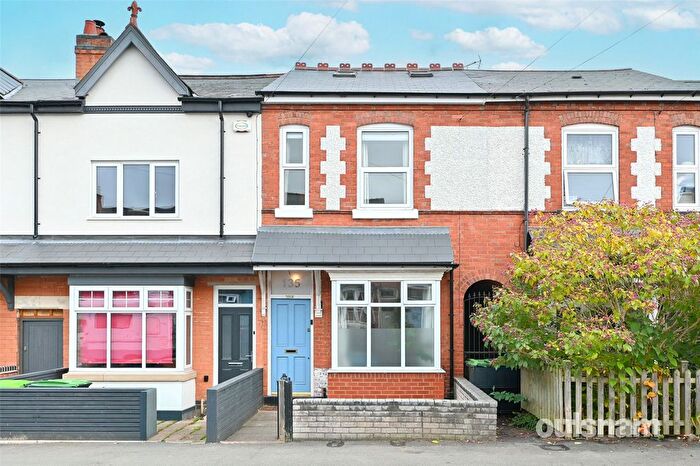
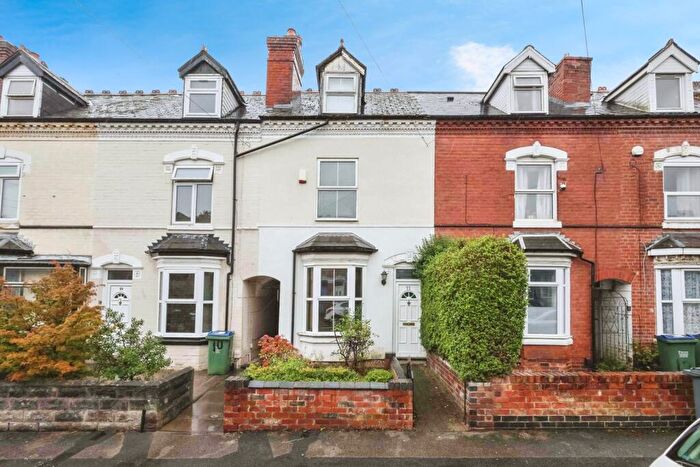
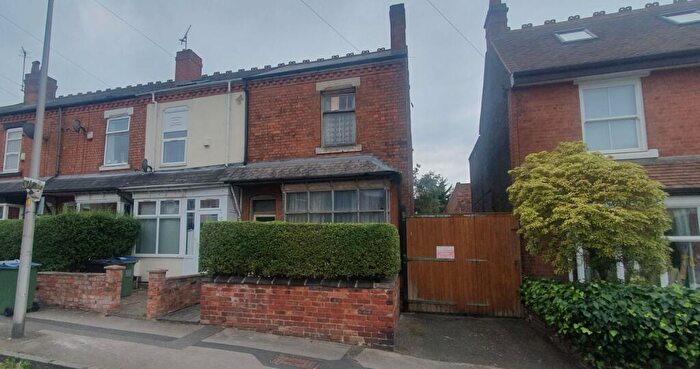
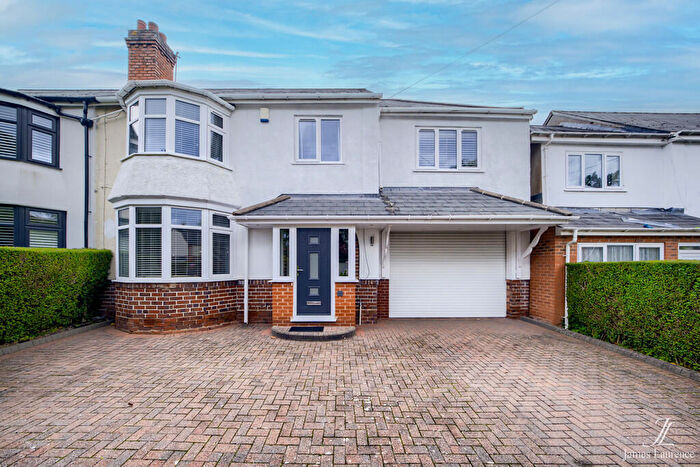
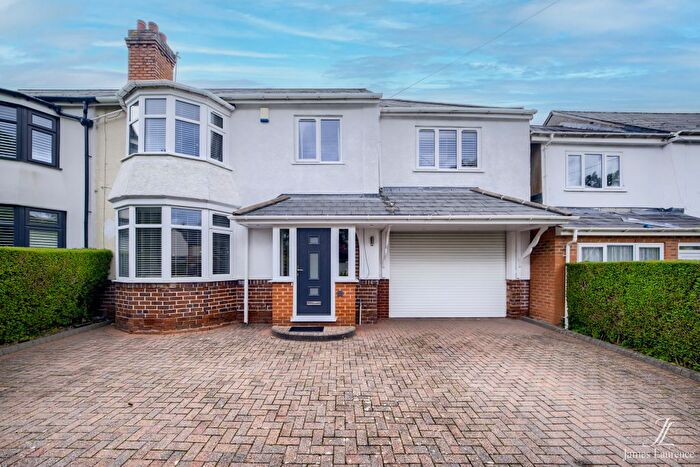
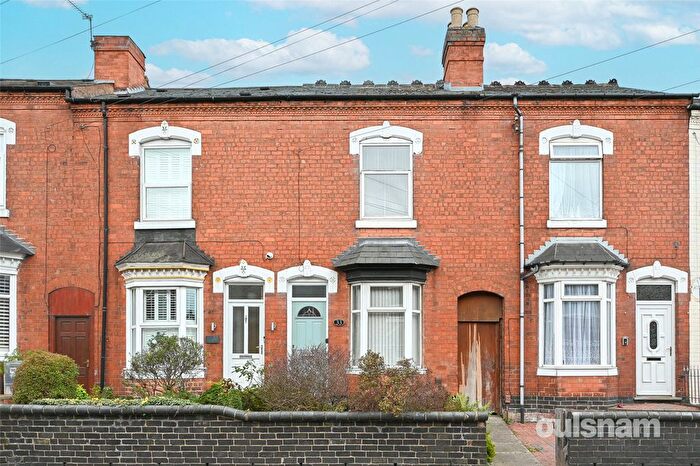
Properties for sale near B32 2ET, Balden Road
![]()
If you are looking to sell your house, let it out, or receive a property valuation, an expert can help you.
Click the button below to get started.


Price Paid in Balden Road, B32 2ET, Quinton
236 Balden Road, B32 2ET, Quinton Birmingham
Property 236 has been sold 3 times. The last time it was sold was in 11/07/2018 and the sold price was £250,000.00.
This terraced house, sold as a freehold on 11/07/2018, is a 91 sqm detached house with an EPC rating of C.
| Date | Price | Property Type | Tenure | Classification |
|---|---|---|---|---|
| 11/07/2018 | £250,000.00 | Terraced House | freehold | Established Building |
| 31/08/2004 | £210,000.00 | Terraced House | freehold | Established Building |
| 15/08/2001 | £54,500.00 | Terraced House | freehold | Established Building |
234 Balden Road, B32 2ET, Quinton Birmingham
Property 234 has been sold 1 time. The last time it was sold was in 12/10/2011 and the sold price was £145,000.00.
This semi detached house, sold as a freehold on 12/10/2011, is a 92 sqm semi-detached house with an EPC rating of D.
| Date | Price | Property Type | Tenure | Classification |
|---|---|---|---|---|
| 12/10/2011 | £145,000.00 | Semi Detached House | freehold | Established Building |
Postcodes in Balden Road, Quinton
Navigate through other locations in Balden Road, Quinton, Birmingham to see more property listings for sale or to rent.
Transport near B32 2ET, Balden Road
-
 University Station
 -
Smethwick Rolfe Street Station
-
Langley Green Station
-
Rowley Regis Station
-
Smethwick Galton Bridge Station
-
Selly Oak Station
-
The Hawthorns Station
-
Five Ways Station
House price paid reports for B32 2ET, Balden Road
Click on the buttons below to see price paid reports by year or property price:
- Price Paid By Year
Property Price Paid in B32 2ET, Balden Road by Year
The average sold property price by year was:
| Year | Average Sold Price | Price Change |
Sold Properties
|
|---|---|---|---|
| 2018 | £250,000 | 42% |
1 Property |
| 2011 | £145,000 | -45% |
1 Property |
| 2004 | £210,000 | 74% |
1 Property |
| 2001 | £54,500 | - |
1 Property |