
Houses for sale & to rent in Queensbury, Stanmore
House Prices in Queensbury
Properties in this part of Queensbury within Stanmore have no sales history available within the last 3 years. The most expensive property was sold for £0.
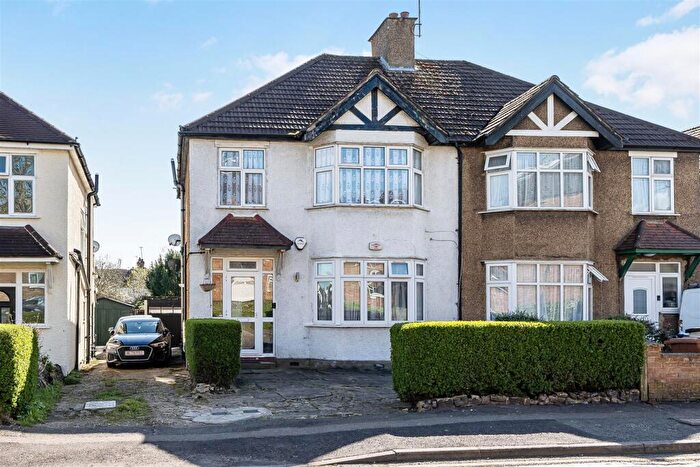
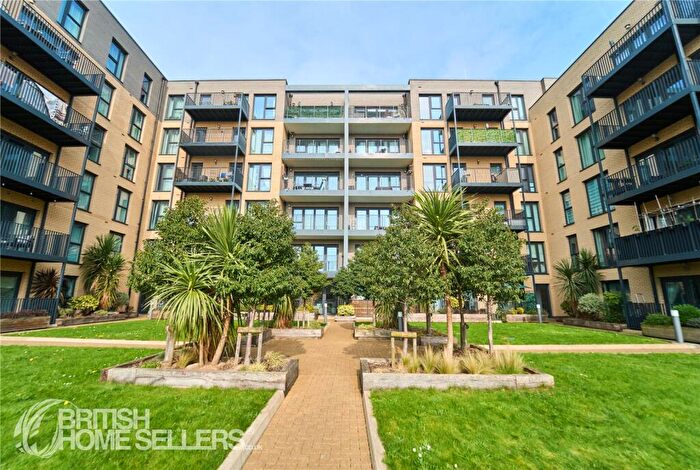
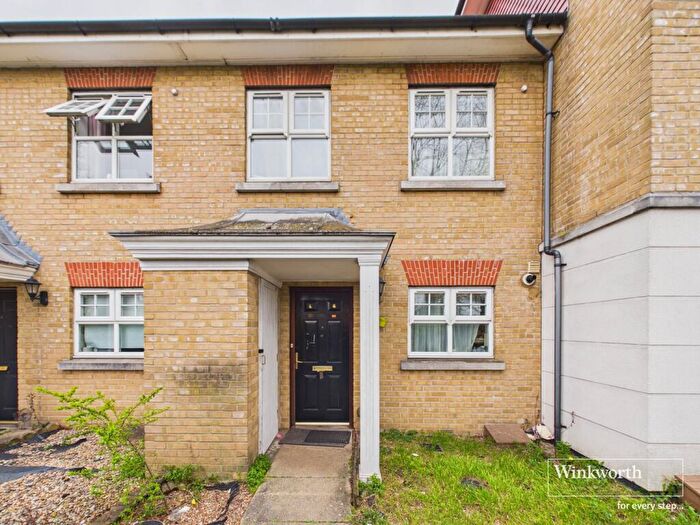
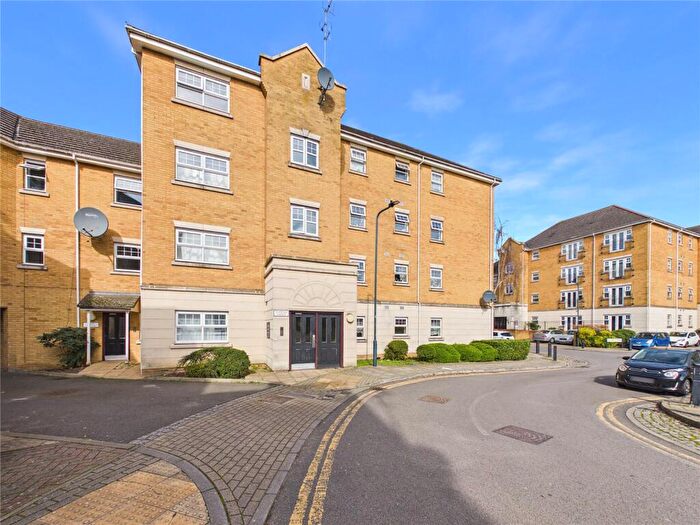
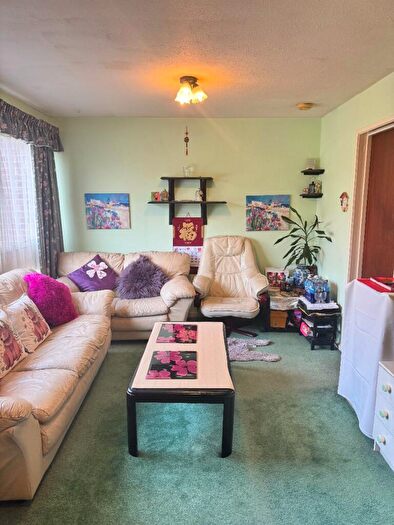
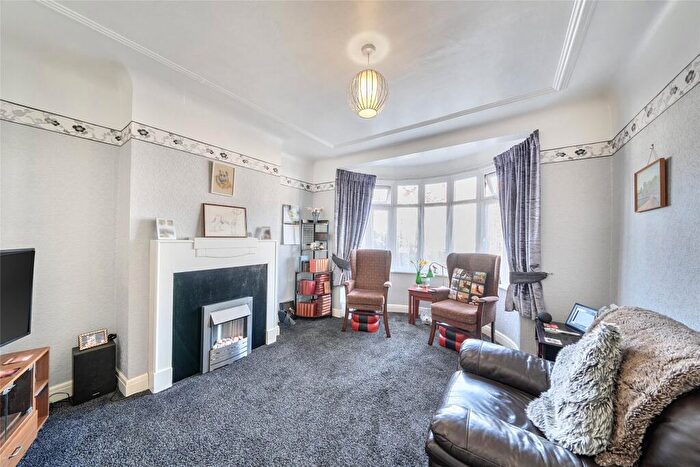
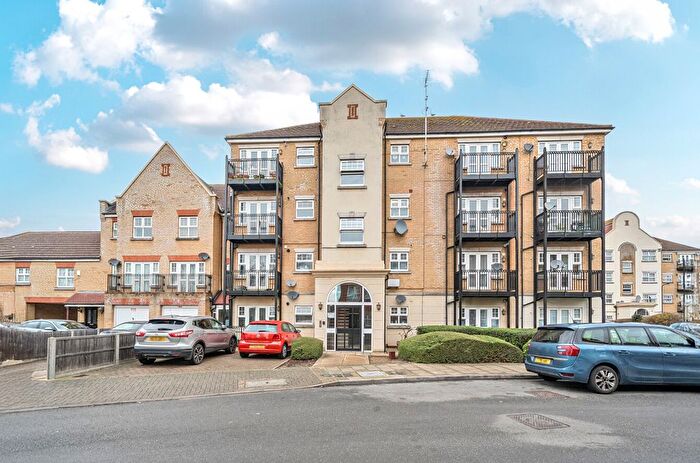
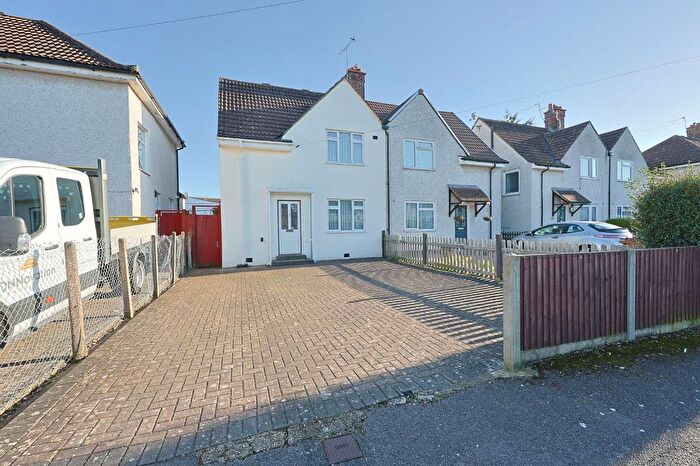
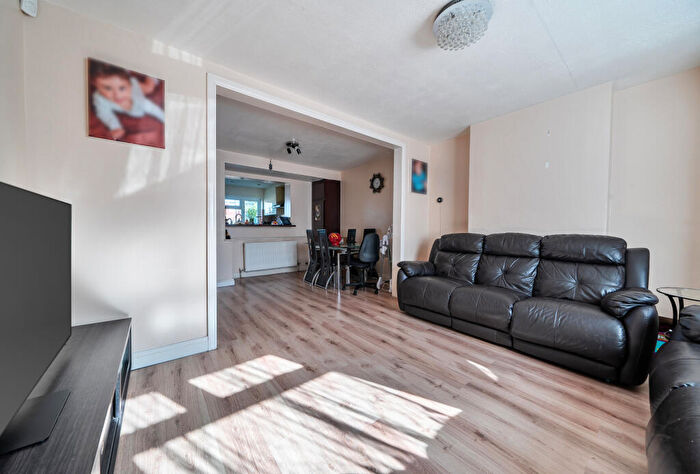
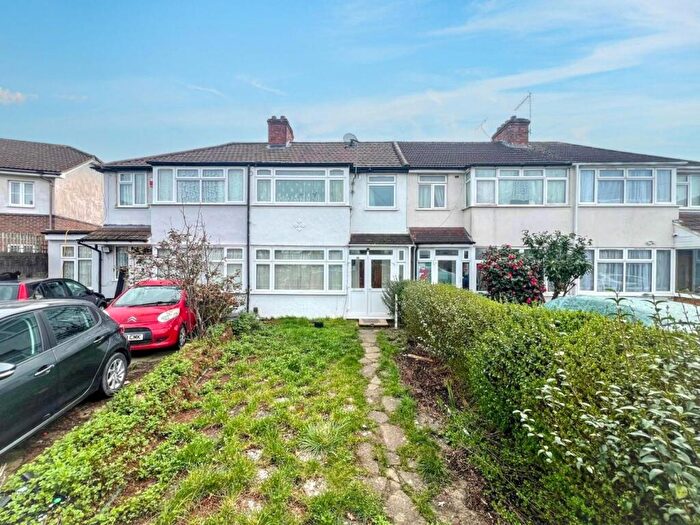
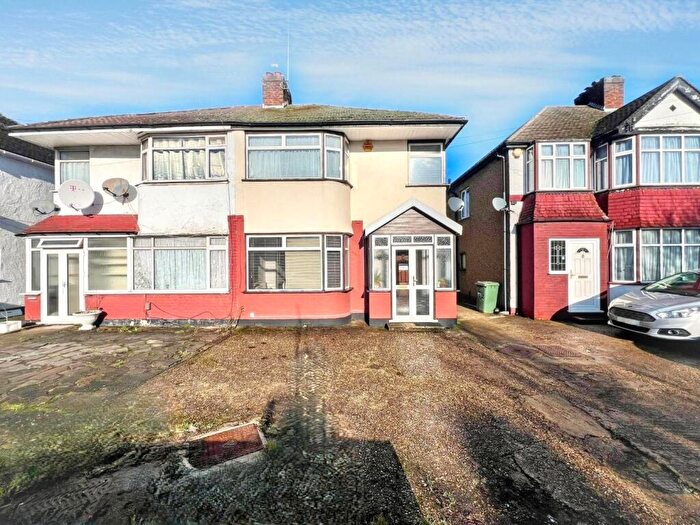
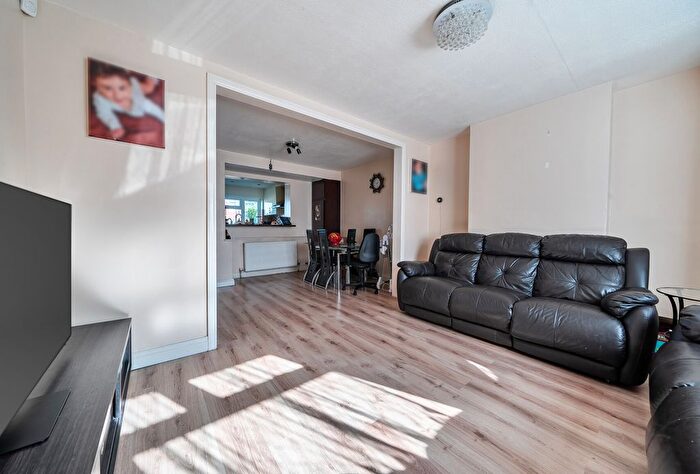
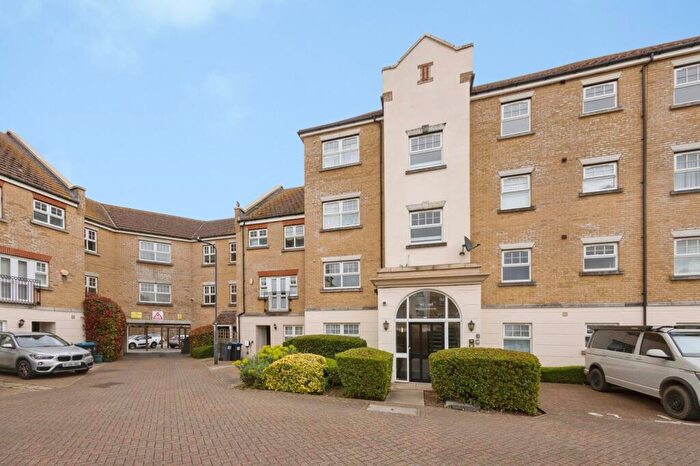
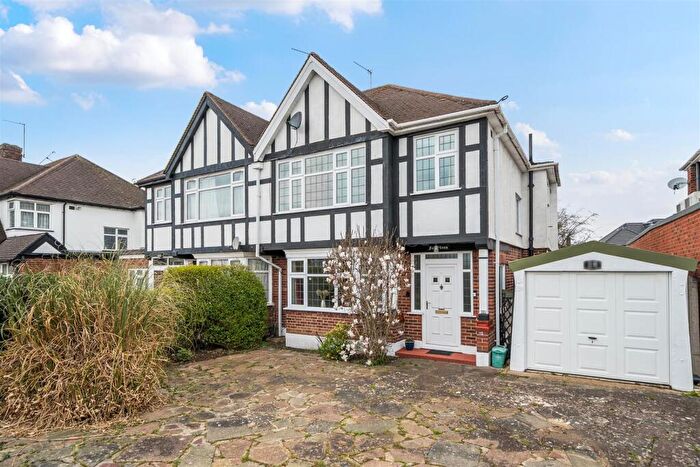
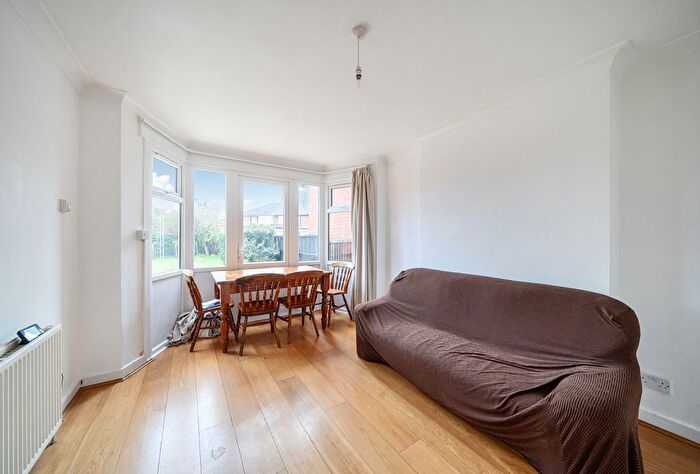
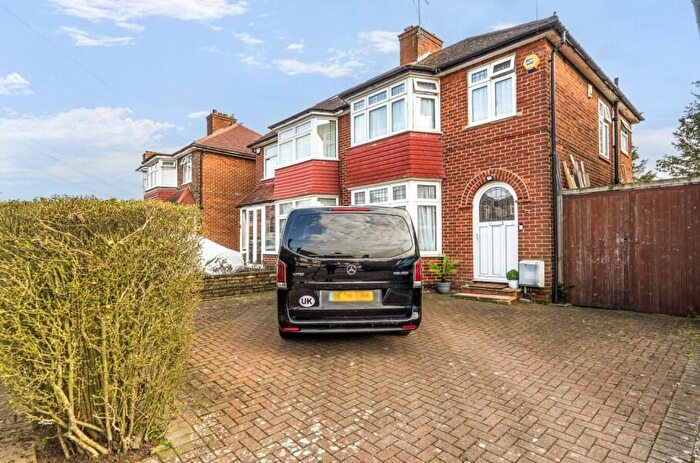
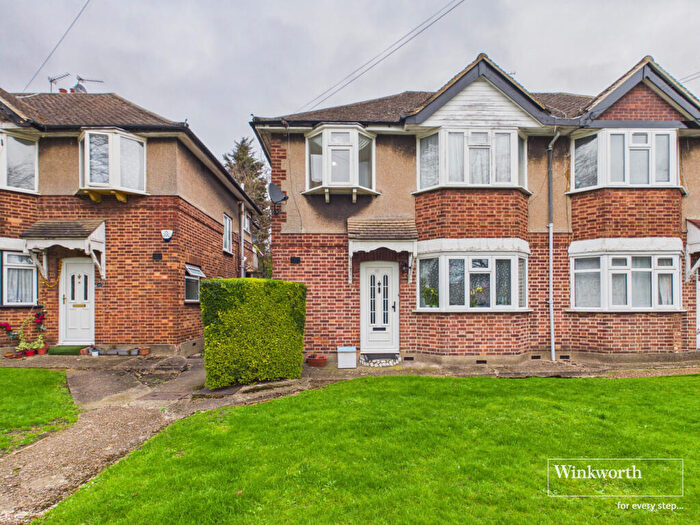
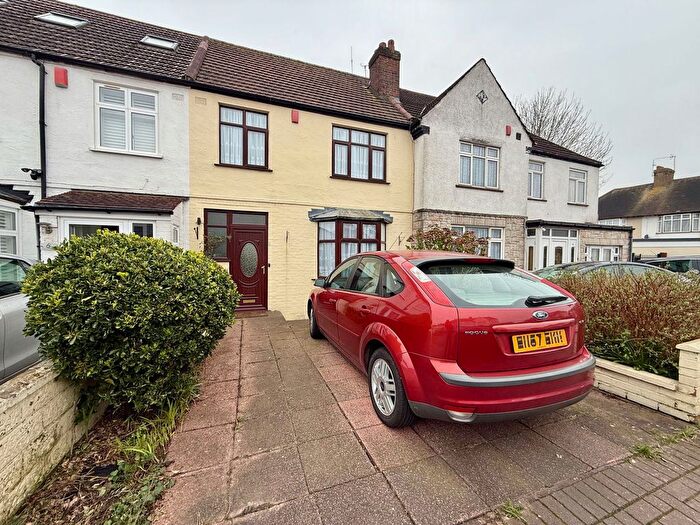
Properties for sale in Queensbury
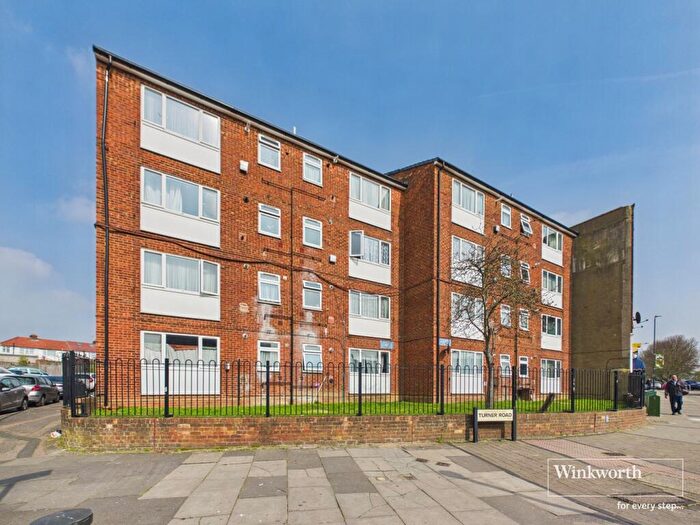
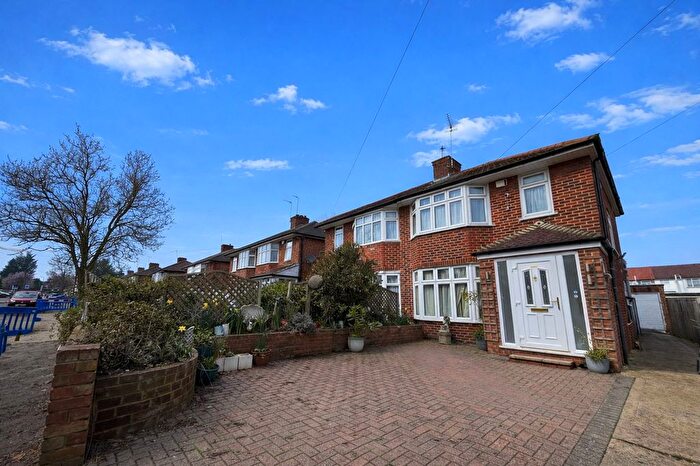
![]()
If you are looking to sell your house, let it out, or receive a property valuation, an expert can help you.
Click the button below to get started.


Roads and Postcodes in Queensbury
Navigate through our locations to find the location of your next house in Queensbury, Stanmore for sale or to rent.
| Streets | Postcodes |
|---|---|
| Cumberland Road | HA7 1EJ HA7 1EL HA7 1QH |
| Honeypot Lane | HA7 1QL |
| Lowther Road | HA7 1EP |
Transport near Queensbury
-
 Queensbury Station
 -
Kingsbury Station
-
Canons Park Station
-
Burnt Oak Station
-

 Kenton Station
 -
Preston Road Station
-
Edgware Station
-
Colindale Station
-
Northwick Park Station
-
South Kenton Station
- FAQ
- Price Paid By Year
Frequently asked questions about Queensbury
Which train stations are available in or near Queensbury?
Some of the train stations available in or near Queensbury are Kenton and South Kenton.
Which tube stations are available in or near Queensbury?
Some of the tube stations available in or near Queensbury are Queensbury, Kingsbury and Canons Park.
Property Price Paid in Queensbury by Year
The average sold property price by year was:
| Year | Average Sold Price | Price Change |
Sold Properties
|
|---|---|---|---|
| 2022 | £302,500 | -6% |
2 Properties |
| 2021 | £320,000 | 16% |
1 Property |
| 2019 | £267,500 | -23% |
1 Property |
| 2018 | £330,000 | 23% |
1 Property |
| 2017 | £252,500 | 6% |
1 Property |
| 2016 | £238,000 | -5% |
1 Property |
| 2015 | £249,000 | 22% |
1 Property |
| 2014 | £195,000 | -17% |
1 Property |
| 2013 | £229,000 | 39% |
1 Property |
| 2012 | £139,000 | -47% |
2 Properties |
| 2010 | £204,833 | 15% |
3 Properties |
| 2007 | £175,000 | 8% |
1 Property |
| 2006 | £161,000 | -10% |
1 Property |
| 2005 | £177,000 | 6% |
1 Property |
| 2004 | £165,500 | 1% |
2 Properties |
| 2003 | £163,950 | 21% |
1 Property |
| 2002 | £129,000 | 35% |
1 Property |
| 2001 | £83,500 | -1% |
1 Property |
| 2000 | £84,000 | 15% |
1 Property |
| 1999 | £71,000 | 23% |
2 Properties |
| 1998 | £55,000 | -14% |
2 Properties |
| 1997 | £62,500 | 21% |
1 Property |
| 1996 | £49,500 | 8% |
1 Property |
| 1995 | £45,625 | - |
4 Properties |