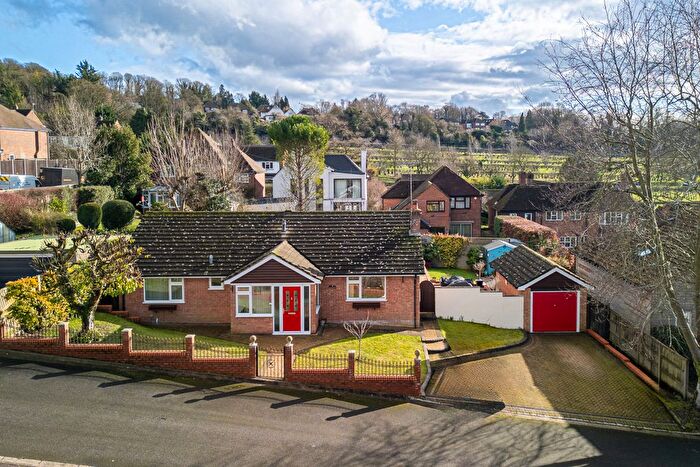
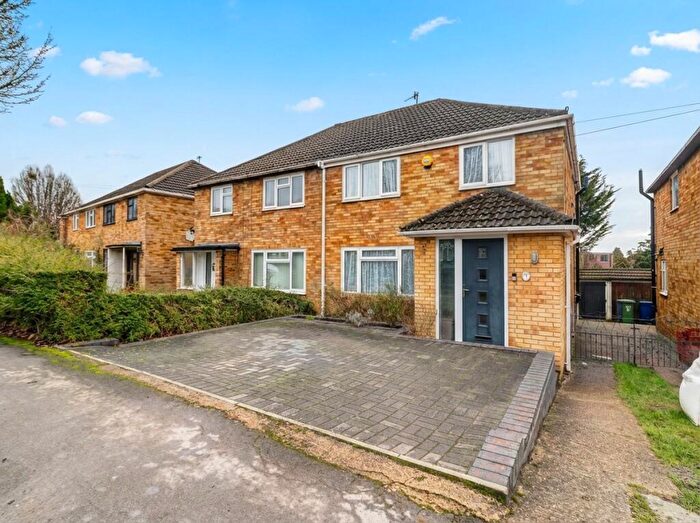
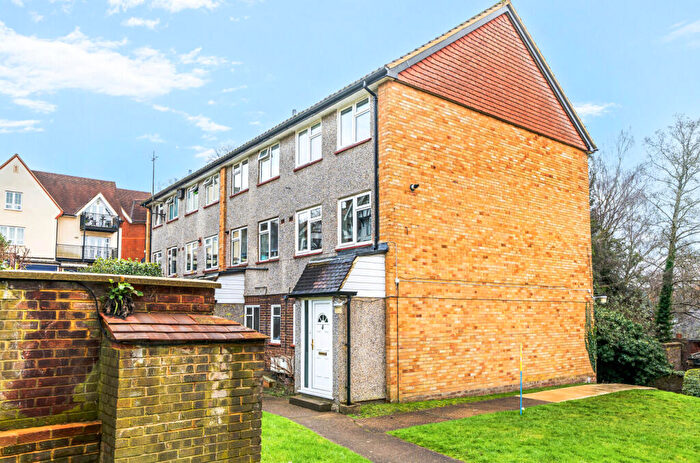
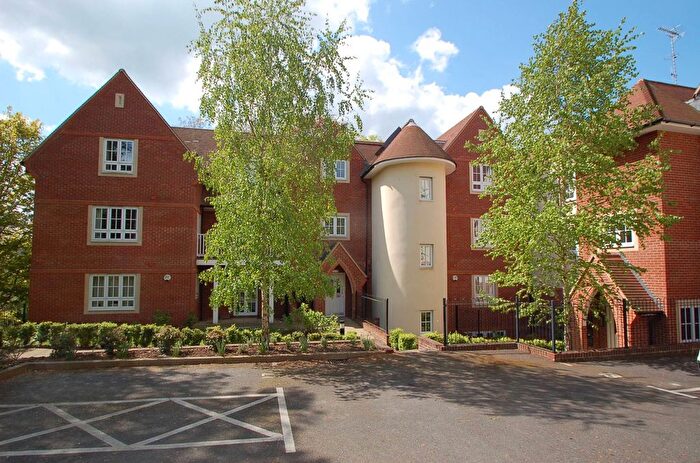
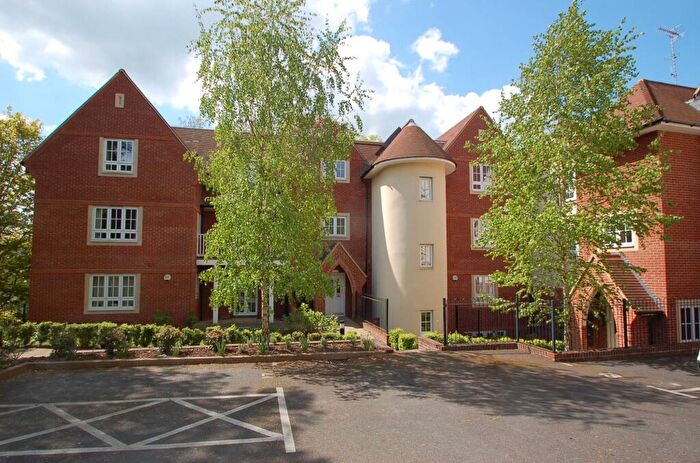
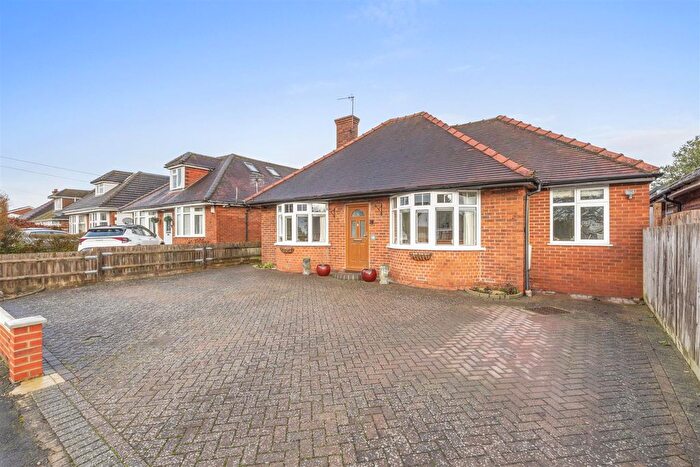
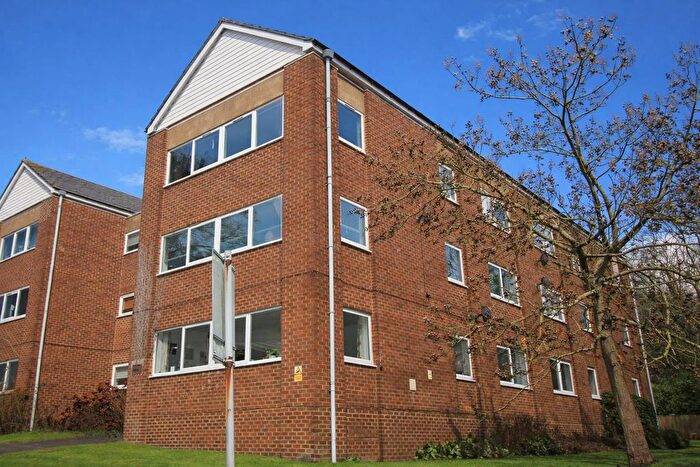
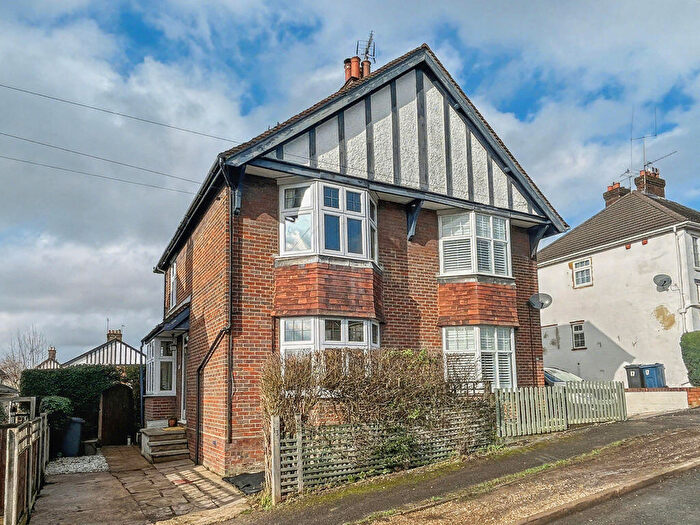
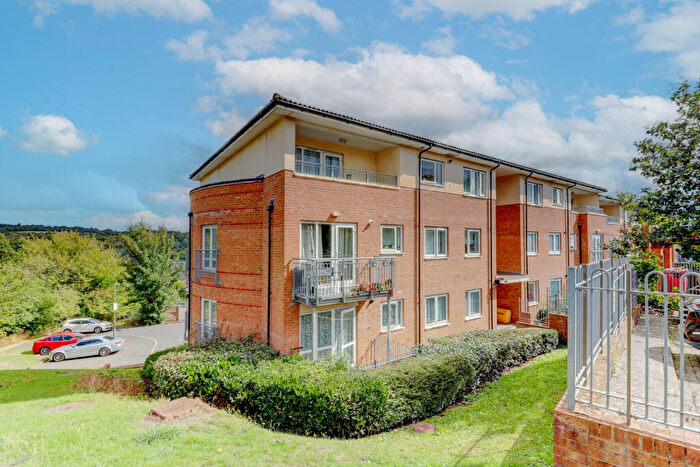
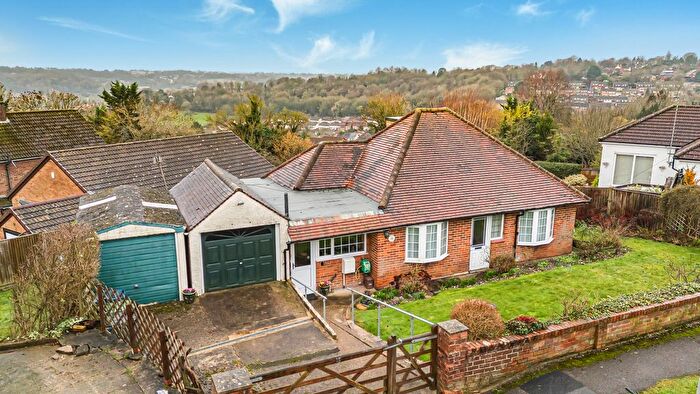
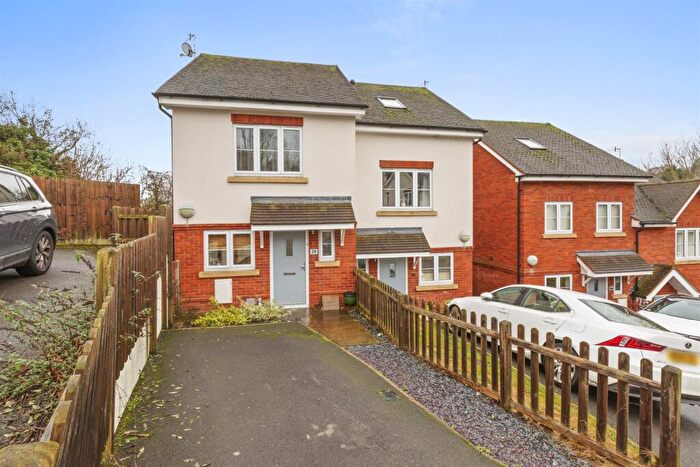
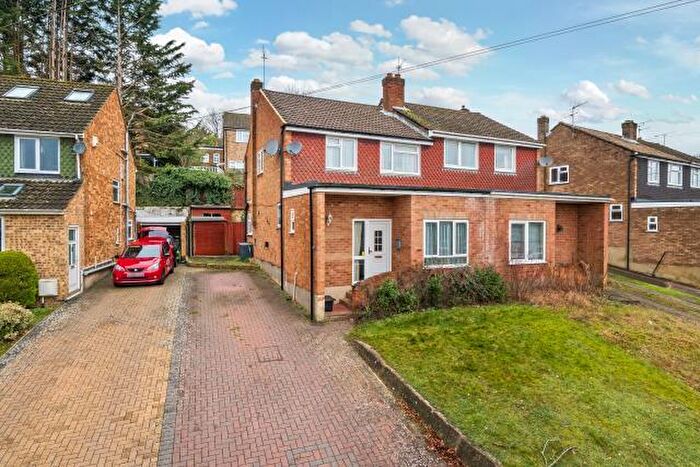
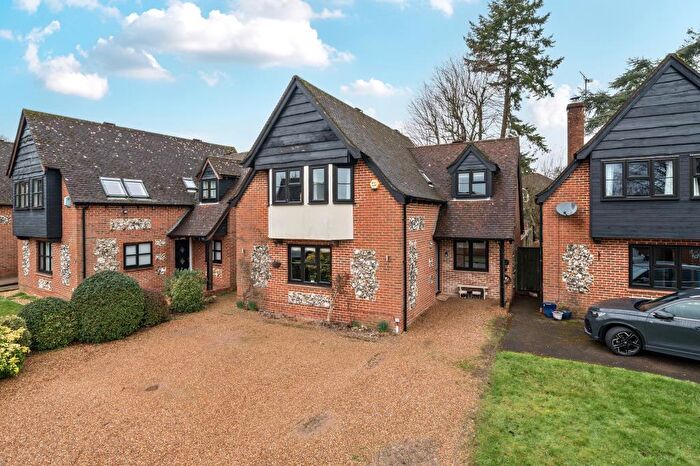
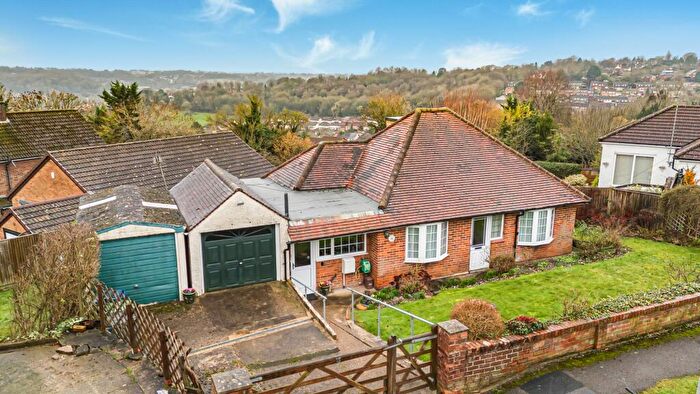
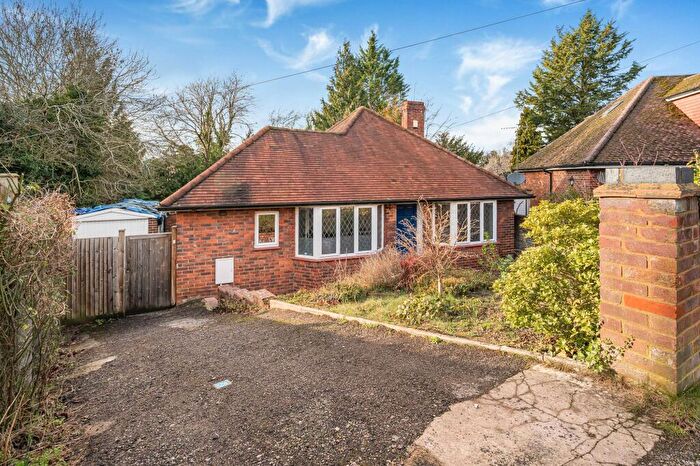
Houses for sale & to rent in Bowerdean, High Wycombe
House Prices in Bowerdean
Properties in Bowerdean have an average house price of £347,519.00 and had 142 Property Transactions within the last 3 years¹.
Bowerdean is an area in High Wycombe, Buckinghamshire with 1,823 households², where the most expensive property was sold for £820,000.00.
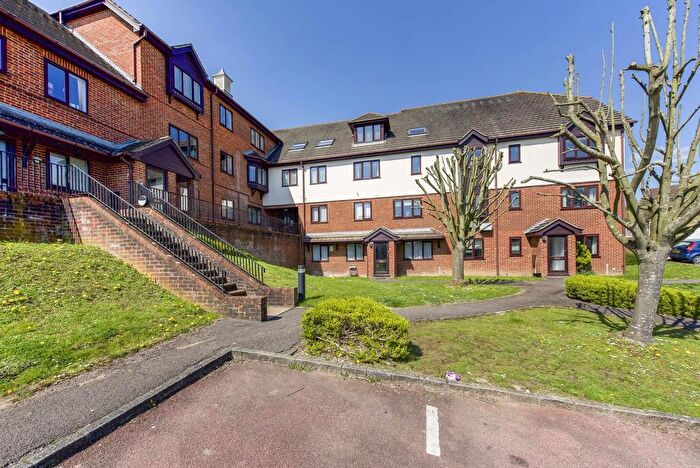
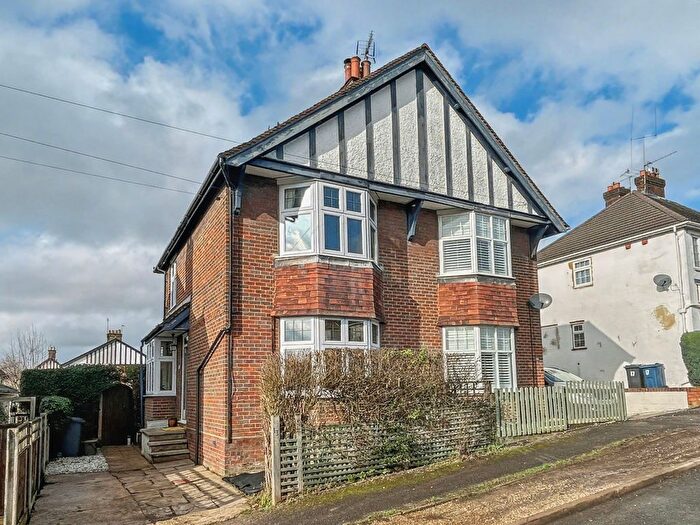
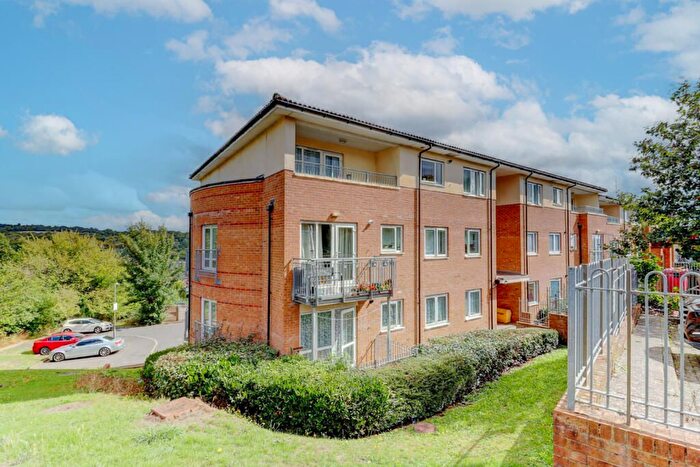
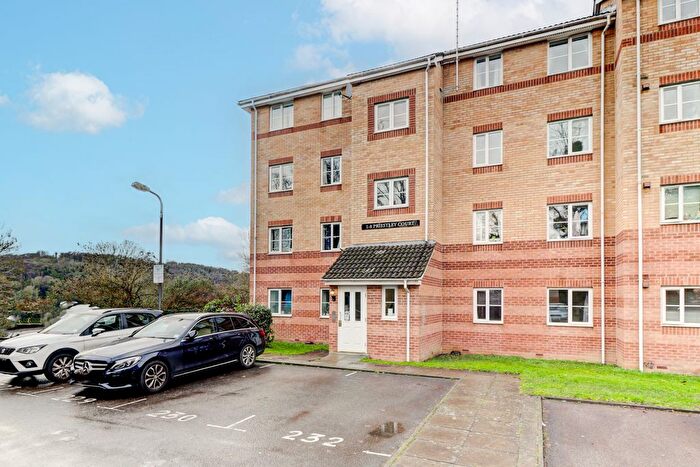
Properties for sale in Bowerdean
Roads and Postcodes in Bowerdean
Navigate through our locations to find the location of your next house in Bowerdean, High Wycombe for sale or to rent.
| Streets | Postcodes |
|---|---|
| Adam Close | HP13 6BY |
| Adelaide Road | HP13 6UP HP13 6UR HP13 6UW |
| Arnison Avenue | HP13 6DB HP13 6DD HP13 6DQ |
| Bowerdean Road | HP13 6AX HP13 6AY HP13 6AZ HP13 6XP HP13 6XR HP13 6XS HP13 6XT HP13 6XW |
| Colborne Road | HP13 6XZ |
| Gordon Road | HP13 6AS HP13 6AT |
| Greaves Road | HP13 7JU |
| Hazelbury Road | HP13 7RZ |
| Healey Avenue | HP13 7JP HP13 7JR |
| Hepplewhite Close | HP13 6BZ |
| Hillside | HP13 7LG |
| Hillside Gardens | HP13 7LQ |
| Hillview Road | HP13 6XU HP13 6XY |
| Hobart Close | HP13 6UF |
| Hobart Road | HP13 6UD HP13 6UE |
| Kingston Road | HP13 6UB HP13 6UJ |
| Lower Furney Close | HP13 6XQ |
| Lucas Road | HP13 6HP |
| Mayhew Crescent | HP13 6BX HP13 6DF |
| Nicholas Gardens | HP13 6JG HP13 6JQ |
| Perth Road | HP13 6XX |
| Philip Road | HP13 7JS |
| Rowan Avenue | HP13 6JA HP13 6JB |
| Salisbury Road | HP13 6UL |
| St Georges Close | HP13 7JT |
| St Marks Close | HP13 6HQ HP13 6JE |
| Sussex Close | HP13 6UN |
| Totteridge Avenue | HP13 6XG HP13 6XL |
| Totteridge Road | HP13 6HR HP13 6HZ HP13 7LA HP13 7LB HP13 7LE HP13 7LF |
| Underwood Road | HP13 6YA HP13 6YB HP13 6YD |
| Walton Close | HP13 6TX |
| Walton Drive | HP13 6TS HP13 6TT HP13 6TY HP13 6UA |
| Wayside | HP13 7LD |
| Wheelers Park | HP13 6GH |
Transport near Bowerdean
-
High Wycombe Station
-
Bourne End Station
-
Beaconsfield Station
-
Marlow Station
-
Saunderton Station
-
Great Missenden Station
- FAQ
- Price Paid By Year
- Property Type Price
Frequently asked questions about Bowerdean
What is the average price for a property for sale in Bowerdean?
The average price for a property for sale in Bowerdean is £347,519. This amount is 25% lower than the average price in High Wycombe. There are 1,778 property listings for sale in Bowerdean.
What streets have the most expensive properties for sale in Bowerdean?
The streets with the most expensive properties for sale in Bowerdean are Lucas Road at an average of £820,000, Mayhew Crescent at an average of £438,612 and Philip Road at an average of £432,500.
What streets have the most affordable properties for sale in Bowerdean?
The streets with the most affordable properties for sale in Bowerdean are Hobart Road at an average of £160,000, Lower Furney Close at an average of £175,800 and Gordon Road at an average of £183,000.
Which train stations are available in or near Bowerdean?
Some of the train stations available in or near Bowerdean are High Wycombe, Bourne End and Beaconsfield.
Property Price Paid in Bowerdean by Year
The average sold property price by year was:
| Year | Average Sold Price | Price Change |
Sold Properties
|
|---|---|---|---|
| 2025 | £342,743 | -2% |
49 Properties |
| 2024 | £349,576 | -0,3% |
50 Properties |
| 2023 | £350,569 | -3% |
43 Properties |
| 2022 | £359,509 | 7% |
53 Properties |
| 2021 | £334,660 | 8% |
87 Properties |
| 2020 | £306,970 | 5% |
53 Properties |
| 2019 | £293,068 | -5% |
61 Properties |
| 2018 | £307,543 | -7% |
50 Properties |
| 2017 | £328,668 | 14% |
72 Properties |
| 2016 | £283,335 | 6% |
81 Properties |
| 2015 | £267,614 | 20% |
60 Properties |
| 2014 | £214,758 | 4% |
68 Properties |
| 2013 | £205,799 | 2% |
60 Properties |
| 2012 | £202,287 | 4% |
45 Properties |
| 2011 | £193,422 | -4% |
52 Properties |
| 2010 | £200,702 | 6% |
53 Properties |
| 2009 | £188,071 | -10% |
39 Properties |
| 2008 | £207,644 | 6% |
70 Properties |
| 2007 | £196,104 | 8% |
115 Properties |
| 2006 | £180,306 | 2% |
124 Properties |
| 2005 | £177,058 | 5% |
88 Properties |
| 2004 | £168,072 | 9% |
100 Properties |
| 2003 | £152,269 | 12% |
113 Properties |
| 2002 | £133,791 | 12% |
117 Properties |
| 2001 | £117,311 | 10% |
98 Properties |
| 2000 | £105,101 | 13% |
90 Properties |
| 1999 | £91,312 | 13% |
172 Properties |
| 1998 | £79,144 | 12% |
133 Properties |
| 1997 | £69,707 | 11% |
93 Properties |
| 1996 | £62,095 | 5% |
106 Properties |
| 1995 | £59,020 | - |
87 Properties |
Property Price per Property Type in Bowerdean
Here you can find historic sold price data in order to help with your property search.
The average Property Paid Price for specific property types in the last three years are:
| Property Type | Average Sold Price | Sold Properties |
|---|---|---|
| Semi Detached House | £371,473.00 | 104 Semi Detached Houses |
| Detached House | £481,700.00 | 5 Detached Houses |
| Terraced House | £330,708.00 | 12 Terraced Houses |
| Flat | £206,547.00 | 21 Flats |

