
Houses for sale & to rent in Micklefield, High Wycombe
House Prices in Micklefield
Properties in Micklefield have an average house price of £348k and had 128 Property Transactions within the last 3 years¹.
Micklefield is an area in High Wycombe, Buckinghamshire with 2,040 households², where the most expensive property was sold for £686k.
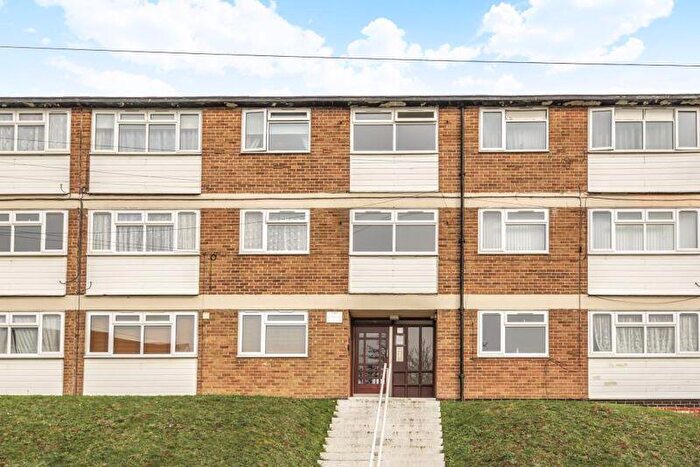
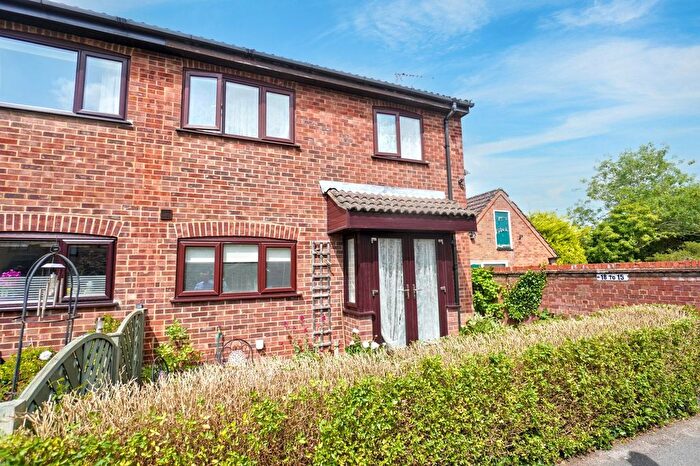
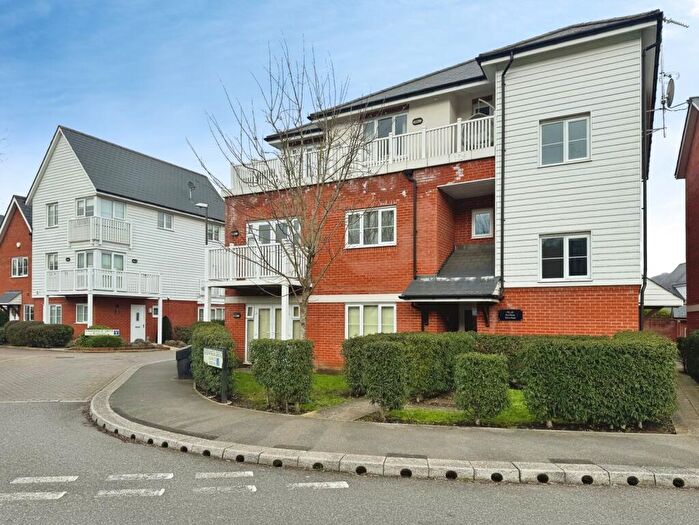
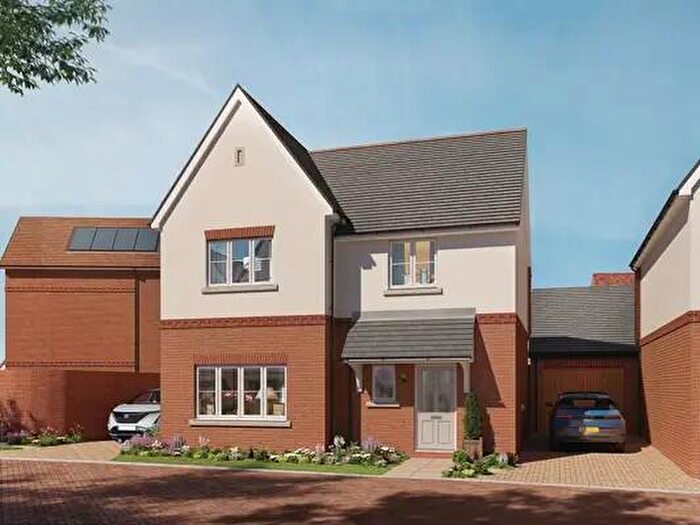
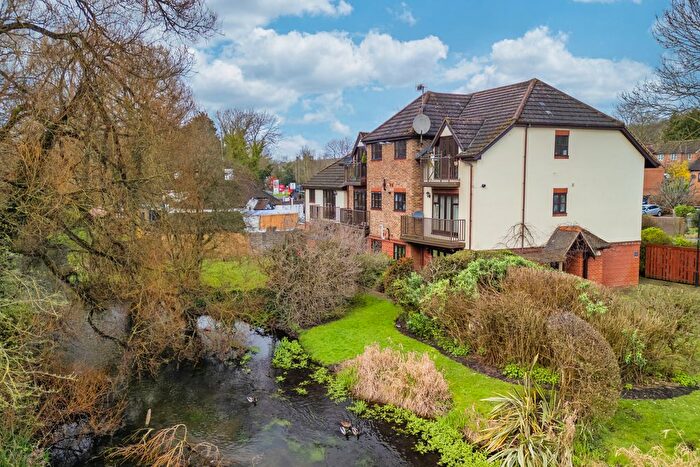
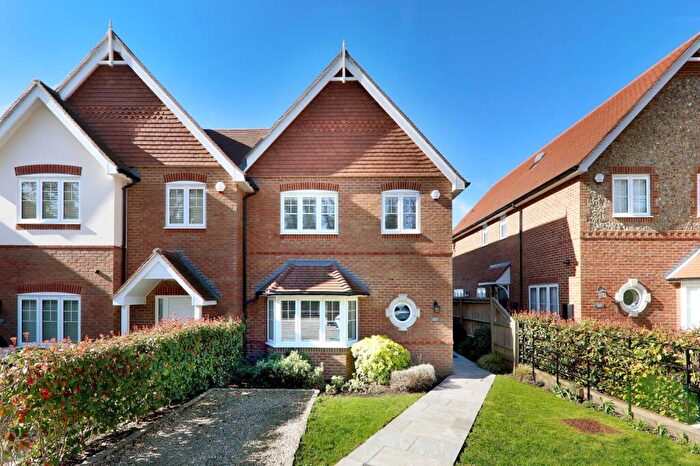
Properties for sale in Micklefield
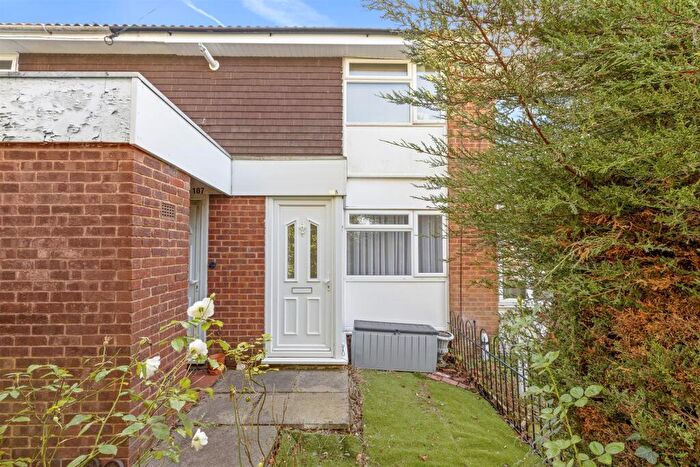
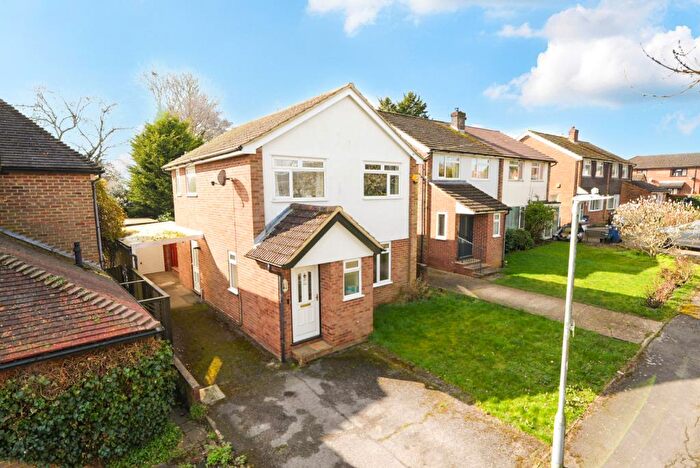
![]()
If you are looking to sell your house, let it out, or receive a property valuation, an expert can help you.
Click the button below to get started.


Roads and Postcodes in Micklefield
Navigate through our locations to find the location of your next house in Micklefield, High Wycombe for sale or to rent.
Transport near Micklefield
-
 High Wycombe Station
 -
Beaconsfield Station
-
Bourne End Station
-
Marlow Station
-
Seer Green Station
-
Cookham Station
- FAQ
- Price Paid By Year
- Property Type Price
Frequently asked questions about Micklefield
What is the average price for a property for sale in Micklefield?
The average price for a property for sale in Micklefield is £347,876. This amount is 25% lower than the average price in High Wycombe. There are 1,287 property listings for sale in Micklefield.
What streets have the most expensive properties for sale in Micklefield?
The streets with the most expensive properties for sale in Micklefield are Cock Lane at an average of £560,416, Pimms Grove at an average of £501,055 and Horsenden Road at an average of £430,000.
What streets have the most affordable properties for sale in Micklefield?
The streets with the most affordable properties for sale in Micklefield are Lingfield Close at an average of £184,156, Butlers Court at an average of £185,000 and Olympic Way at an average of £226,666.
Which train stations are available in or near Micklefield?
Some of the train stations available in or near Micklefield are High Wycombe, Beaconsfield and Bourne End.
Property Price Paid in Micklefield by Year
The average sold property price by year was:
| Year | Average Sold Price | Price Change |
Sold Properties
|
|---|---|---|---|
| 2026 | £535,000 | 32% |
1 Property |
| 2025 | £364,384 | 8% |
44 Properties |
| 2024 | £335,184 | -1% |
42 Properties |
| 2023 | £338,597 | -4% |
41 Properties |
| 2022 | £352,900 | 9% |
63 Properties |
| 2021 | £321,085 | 7% |
72 Properties |
| 2020 | £297,614 | 3% |
48 Properties |
| 2019 | £289,019 | 0,1% |
67 Properties |
| 2018 | £288,864 | -9% |
48 Properties |
| 2017 | £313,954 | 16% |
73 Properties |
| 2016 | £264,314 | 4% |
67 Properties |
| 2015 | £254,649 | 17% |
81 Properties |
| 2014 | £210,841 | 8% |
89 Properties |
| 2013 | £194,109 | 7% |
63 Properties |
| 2012 | £180,604 | -4% |
62 Properties |
| 2011 | £188,293 | 4% |
59 Properties |
| 2010 | £180,576 | 6% |
48 Properties |
| 2009 | £169,887 | -15% |
39 Properties |
| 2008 | £195,467 | 4% |
61 Properties |
| 2007 | £188,380 | 11% |
105 Properties |
| 2006 | £167,159 | 8% |
117 Properties |
| 2005 | £154,175 | -0,3% |
90 Properties |
| 2004 | £154,595 | 9% |
137 Properties |
| 2003 | £140,840 | 14% |
112 Properties |
| 2002 | £120,484 | 13% |
139 Properties |
| 2001 | £105,371 | 9% |
103 Properties |
| 2000 | £95,715 | 14% |
98 Properties |
| 1999 | £82,312 | 16% |
107 Properties |
| 1998 | £69,420 | 0,4% |
92 Properties |
| 1997 | £69,173 | 17% |
119 Properties |
| 1996 | £57,085 | -3% |
76 Properties |
| 1995 | £58,688 | - |
60 Properties |
Property Price per Property Type in Micklefield
Here you can find historic sold price data in order to help with your property search.
The average Property Paid Price for specific property types in the last three years are:
| Property Type | Average Sold Price | Sold Properties |
|---|---|---|
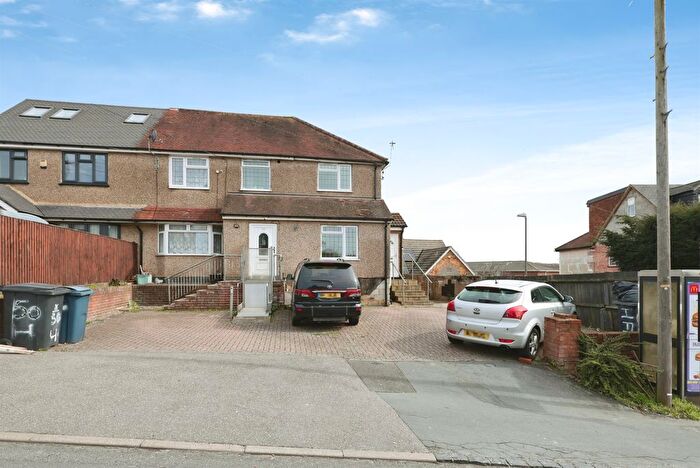
| Semi Detached House | £377,905.00 | 70 Semi Detached Houses |
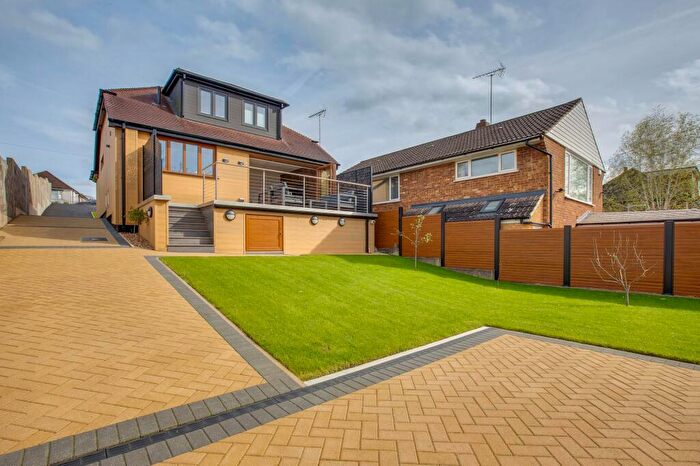
| Detached House | £520,454.00 | 11 Detached Houses |
| Terraced House | £361,323.00 | 17 Terraced Houses |
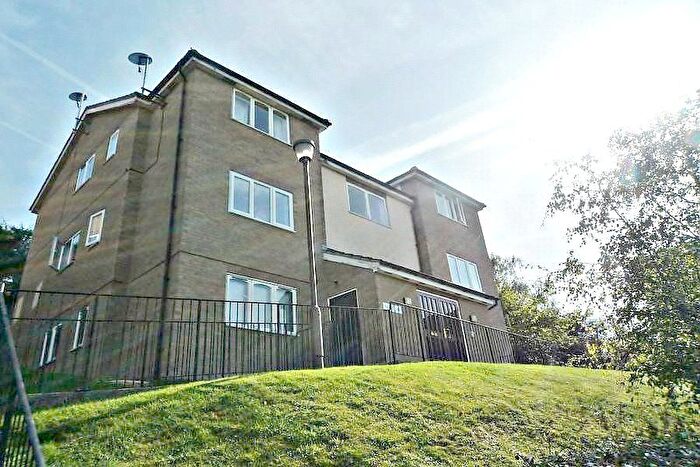
| Flat | £206,908.00 | 30 Flats |