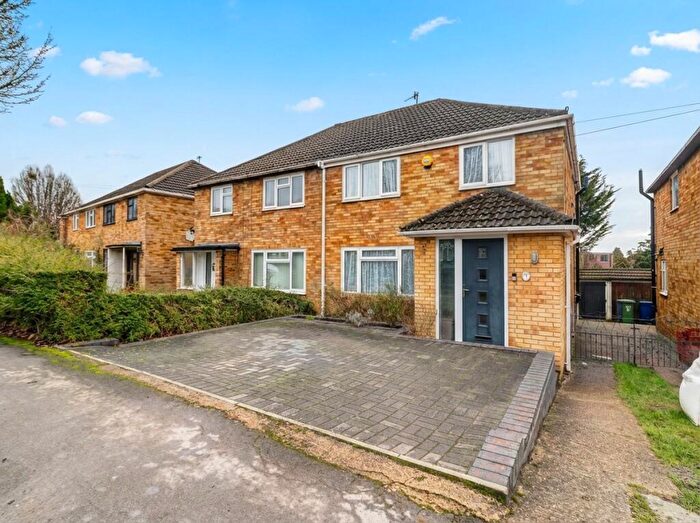
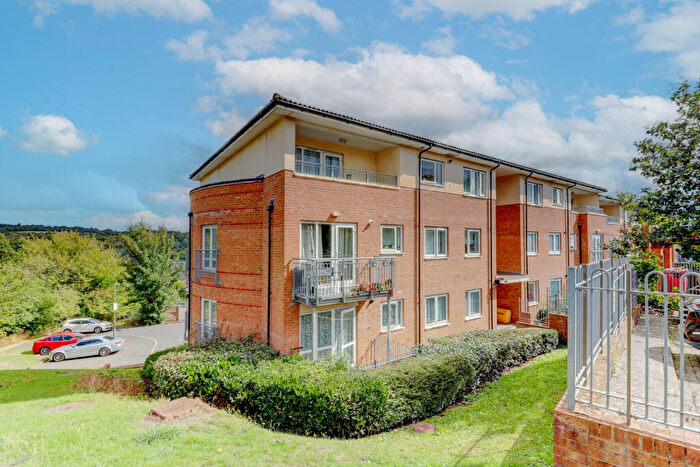
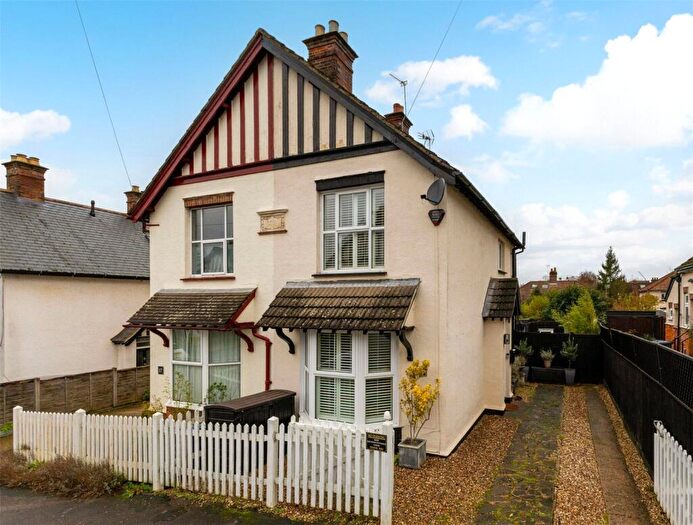
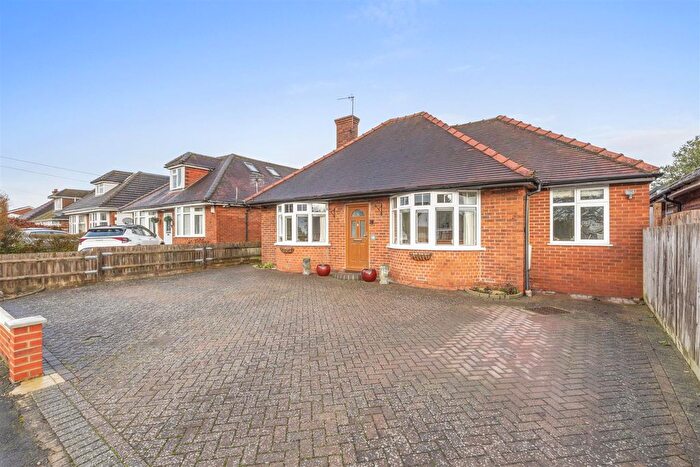
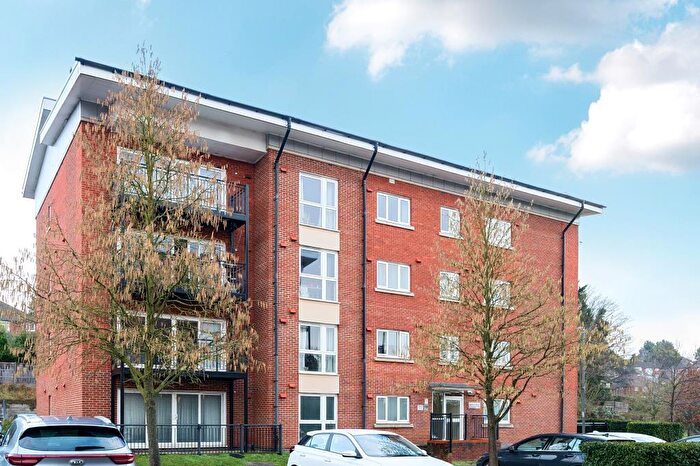
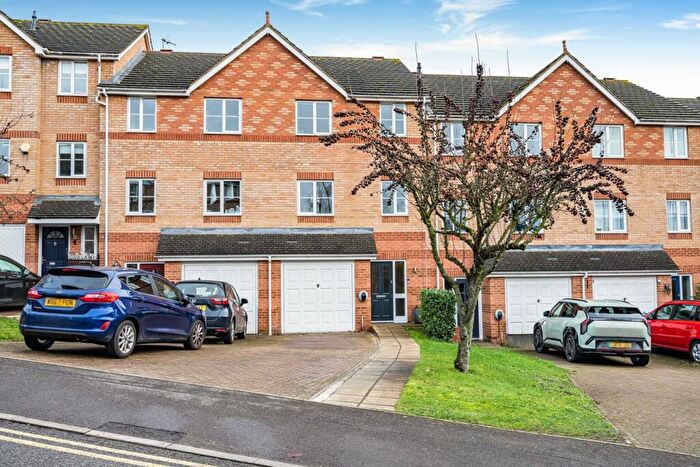
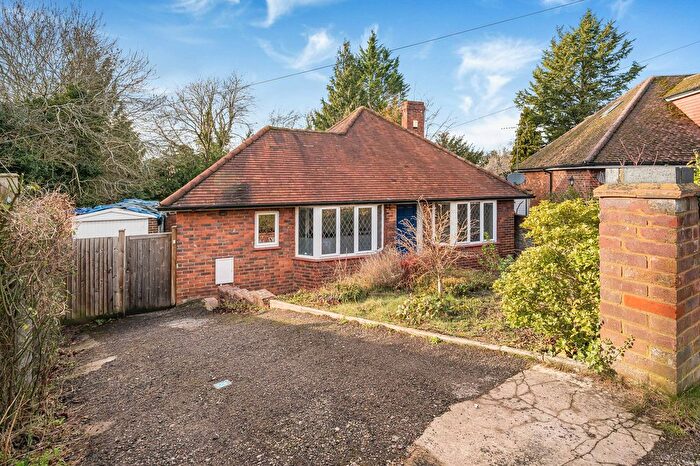
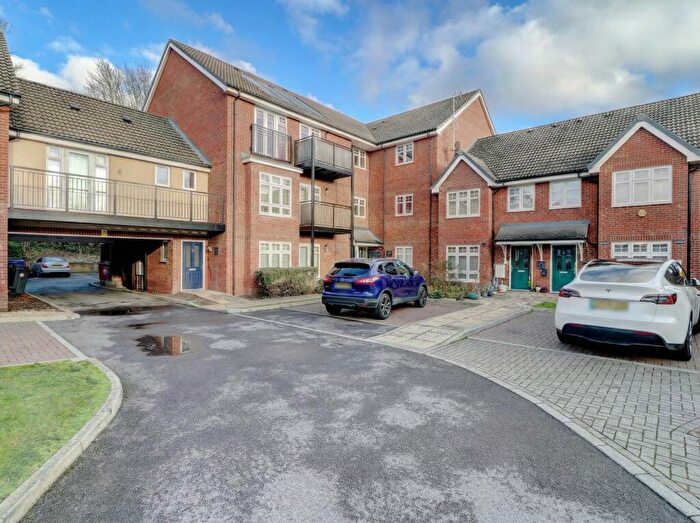
Houses for sale & to rent in Totteridge, High Wycombe
House Prices in Totteridge
Properties in Totteridge have an average house price of £385,957.00 and had 199 Property Transactions within the last 3 years¹.
Totteridge is an area in High Wycombe, Buckinghamshire with 2,475 households², where the most expensive property was sold for £870,000.00.
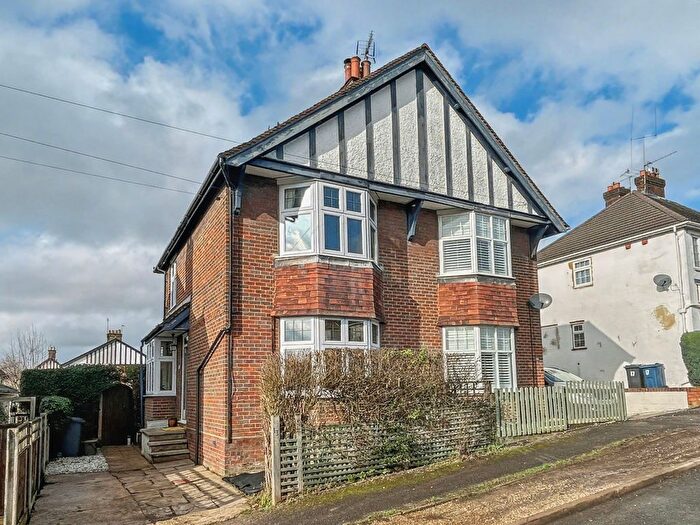
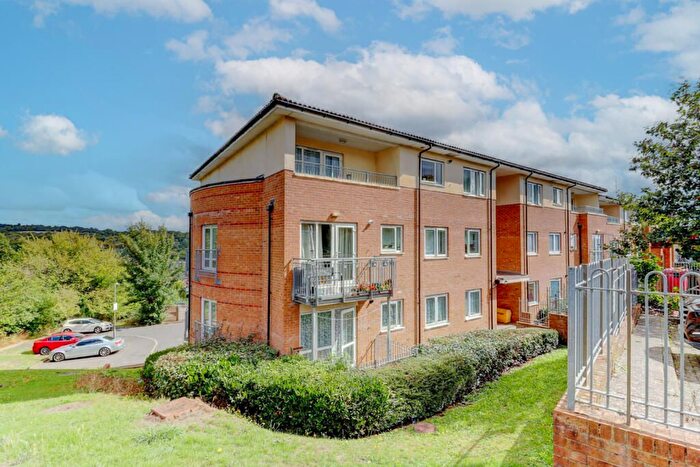
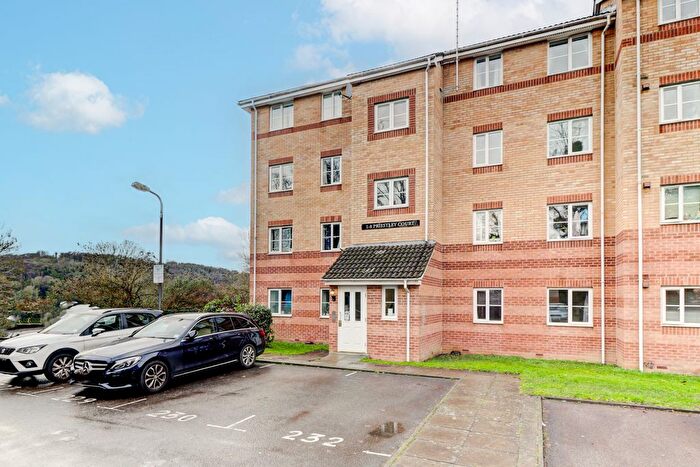
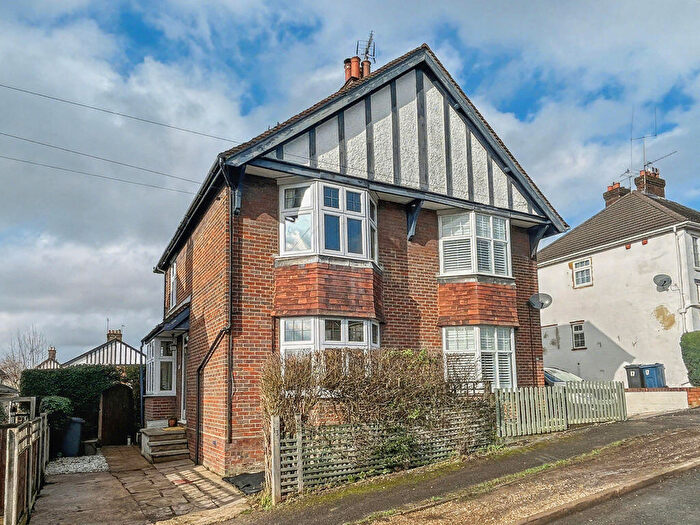
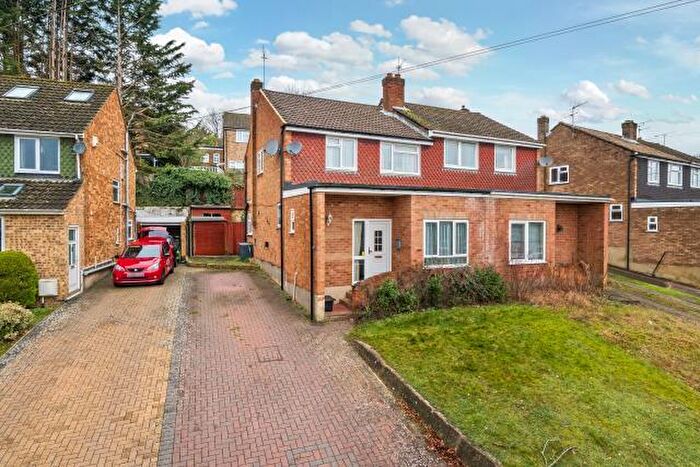
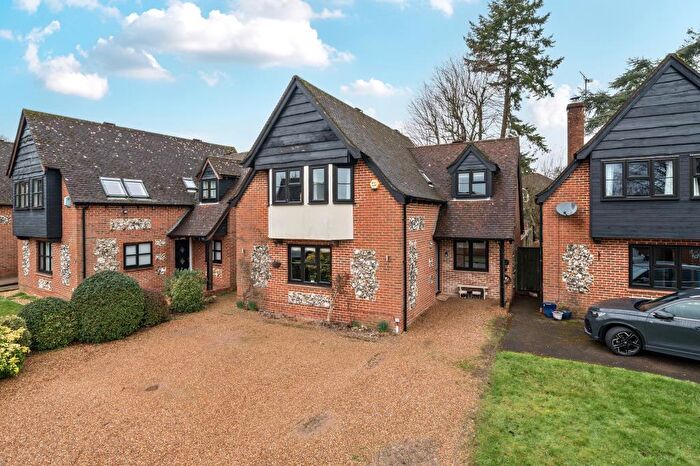
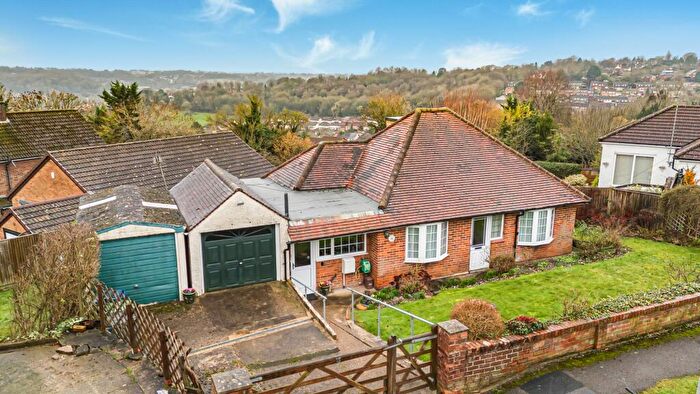
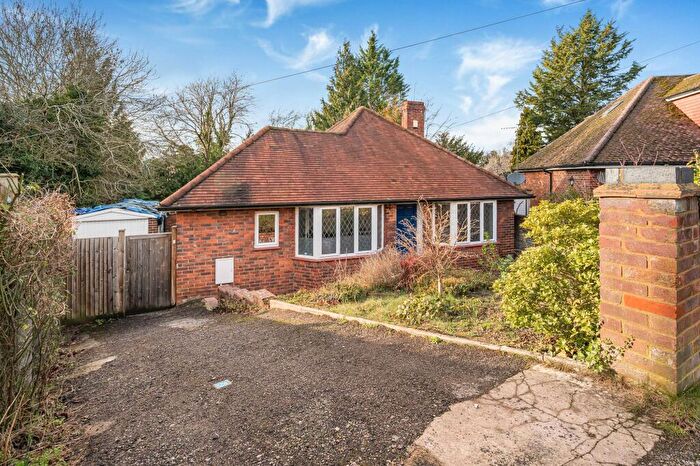
Properties for sale in Totteridge
Roads and Postcodes in Totteridge
Navigate through our locations to find the location of your next house in Totteridge, High Wycombe for sale or to rent.
| Streets | Postcodes |
|---|---|
| Auckland Road | HP13 7RS |
| Barton Way | HP13 6SY |
| Burma Close | HP13 7RQ |
| Cairnside | HP13 7SB |
| Cambridge Crescent | HP13 7NB HP13 7ND HP13 7NE |
| East Drive | HP13 6JN |
| Elora Road | HP13 7LL |
| Ercolani Avenue | HP13 7FZ |
| Everest Close | HP13 7RF |
| Everest Road | HP13 7RD HP13 7RG HP13 7RH |
| Firs Close | HP13 7LX |
| Gladstone Rise | HP13 7NW |
| Hampden Way | HP13 7TJ |
| Hardenwaye | HP13 6TL HP13 6TW |
| Hatters Lane | HP13 7LU HP13 7LY HP13 7LZ HP13 7NF HP13 7NG HP13 7NH HP13 7NJ HP13 7NL |
| Hennerton Way | HP13 7UE |
| Hicks Farm Rise | HP13 7SG HP13 7SP HP13 7SQ HP13 7ST HP13 7SW HP13 7SX |
| Hillary Close | HP13 7RP |
| Hillary Road | HP13 7RA HP13 7RB HP13 7RW |
| Hollis Road | HP13 7UN |
| Hunt Road | HP13 7RE |
| Keens Close | HP13 6TP |
| Kendalls Close | HP13 7NN |
| Leas Close | HP13 7UW |
| Linchfield | HP13 7QH HP13 7QU |
| Lorraine Close | HP13 7JY |
| Lyndon Gardens | HP13 7QJ |
| New Drive | HP13 6JS |
| Nightingale Drive | HP13 6FF |
| North Drive | HP13 6JW |
| Old Hardenwaye | HP13 6TJ |
| Quebec Road | HP13 7RU |
| Reynolds Close | HP13 7LS |
| Richard Gardens | HP13 7LT |
| South Drive | HP13 6JU |
| St Hughes Avenue | HP13 7TZ |
| St Hughs Avenue | HP13 7TX HP13 7TY HP13 7UA HP13 7UH |
| Tadros Court | HP13 7GF HP13 7GG |
| Tenzing Drive | HP13 7RR HP13 7RT |
| Terryfield Road | HP13 7RX HP13 7RY |
| The Birches | HP13 6DH |
| The Crescent | HP13 6JP HP13 6JR HP13 6JY |
| The Quadrangle | HP13 7QR |
| The Quadrant | HP13 6TU |
| The Roperies | HP13 7FT HP13 7FW |
| Totteridge Common | HP13 7QG |
| Totteridge Common Cotts | HP13 7QF |
| Totteridge Drive | HP13 6JH HP13 6JJ HP13 6JL HP13 6UG HP13 6UQ |
| Totteridge Lane | HP13 7LR HP13 7QD HP13 7QE HP13 7QQ |
| Totteridge Parade | HP13 6UH |
| Totteridge Road | HP13 7LH HP13 7LJ HP13 7LN HP13 7LP HP13 7LW |
| Turners Drive | HP13 7PA |
| Uplands Close | HP13 6JX |
| West Drive | HP13 6JT |
| Windrush Drive | HP13 7TP HP13 7TR HP13 7UL |
| Wingate Avenue | HP13 7QP HP13 7QS |
| Wingate Close | HP13 7QT |
Transport near Totteridge
- FAQ
- Price Paid By Year
- Property Type Price
Frequently asked questions about Totteridge
What is the average price for a property for sale in Totteridge?
The average price for a property for sale in Totteridge is £385,957. This amount is 17% lower than the average price in High Wycombe. There are 1,725 property listings for sale in Totteridge.
What streets have the most expensive properties for sale in Totteridge?
The streets with the most expensive properties for sale in Totteridge are West Drive at an average of £511,666, Lyndon Gardens at an average of £503,571 and The Crescent at an average of £499,625.
What streets have the most affordable properties for sale in Totteridge?
The streets with the most affordable properties for sale in Totteridge are St Hughes Avenue at an average of £193,500, Linchfield at an average of £200,190 and Ercolani Avenue at an average of £227,125.
Which train stations are available in or near Totteridge?
Some of the train stations available in or near Totteridge are High Wycombe, Beaconsfield and Bourne End.
Property Price Paid in Totteridge by Year
The average sold property price by year was:
| Year | Average Sold Price | Price Change |
Sold Properties
|
|---|---|---|---|
| 2025 | £389,981 | 1% |
62 Properties |
| 2024 | £387,841 | 2% |
71 Properties |
| 2023 | £380,151 | 7% |
66 Properties |
| 2022 | £351,851 | 4% |
107 Properties |
| 2021 | £336,080 | -6% |
100 Properties |
| 2020 | £355,466 | 15% |
100 Properties |
| 2019 | £301,887 | -5% |
74 Properties |
| 2018 | £316,616 | -3% |
95 Properties |
| 2017 | £326,177 | 8% |
93 Properties |
| 2016 | £299,250 | 11% |
109 Properties |
| 2015 | £267,506 | 10% |
93 Properties |
| 2014 | £240,215 | 10% |
116 Properties |
| 2013 | £215,368 | -7% |
90 Properties |
| 2012 | £231,399 | 7% |
76 Properties |
| 2011 | £214,081 | -3% |
67 Properties |
| 2010 | £220,375 | 16% |
58 Properties |
| 2009 | £184,765 | -16% |
120 Properties |
| 2008 | £214,870 | -3% |
95 Properties |
| 2007 | £221,603 | 6% |
247 Properties |
| 2006 | £207,447 | 8% |
135 Properties |
| 2005 | £191,542 | -1% |
77 Properties |
| 2004 | £193,425 | 8% |
120 Properties |
| 2003 | £178,675 | 12% |
88 Properties |
| 2002 | £156,724 | 13% |
126 Properties |
| 2001 | £135,779 | 10% |
109 Properties |
| 2000 | £122,615 | 16% |
88 Properties |
| 1999 | £103,368 | 11% |
132 Properties |
| 1998 | £92,499 | 5% |
93 Properties |
| 1997 | £87,681 | 16% |
111 Properties |
| 1996 | £73,952 | -10% |
92 Properties |
| 1995 | £81,556 | - |
87 Properties |
Property Price per Property Type in Totteridge
Here you can find historic sold price data in order to help with your property search.
The average Property Paid Price for specific property types in the last three years are:
| Property Type | Average Sold Price | Sold Properties |
|---|---|---|
| Semi Detached House | £415,698.00 | 97 Semi Detached Houses |
| Detached House | £495,487.00 | 38 Detached Houses |
| Terraced House | £376,579.00 | 24 Terraced Houses |
| Flat | £215,411.00 | 40 Flats |

