
Houses for sale & to rent in M45 8LE, Mersey Drive, Besses, Manchester
House Prices in M45 8LE, Mersey Drive, Besses
Properties in M45 8LE have no sales history available within the last 3 years. M45 8LE is a postcode in Mersey Drive located in Besses, an area in Manchester, Bury, with 15 households².
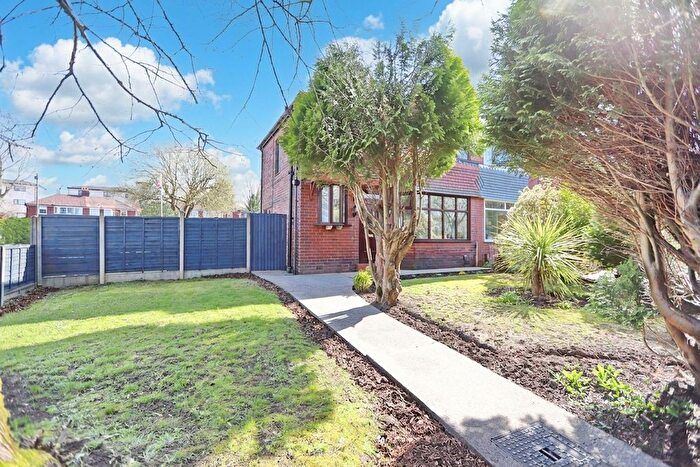
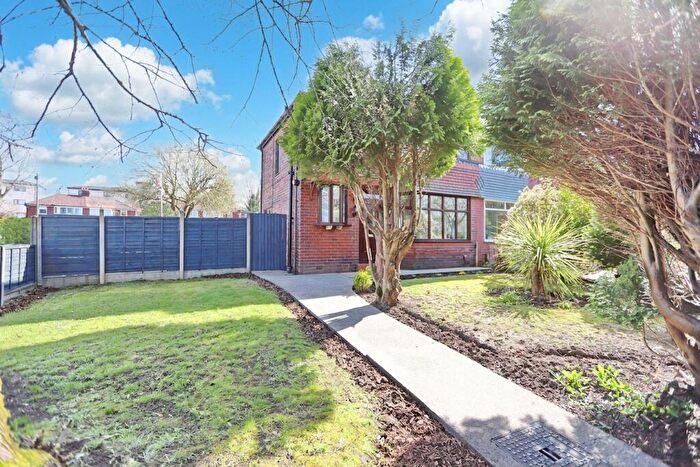
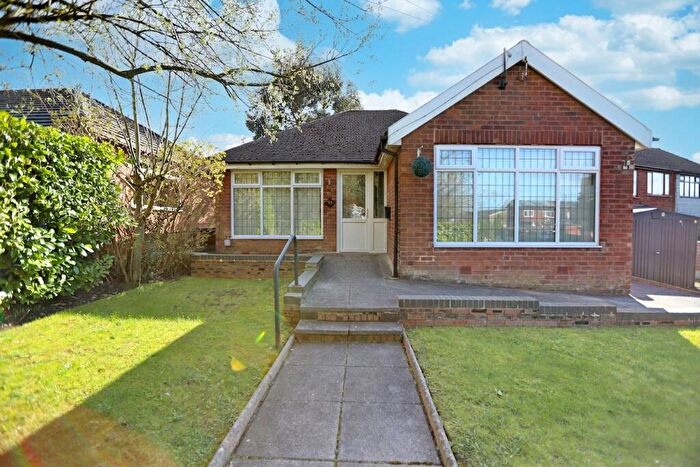
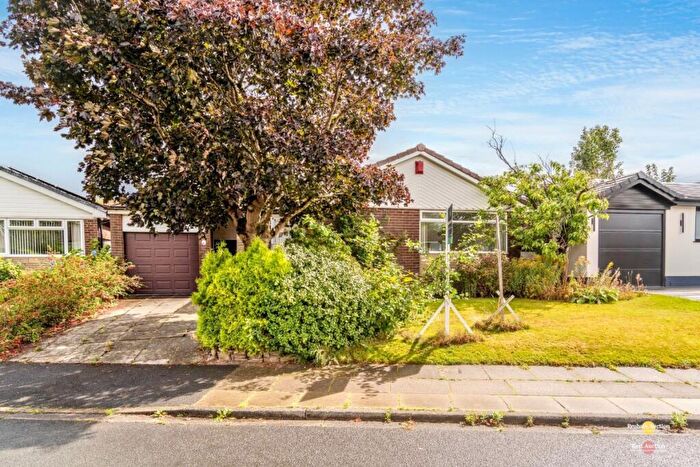
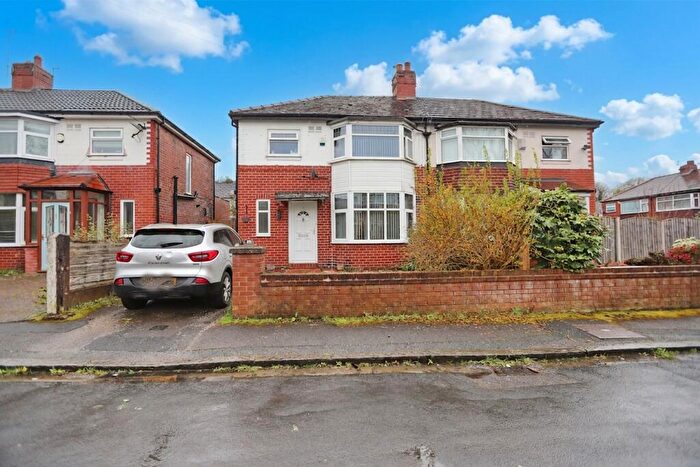
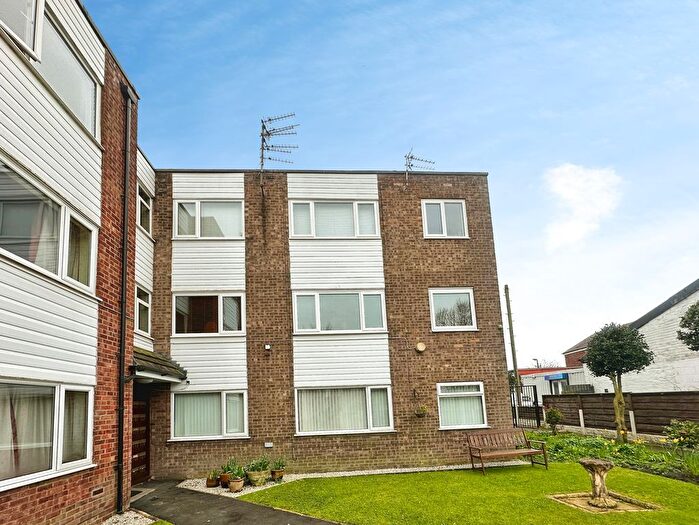
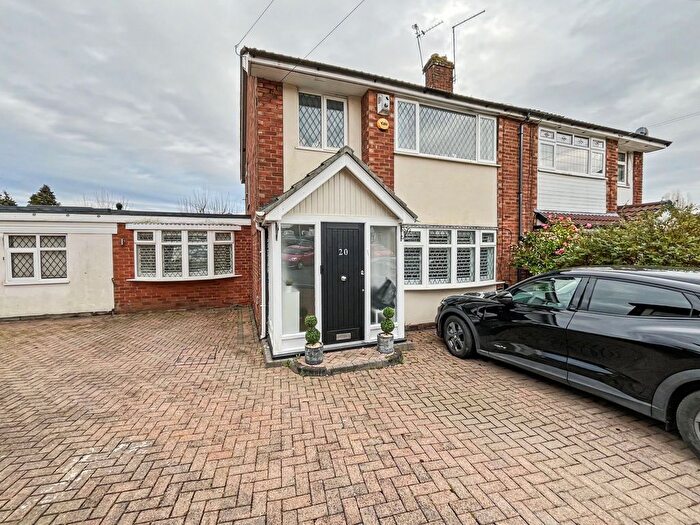
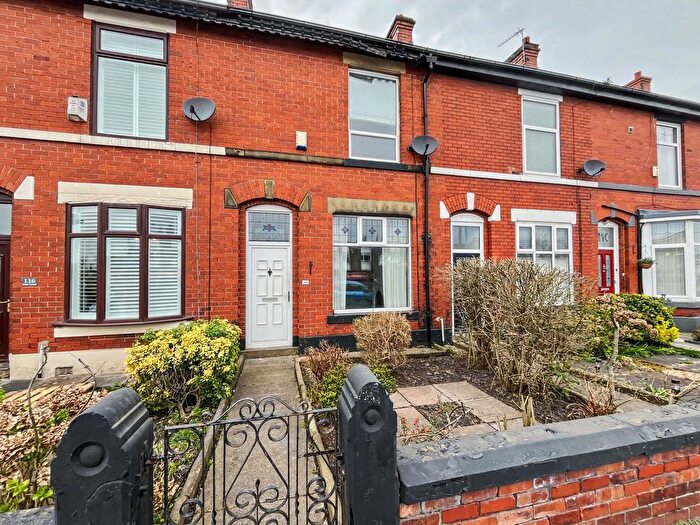
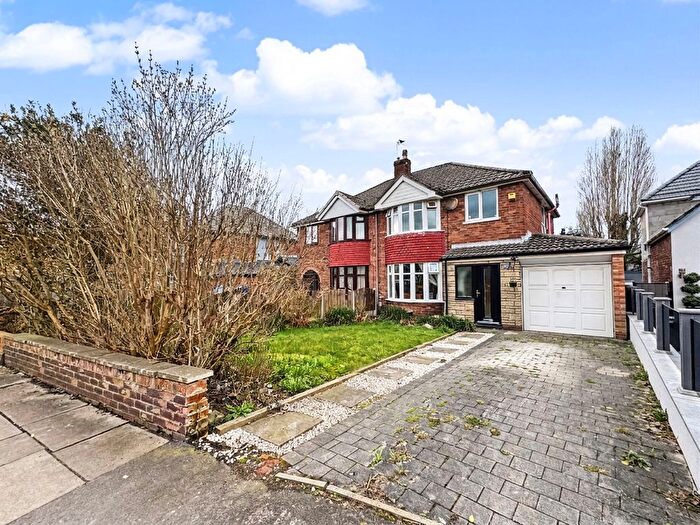
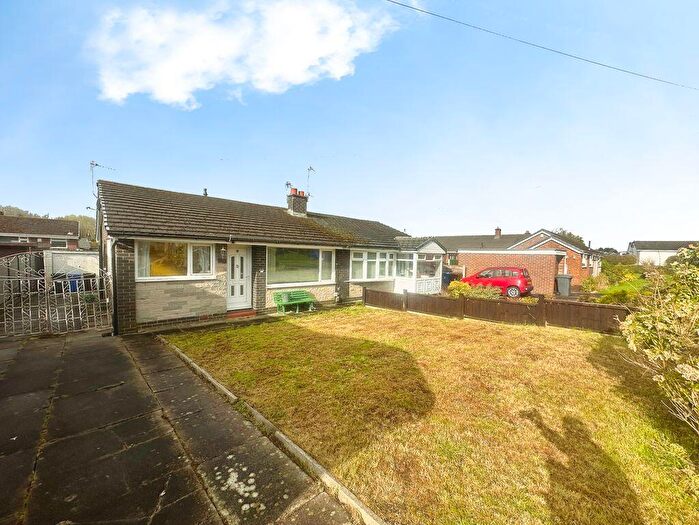
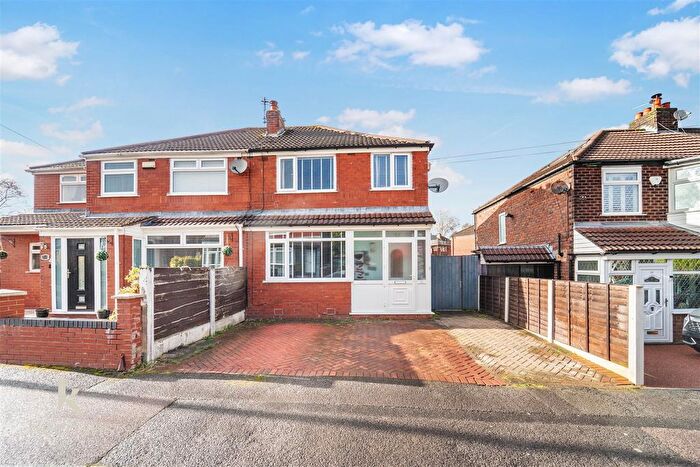
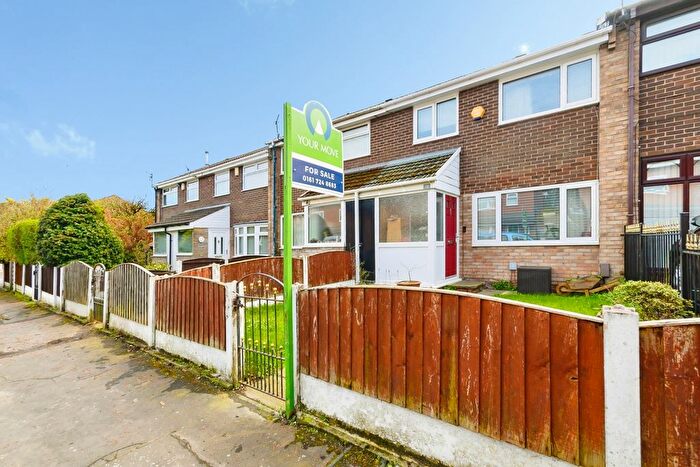
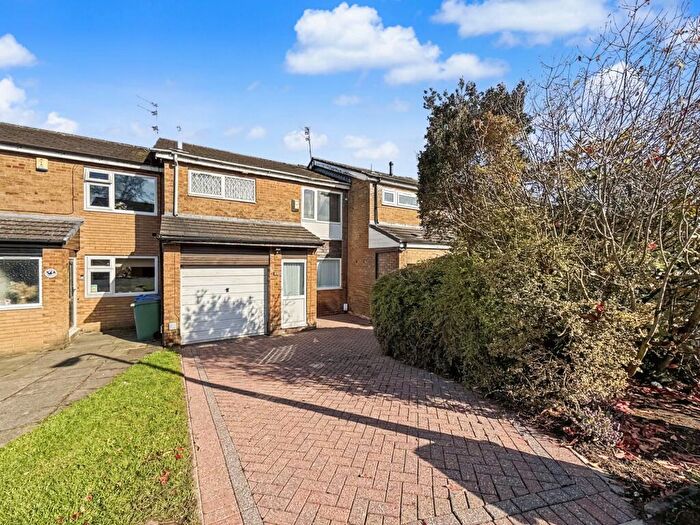
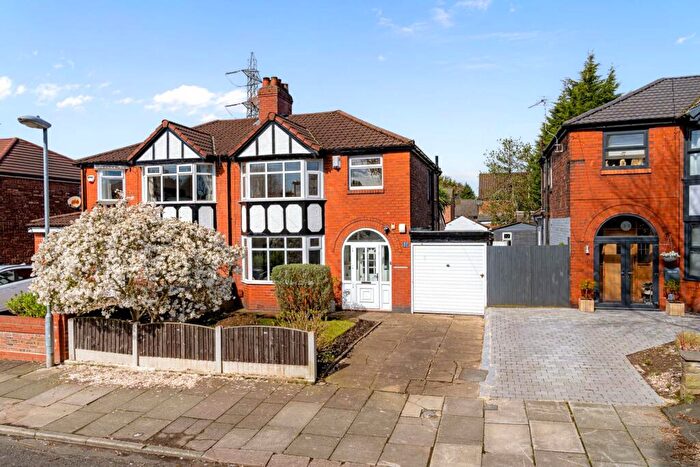
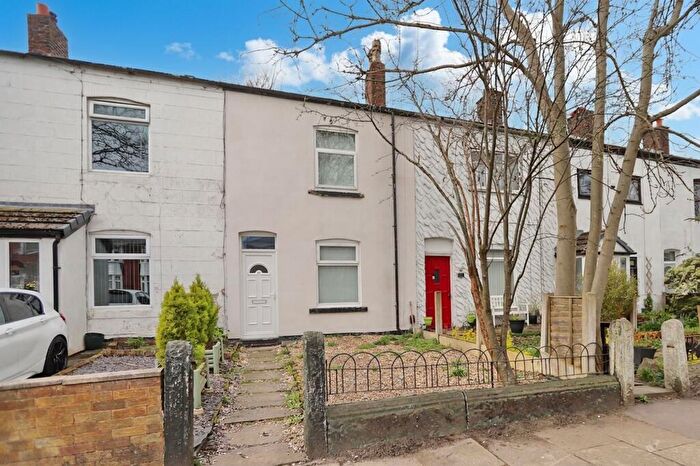
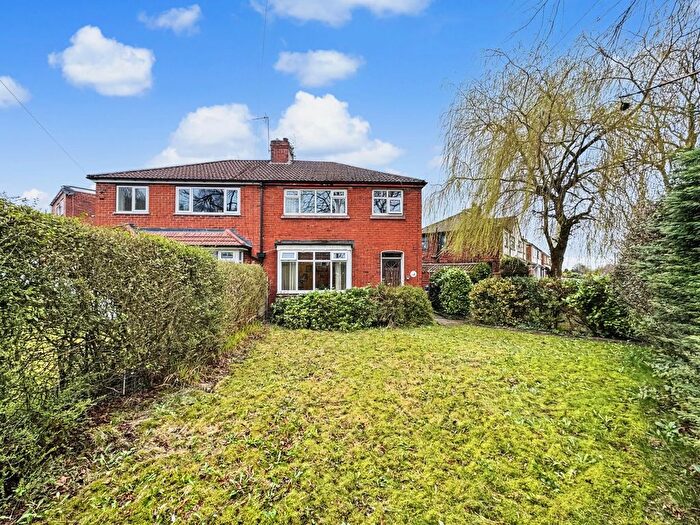
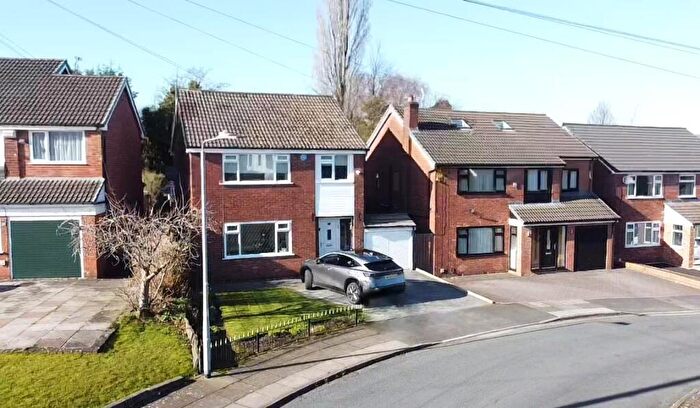
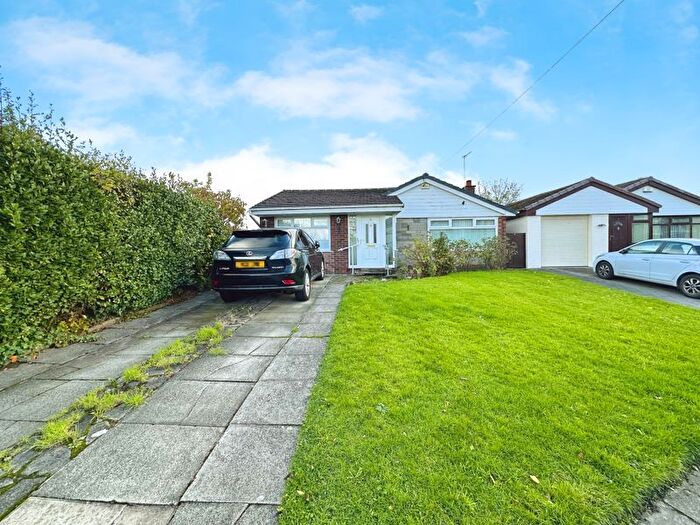
Properties for sale near M45 8LE, Mersey Drive


![]()
If you are looking to sell your house, let it out, or receive a property valuation, an expert can help you.
Click the button below to get started.


Price Paid in Mersey Drive, M45 8LE, Besses
27 Mersey Drive, M45 8LE, Besses Manchester
Property 27 has been sold 1 time. The last time it was sold was in 26/04/2018 and the sold price was £80,000.00.
This terraced house, sold as a freehold on 26/04/2018, is a 82 sqm mid-terrace house with an EPC rating of D.
| Date | Price | Property Type | Tenure | Classification |
|---|---|---|---|---|
| 26/04/2018 | £80,000.00 | Terraced House | freehold | Established Building |
49 Mersey Drive, M45 8LE, Besses Manchester
Property 49 has been sold 1 time. The last time it was sold was in 03/03/2008 and the sold price was £104,000.00.
This is a Terraced House which was sold as a freehold in 03/03/2008
| Date | Price | Property Type | Tenure | Classification |
|---|---|---|---|---|
| 03/03/2008 | £104,000.00 | Terraced House | freehold | Established Building |
35 Mersey Drive Whitefield, M45 8LE, Besses Manchester
This is a 42 square meter Top-floor Flat with an EPC rating of C. Currently, there is no transaction history available for this property.
Postcodes in Mersey Drive, Besses
Navigate through other locations in Mersey Drive, Besses, Manchester to see more property listings for sale or to rent.
Transport near M45 8LE, Mersey Drive
-
 Clifton Station
 -
Swinton (Greater Manchester) Station
-
Moorside Station
-
Kearsley Station
-
Mills Hill Station
-
Farnworth Station
-
Salford Crescent Station
-
Castleton Station
-
Moston Station
-
Manchester Victoria Station
House price paid reports for M45 8LE, Mersey Drive
Click on the buttons below to see price paid reports by year or property price:
- Price Paid By Year
Property Price Paid in M45 8LE, Mersey Drive by Year
The average sold property price by year was:
| Year | Average Sold Price | Price Change |
Sold Properties
|
|---|---|---|---|
| 2018 | £80,000 | -30% |
1 Property |
| 2008 | £104,000 | - |
1 Property |