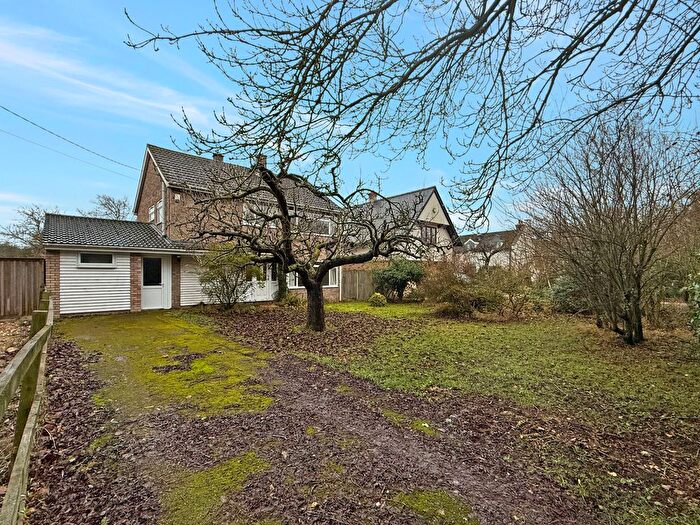
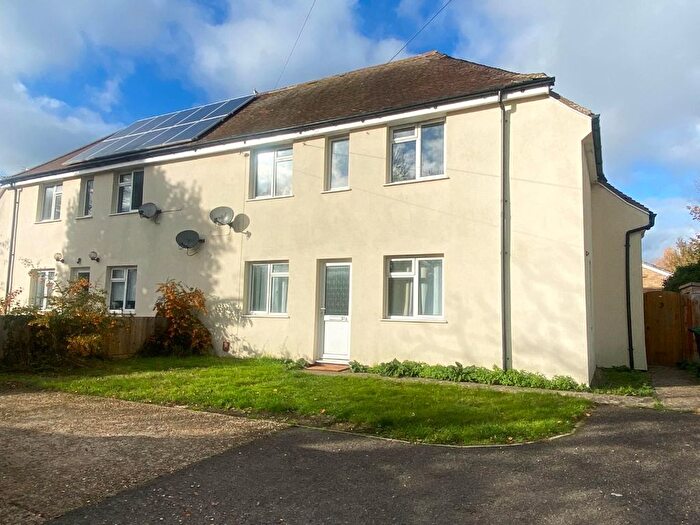
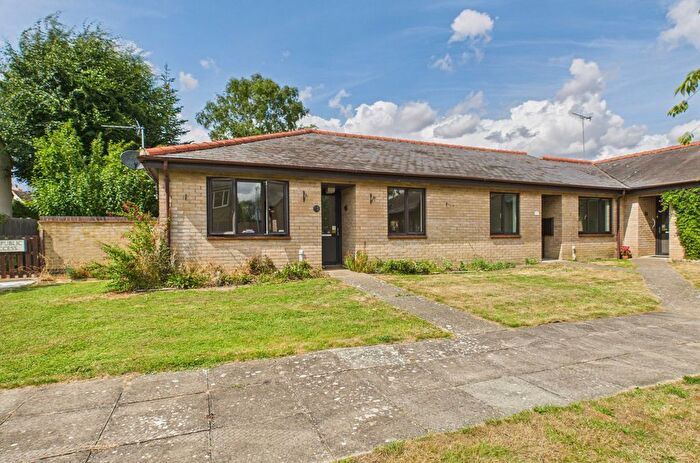
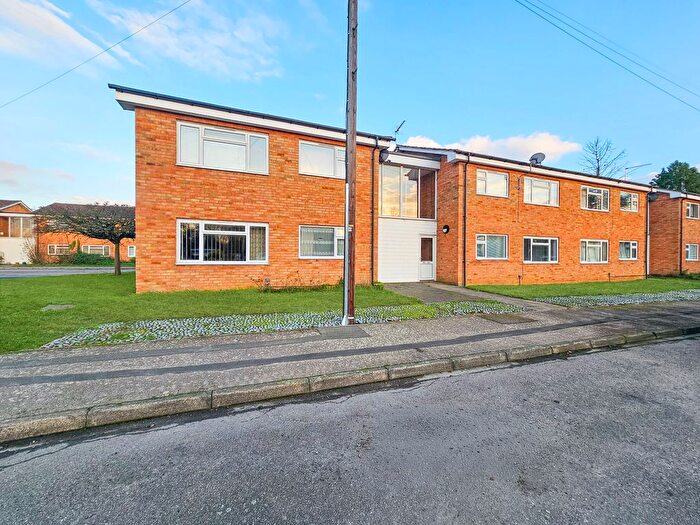
Houses for sale & to rent in Comberton, Cambridge
House Prices in Comberton
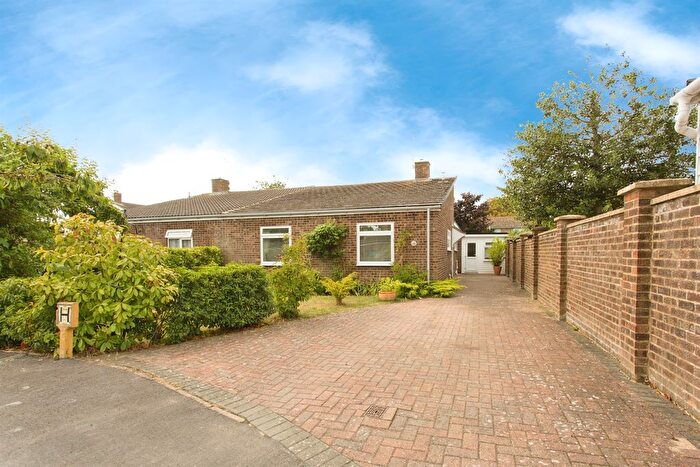
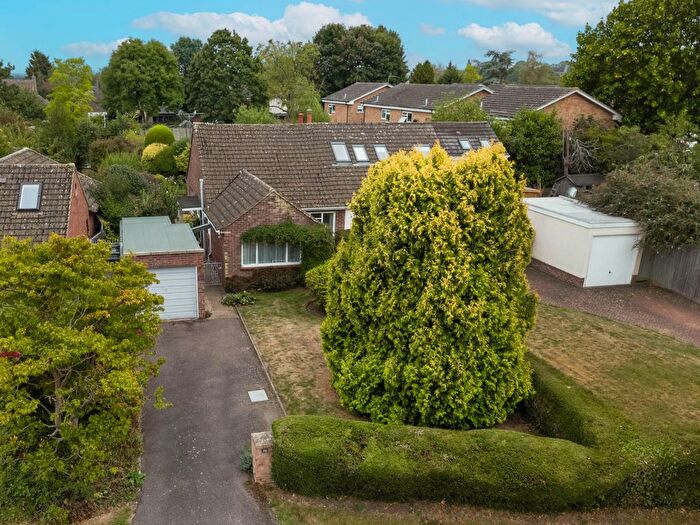
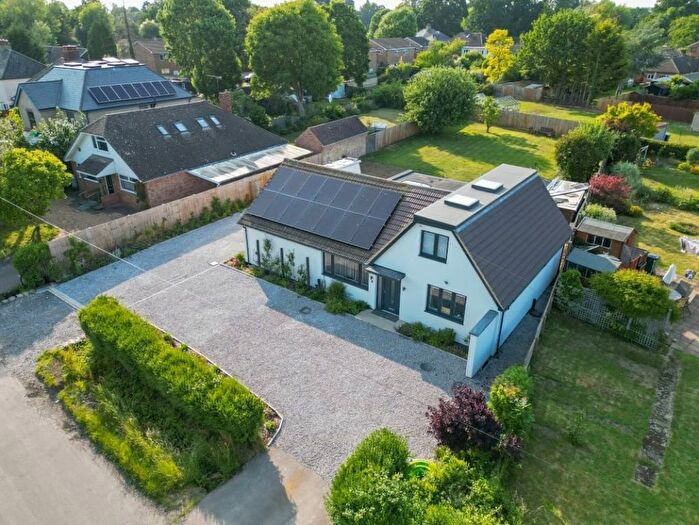
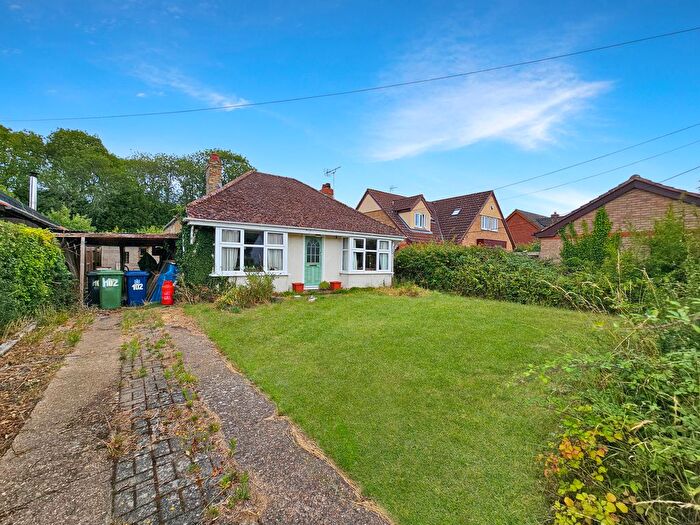
Properties in Comberton have an average house price of £499,527.00 and had 92 Property Transactions within the last 3 years¹.
Comberton is an area in Cambridge, Cambridgeshire with 945 households², where the most expensive property was sold for £1,297,500.00.
Properties for sale in Comberton
Previously listed properties in Comberton
Roads and Postcodes in Comberton
Navigate through our locations to find the location of your next house in Comberton, Cambridge for sale or to rent.
| Streets | Postcodes |
|---|---|
| Bakers Close | CB23 7DJ |
| Barrons Way | CB23 7DR CB23 7EQ |
| Barton Road | CB23 7BP CB23 7BS CB23 7BT CB23 7BU |
| Bush Close | CB23 7EG |
| Church Lane | CB23 7ED |
| Foxs Way | CB23 7DL |
| Green End | CB23 7DY |
| Harbour Avenue | CB23 7DD |
| Hillfield Road | CB23 7DB |
| Hines Lane | CB23 7BZ |
| Kentings | CB23 7DT |
| Long Road | CB23 7DG CB23 7DQ |
| Mallows Close | CB23 7GN |
| Milner Road | CB23 7DE |
| Nursery Way | CB23 7EL |
| Royston Lane | CB23 7EE |
| South Lane | CB23 7EA |
| South Street | CB23 7DZ |
| St Thomas Close | CB23 7DN |
| Swaynes Lane | CB23 7EF |
| The Covert | CB23 7DW |
| The Hawtreys | CB23 7EP |
| The Valley | CB23 7DF |
| Thornbury | CB23 7AP |
| West Street | CB23 7DS |
| Westcroft | CB23 7EJ |
| Westlands | CB23 7EH |
| Woottens Close | CB23 7DA |
Transport near Comberton
-
Cambridge Station
-
Foxton Station
-
Shepreth Station
-
Shelford Station
-
Cambridge North Station
-
Meldreth Station
-
Whittlesford Station
-
Waterbeach Station
-
Royston Station
- FAQ
- Price Paid By Year
- Property Type Price
Frequently asked questions about Comberton
What is the average price for a property for sale in Comberton?
The average price for a property for sale in Comberton is £499,527. This amount is 3% lower than the average price in Cambridge. There are 158 property listings for sale in Comberton.
What streets have the most expensive properties for sale in Comberton?
The streets with the most expensive properties for sale in Comberton are Mallows Close at an average of £985,000, Hines Lane at an average of £965,000 and West Street at an average of £779,400.
What streets have the most affordable properties for sale in Comberton?
The streets with the most affordable properties for sale in Comberton are Woottens Close at an average of £241,666, Bush Close at an average of £344,428 and Bakers Close at an average of £352,500.
Which train stations are available in or near Comberton?
Some of the train stations available in or near Comberton are Cambridge, Foxton and Shepreth.
Property Price Paid in Comberton by Year
The average sold property price by year was:
| Year | Average Sold Price | Price Change |
Sold Properties
|
|---|---|---|---|
| 2025 | £466,629 | -13% |
31 Properties |
| 2024 | £525,617 | 4% |
34 Properties |
| 2023 | £504,444 | -12% |
27 Properties |
| 2022 | £563,247 | 23% |
20 Properties |
| 2021 | £433,047 | 25% |
41 Properties |
| 2020 | £324,040 | -69% |
31 Properties |
| 2019 | £546,280 | 28% |
21 Properties |
| 2018 | £394,134 | -29% |
26 Properties |
| 2017 | £508,108 | 16% |
24 Properties |
| 2016 | £424,597 | 13% |
31 Properties |
| 2015 | £371,433 | 7% |
30 Properties |
| 2014 | £346,502 | 22% |
40 Properties |
| 2013 | £268,962 | 2% |
20 Properties |
| 2012 | £262,609 | -13% |
36 Properties |
| 2011 | £296,264 | 11% |
27 Properties |
| 2010 | £264,583 | -14% |
32 Properties |
| 2009 | £302,662 | 14% |
27 Properties |
| 2008 | £261,327 | -37% |
22 Properties |
| 2007 | £356,926 | 24% |
28 Properties |
| 2006 | £271,230 | -11% |
40 Properties |
| 2005 | £300,139 | 6% |
49 Properties |
| 2004 | £282,278 | 4% |
43 Properties |
| 2003 | £271,690 | 33% |
31 Properties |
| 2002 | £183,225 | 22% |
39 Properties |
| 2001 | £142,930 | -5% |
40 Properties |
| 2000 | £150,771 | 15% |
37 Properties |
| 1999 | £127,778 | 22% |
37 Properties |
| 1998 | £99,109 | -17% |
37 Properties |
| 1997 | £115,998 | 21% |
41 Properties |
| 1996 | £91,394 | -15% |
25 Properties |
| 1995 | £105,072 | - |
24 Properties |
Property Price per Property Type in Comberton
Here you can find historic sold price data in order to help with your property search.
The average Property Paid Price for specific property types in the last three years are:
| Property Type | Average Sold Price | Sold Properties |
|---|---|---|
| Semi Detached House | £416,444.00 | 36 Semi Detached Houses |
| Terraced House | £374,375.00 | 12 Terraced Houses |
| Flat | £204,500.00 | 6 Flats |
| Detached House | £664,342.00 | 38 Detached Houses |

