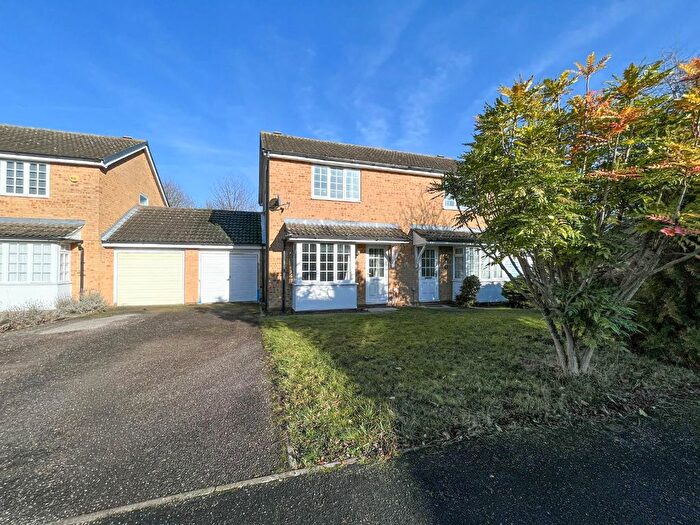
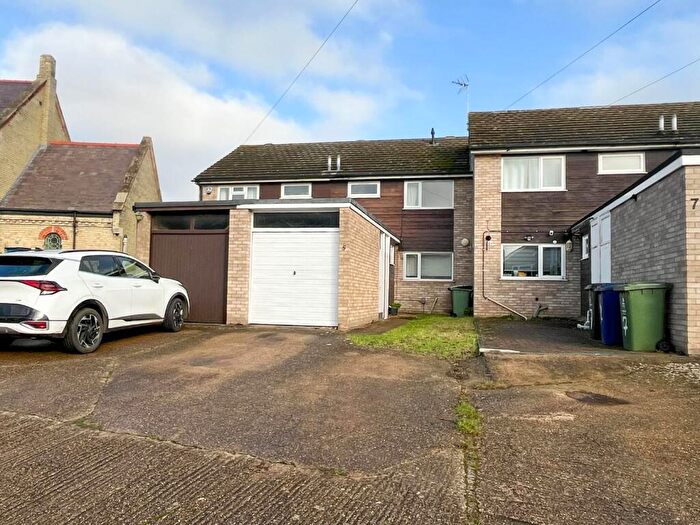
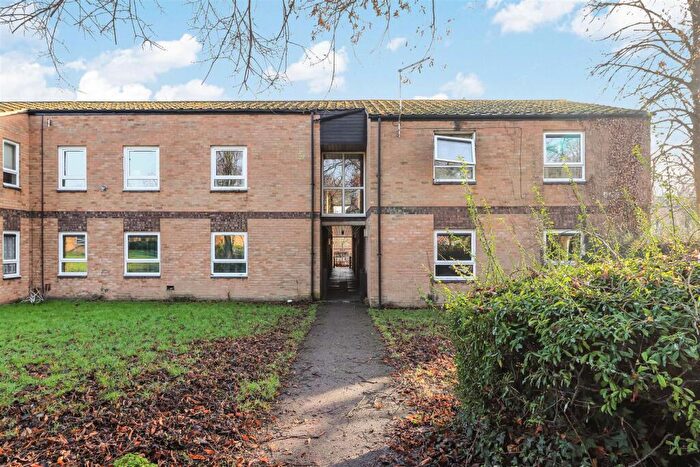
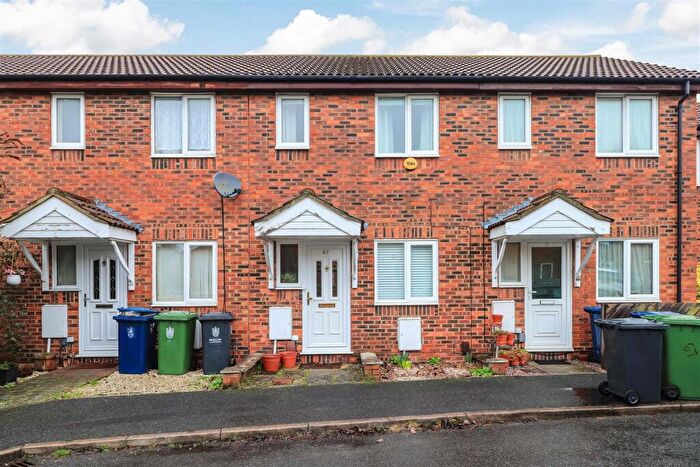
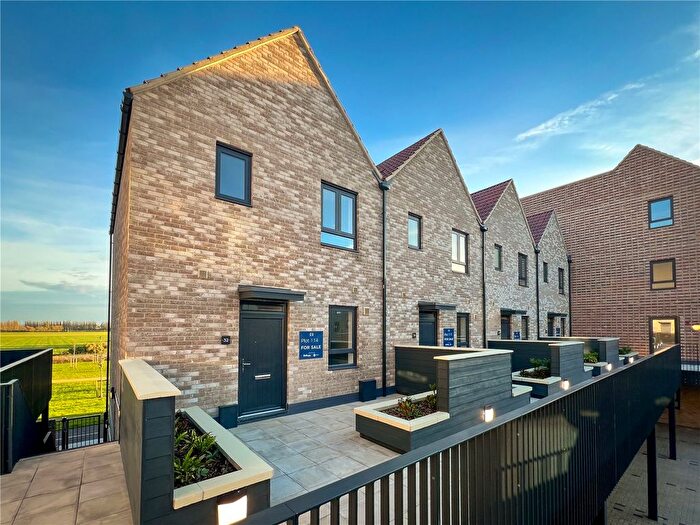
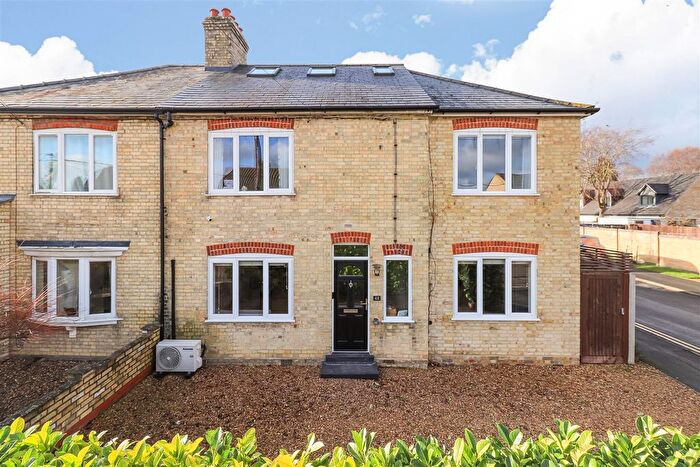
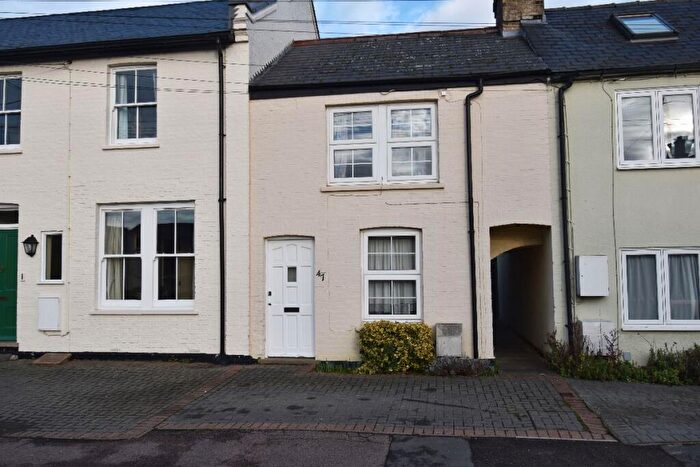
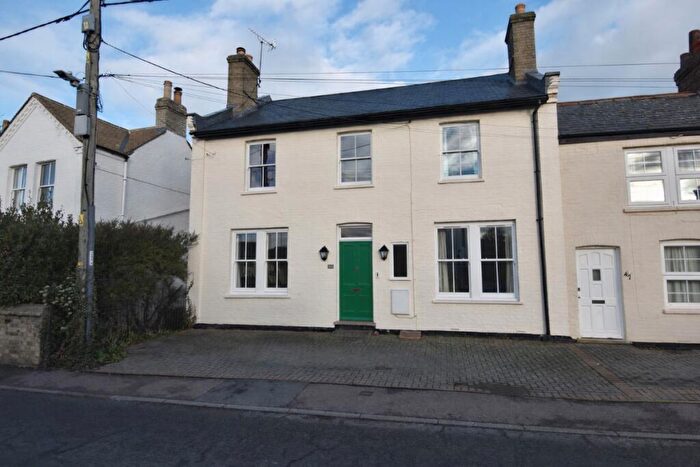
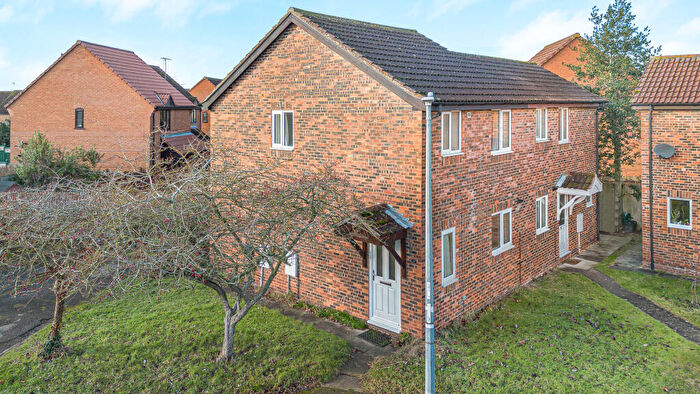
Houses for sale & to rent in Teversham, Cambridge
House Prices in Teversham
Properties in Teversham have an average house price of £394,383.00 and had 110 Property Transactions within the last 3 years¹.
Teversham is an area in Cambridge, Cambridgeshire with 1,182 households², where the most expensive property was sold for £1,250,000.00.
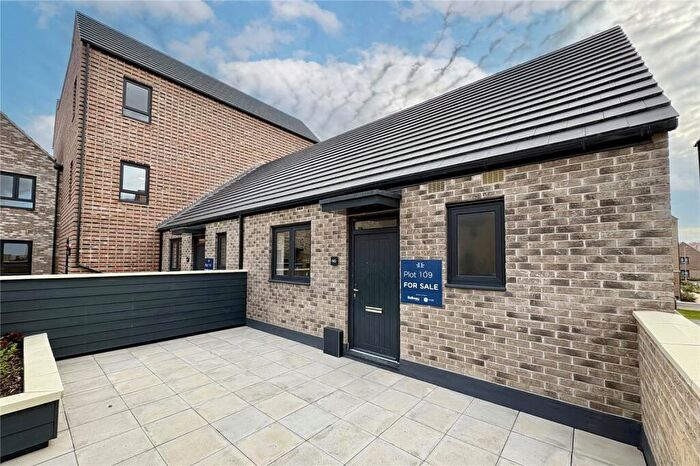
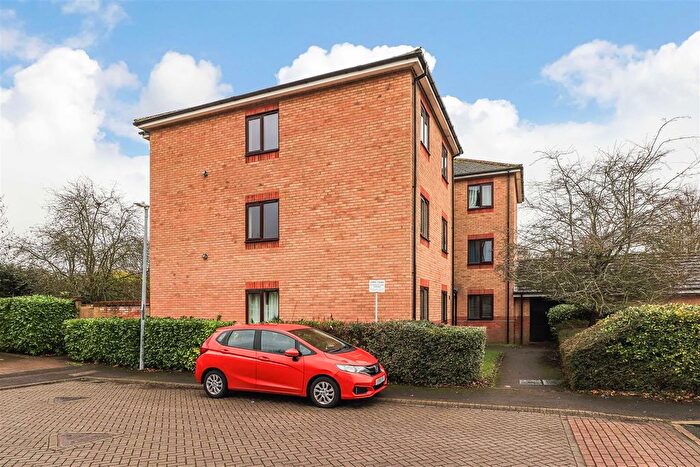
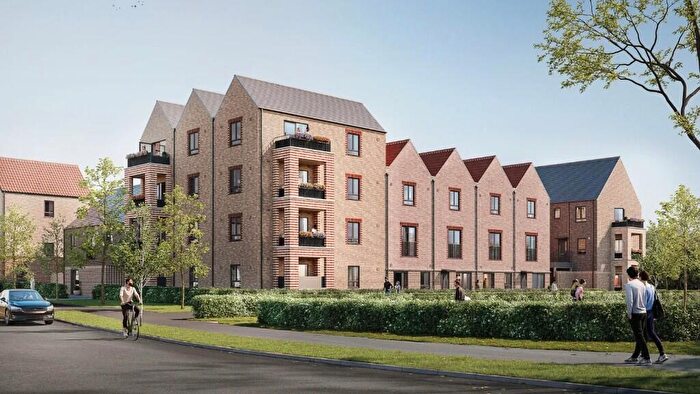
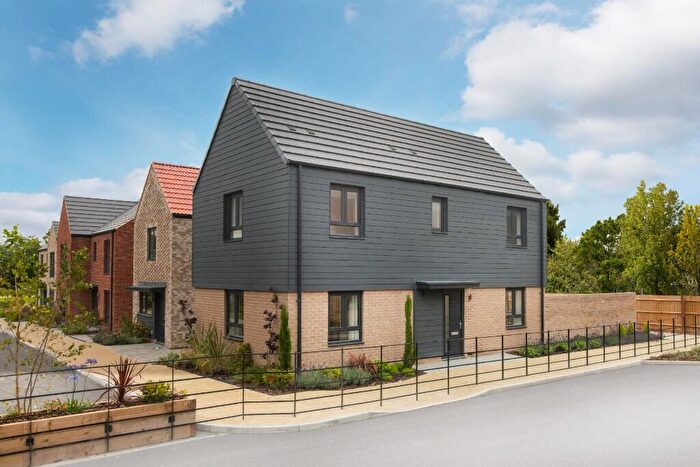
Properties for sale in Teversham
Roads and Postcodes in Teversham
Navigate through our locations to find the location of your next house in Teversham, Cambridge for sale or to rent.
| Streets | Postcodes |
|---|---|
| Antelope Way | CB1 9GT |
| Borley Way | CB1 9BT |
| Buffalo Way | CB1 9GR |
| Capuchin Court | CB1 9GP |
| Caribou Way | CB1 9XF CB1 9XG |
| Cherry Hinton Road | CB1 9AQ |
| Church Road | CB1 9AZ |
| Dolphin Close | CB1 9GU |
| Eland Way | CB1 9XH CB1 9XQ |
| Fennec Close | CB1 9GG |
| Ferndale | CB1 9AL |
| Fulbourn Old Drift | CB1 9LR |
| Fulbourn Road | CB1 9AJ |
| Glenville Close | CB1 9BD |
| High Street | CB1 9AS CB1 9BJ |
| Impala Drive | CB1 9XJ CB1 9XL |
| James Nurse Close | CB1 9LJ |
| Lady Jermy Way | CB1 9BG |
| Lemur Drive | CB1 9XZ |
| Loris Court | CB1 9GF |
| Lucerne Close | CB1 9SB |
| Mandrill Close | CB1 9TN |
| Marshalls Close | CB1 9AR |
| Meadowlands Road | CB5 8SA |
| Newmarket Road | CB5 8RT |
| Panther Way | CB1 9GS |
| Pembroke Way | CB1 9AD |
| Roedeer Close | CB1 9YY |
| Rush Grove | CB1 9NF |
| Sable Close | CB1 9YX |
| Sheppard Way | CB1 9AX |
| Spurgeons Close | CB1 9BN |
| Tamarin Gardens | CB1 9GH CB1 9GJ CB1 9GQ |
| The Lynx | CB1 9GE |
| Thetford Terrace | CB5 8SB |
| Thulborn Close | CB1 9AU |
| Whitgift Road | CB1 9AY |
Transport near Teversham
- FAQ
- Price Paid By Year
- Property Type Price
Frequently asked questions about Teversham
What is the average price for a property for sale in Teversham?
The average price for a property for sale in Teversham is £394,383. This amount is 23% lower than the average price in Cambridge. There are 498 property listings for sale in Teversham.
What streets have the most expensive properties for sale in Teversham?
The streets with the most expensive properties for sale in Teversham are High Street at an average of £753,444, Lady Jermy Way at an average of £706,500 and Fennec Close at an average of £611,250.
What streets have the most affordable properties for sale in Teversham?
The streets with the most affordable properties for sale in Teversham are Thetford Terrace at an average of £208,333, Loris Court at an average of £236,437 and Newmarket Road at an average of £261,000.
Which train stations are available in or near Teversham?
Some of the train stations available in or near Teversham are Cambridge, Cambridge North and Shelford.
Property Price Paid in Teversham by Year
The average sold property price by year was:
| Year | Average Sold Price | Price Change |
Sold Properties
|
|---|---|---|---|
| 2025 | £369,500 | -8% |
26 Properties |
| 2024 | £399,155 | -2% |
46 Properties |
| 2023 | £405,633 | 4% |
38 Properties |
| 2022 | £390,429 | 1% |
35 Properties |
| 2021 | £386,317 | 14% |
36 Properties |
| 2020 | £333,755 | -15% |
31 Properties |
| 2019 | £383,374 | 9% |
26 Properties |
| 2018 | £349,702 | -1% |
37 Properties |
| 2017 | £353,990 | 4% |
51 Properties |
| 2016 | £338,838 | -1% |
37 Properties |
| 2015 | £340,745 | 26% |
46 Properties |
| 2014 | £253,664 | 4% |
48 Properties |
| 2013 | £243,686 | 4% |
45 Properties |
| 2012 | £232,742 | 1% |
35 Properties |
| 2011 | £231,492 | -1% |
40 Properties |
| 2010 | £233,640 | 15% |
41 Properties |
| 2009 | £198,909 | -5% |
49 Properties |
| 2008 | £208,046 | 2% |
27 Properties |
| 2007 | £204,369 | 12% |
53 Properties |
| 2006 | £179,290 | -9% |
78 Properties |
| 2005 | £194,869 | 11% |
80 Properties |
| 2004 | £172,733 | -5% |
63 Properties |
| 2003 | £182,102 | 7% |
91 Properties |
| 2002 | £168,718 | 31% |
99 Properties |
| 2001 | £115,675 | - |
92 Properties |
| 2000 | £115,709 | 15% |
99 Properties |
| 1999 | £98,734 | 23% |
121 Properties |
| 1998 | £76,027 | 15% |
104 Properties |
| 1997 | £64,429 | -3% |
104 Properties |
| 1996 | £66,513 | 3% |
75 Properties |
| 1995 | £64,813 | - |
75 Properties |
Property Price per Property Type in Teversham
Here you can find historic sold price data in order to help with your property search.
The average Property Paid Price for specific property types in the last three years are:
| Property Type | Average Sold Price | Sold Properties |
|---|---|---|
| Semi Detached House | £428,655.00 | 20 Semi Detached Houses |
| Detached House | £627,807.00 | 26 Detached Houses |
| Terraced House | £335,792.00 | 38 Terraced Houses |
| Flat | £220,230.00 | 26 Flats |

