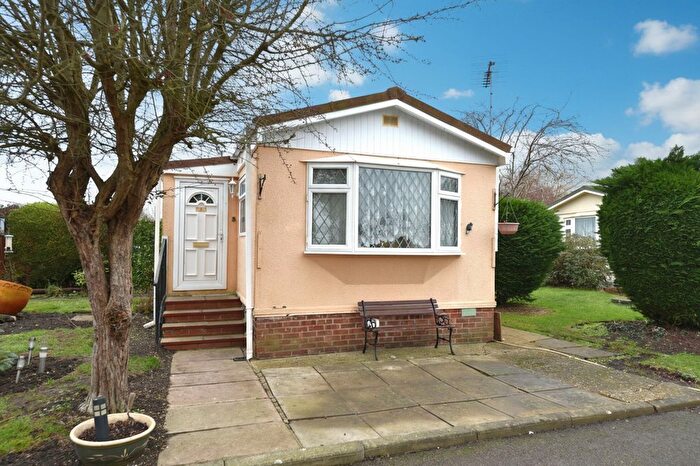
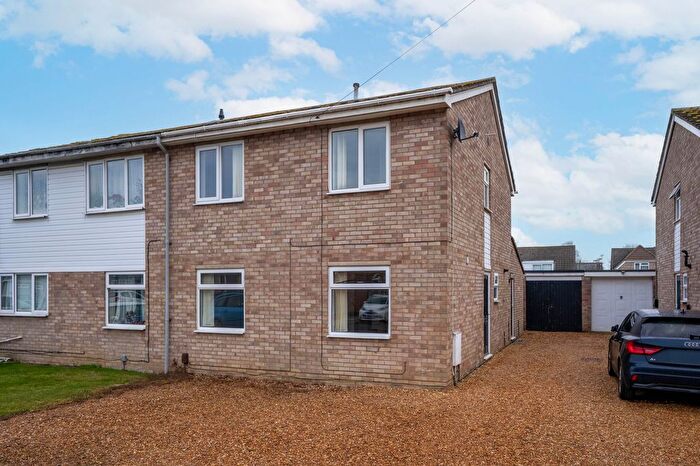
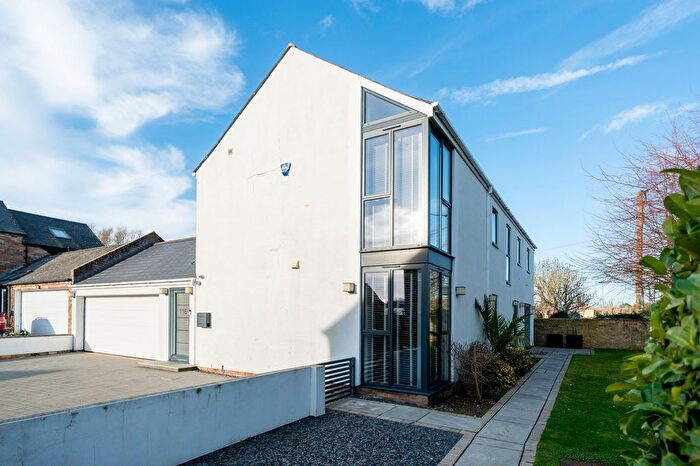
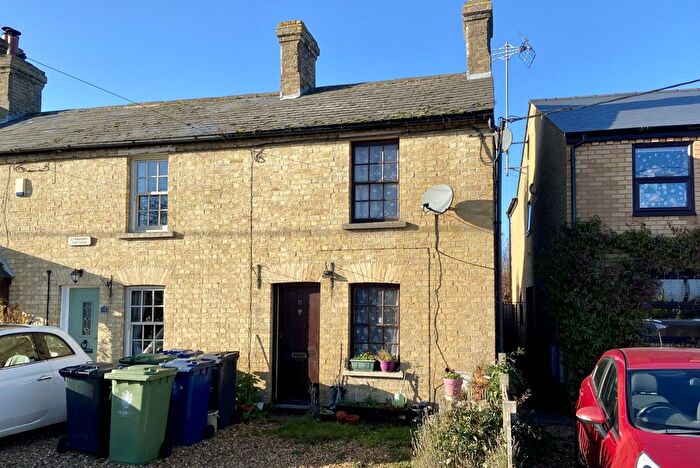
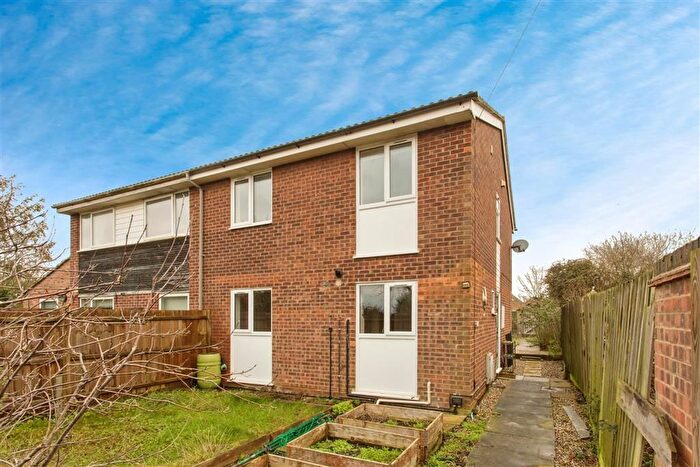
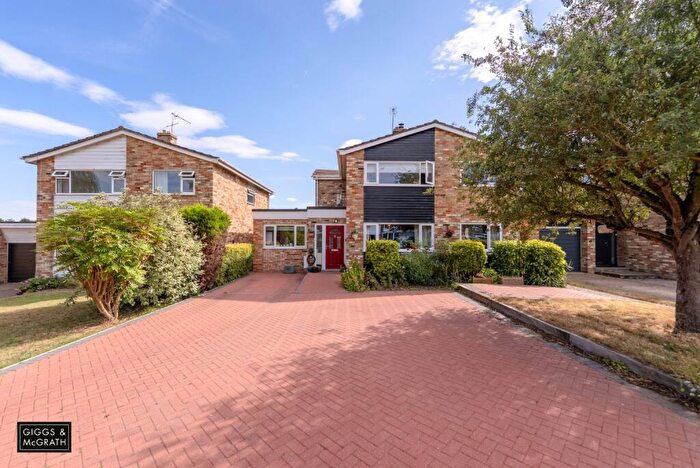
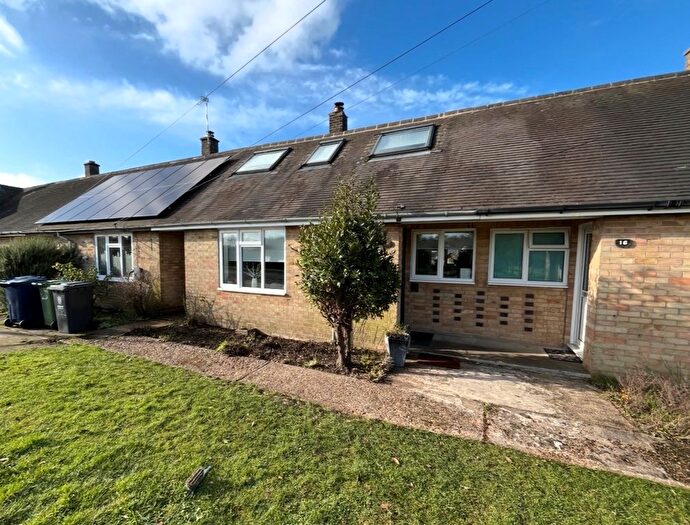
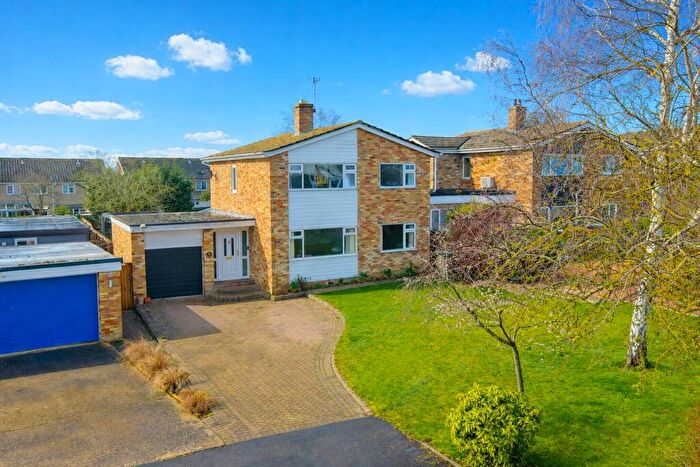
Houses for sale & to rent in Swavesey, Cambridge
House Prices in Swavesey
Properties in Swavesey have an average house price of £420,472.00 and had 72 Property Transactions within the last 3 years¹.
Swavesey is an area in Cambridge, Cambridgeshire with 1,005 households², where the most expensive property was sold for £950,000.00.
Properties for sale in Swavesey
Previously listed properties in Swavesey
Roads and Postcodes in Swavesey
Navigate through our locations to find the location of your next house in Swavesey, Cambridge for sale or to rent.
| Streets | Postcodes |
|---|---|
| Anderson Road | CB24 4FQ CB24 4UL |
| Barwell Close | CB24 4AN |
| Black Horse Lane | CB24 4QR |
| Boxworth End | CB24 4QT CB24 4RA CB24 4GL |
| Buckingway Business Park | CB24 4AE CB24 4UQ |
| Burgess Close | CB24 4AP |
| Carters Way | CB24 4RZ |
| Chantry Close | CB24 4GJ |
| Chequers Court | CB24 4QW |
| Cow Fen Drove | CB24 4QQ |
| Cygnus Business Park | CB24 4AA |
| Gale Close | CB24 4AL |
| Gibraltar Lane | CB24 4RR CB24 4RS |
| Greenside Close | CB24 4RF |
| Hale Road | CB24 4QP |
| High Street | CB24 4QU |
| Hobbledodds Close | CB24 4QH |
| Home Close | CB24 4AF |
| Huntingdon Road | CB23 8DW CB24 4RE CB23 8DN CB23 8DP CB24 4SD |
| Larke Cottages | CB24 4TF |
| Long Road | CB24 4AJ |
| Market Street | CB24 4QG |
| Middle Watch | CB24 4RN CB24 4RP CB24 4RW CB24 4AG |
| Moat Way | CB24 4GQ CB24 4TR |
| Over Road | CB24 4QL CB24 4QZ |
| Pine Grove Park | CB24 4RG |
| Priory Avenue | CB24 4RY |
| Ramper Road | CB24 4RU CB24 4RX |
| Rose & Crown Road | CB24 4RB |
| Rowles Way | CB24 4UG |
| School Lane | CB24 4RL |
| Station Road | CB24 4QJ |
| Swavesey Road | CB24 4SE |
| Taylors Lane | CB24 4QN |
| Thistle Green | CB24 4RJ CB24 4SA |
| Tipplers Road | CB24 4RQ |
| Turnbridge Court | CB24 4GH |
| Uttons Drove | CB24 4AD |
| Wallmans Lane | CB24 4QY |
| Whitegate Close | CB24 4TT |
| Whitton Close | CB24 4RT |
| Whitton Court | CB24 4AB |
| CB24 4AH CB24 4WZ |
Transport near Swavesey
- FAQ
- Price Paid By Year
- Property Type Price
Frequently asked questions about Swavesey
What is the average price for a property for sale in Swavesey?
The average price for a property for sale in Swavesey is £420,472. This amount is 18% lower than the average price in Cambridge. There are 289 property listings for sale in Swavesey.
What streets have the most expensive properties for sale in Swavesey?
The streets with the most expensive properties for sale in Swavesey are Rose & Crown Road at an average of £940,000, Hale Road at an average of £885,000 and Black Horse Lane at an average of £610,000.
What streets have the most affordable properties for sale in Swavesey?
The streets with the most affordable properties for sale in Swavesey are Whitton Close at an average of £282,500, Whitegate Close at an average of £288,166 and Carters Way at an average of £300,932.
Which train stations are available in or near Swavesey?
Some of the train stations available in or near Swavesey are Huntingdon, Cambridge North and Waterbeach.
Property Price Paid in Swavesey by Year
The average sold property price by year was:
| Year | Average Sold Price | Price Change |
Sold Properties
|
|---|---|---|---|
| 2025 | £421,786 | -3% |
26 Properties |
| 2024 | £432,557 | 7% |
26 Properties |
| 2023 | £403,054 | -12% |
20 Properties |
| 2022 | £450,553 | 23% |
28 Properties |
| 2021 | £345,149 | -10% |
57 Properties |
| 2020 | £379,062 | 15% |
51 Properties |
| 2019 | £321,077 | -7% |
29 Properties |
| 2018 | £344,263 | -7% |
34 Properties |
| 2017 | £368,039 | 4% |
49 Properties |
| 2016 | £354,070 | 10% |
41 Properties |
| 2015 | £317,963 | 19% |
43 Properties |
| 2014 | £257,485 | 2% |
59 Properties |
| 2013 | £252,845 | 7% |
37 Properties |
| 2012 | £234,386 | -4% |
30 Properties |
| 2011 | £244,391 | 0,1% |
44 Properties |
| 2010 | £244,047 | 15% |
24 Properties |
| 2009 | £207,874 | -14% |
36 Properties |
| 2008 | £237,312 | 4% |
30 Properties |
| 2007 | £227,080 | 11% |
57 Properties |
| 2006 | £201,585 | 5% |
60 Properties |
| 2005 | £192,511 | 9% |
42 Properties |
| 2004 | £174,471 | 4% |
58 Properties |
| 2003 | £167,435 | 6% |
67 Properties |
| 2002 | £158,040 | 15% |
68 Properties |
| 2001 | £134,946 | 7% |
66 Properties |
| 2000 | £125,997 | 24% |
89 Properties |
| 1999 | £95,316 | 9% |
111 Properties |
| 1998 | £86,679 | -1% |
81 Properties |
| 1997 | £87,544 | 11% |
78 Properties |
| 1996 | £77,526 | 6% |
60 Properties |
| 1995 | £73,000 | - |
23 Properties |
Property Price per Property Type in Swavesey
Here you can find historic sold price data in order to help with your property search.
The average Property Paid Price for specific property types in the last three years are:
| Property Type | Average Sold Price | Sold Properties |
|---|---|---|
| Semi Detached House | £336,852.00 | 23 Semi Detached Houses |
| Detached House | £554,048.00 | 31 Detached Houses |
| Terraced House | £313,187.00 | 16 Terraced Houses |
| Flat | £169,975.00 | 2 Flats |

