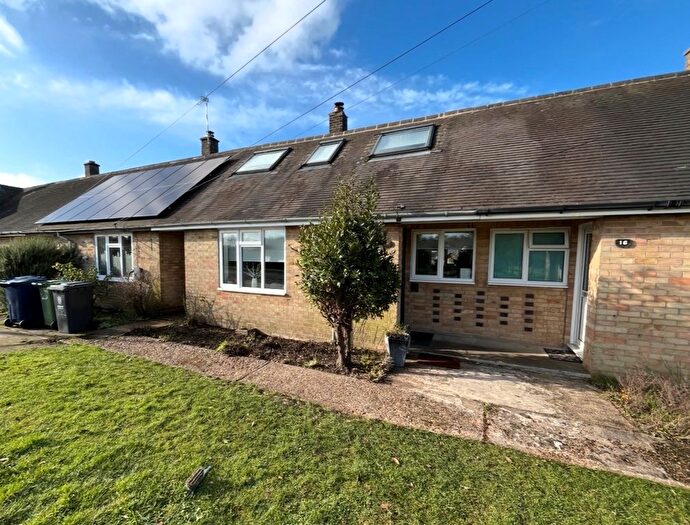
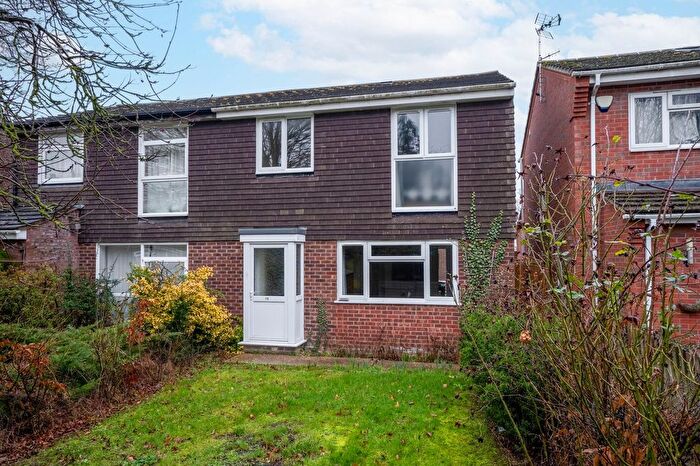
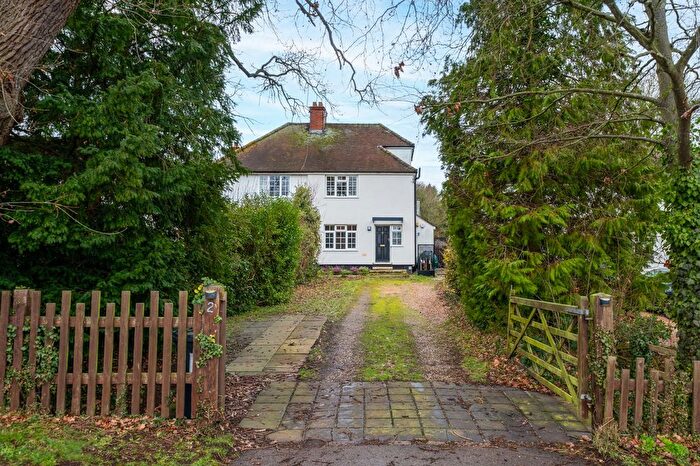
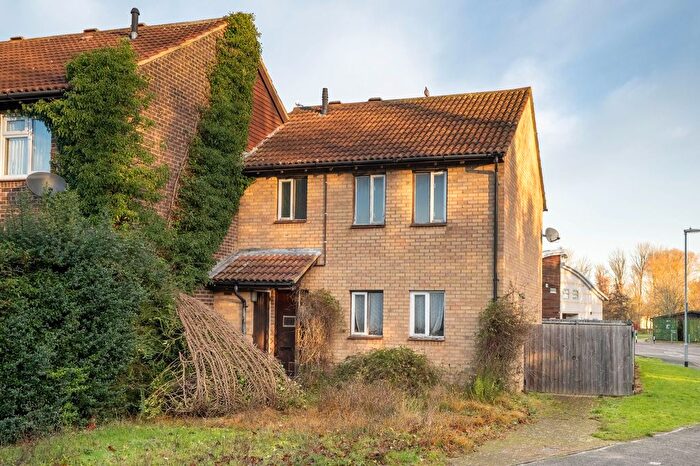
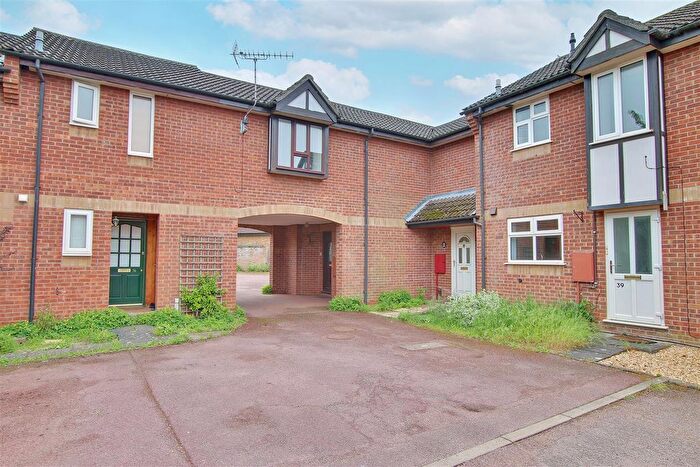
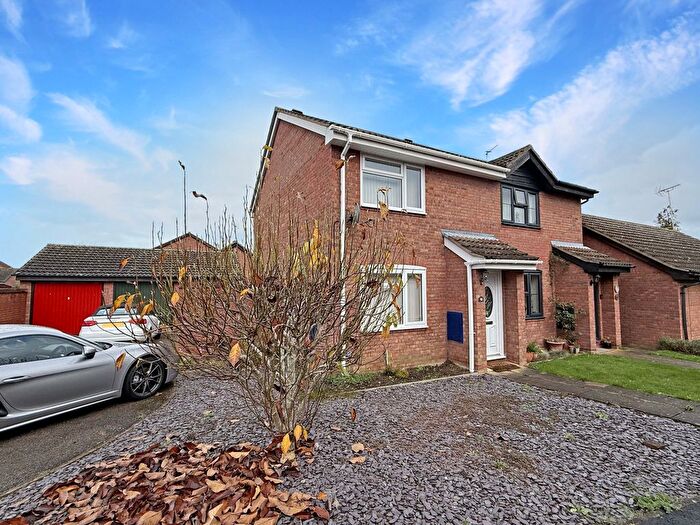
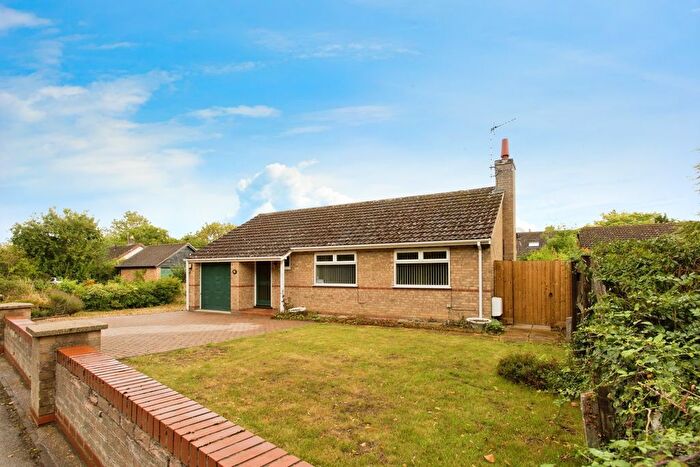
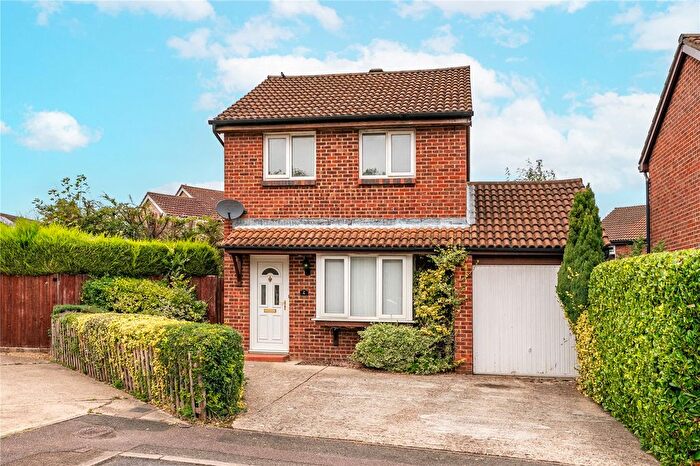
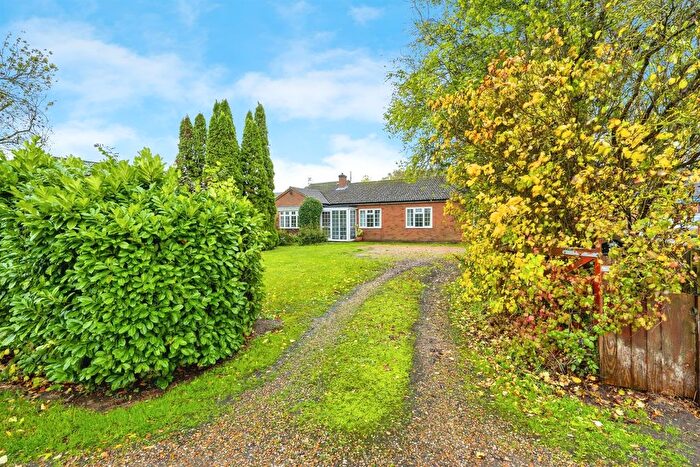
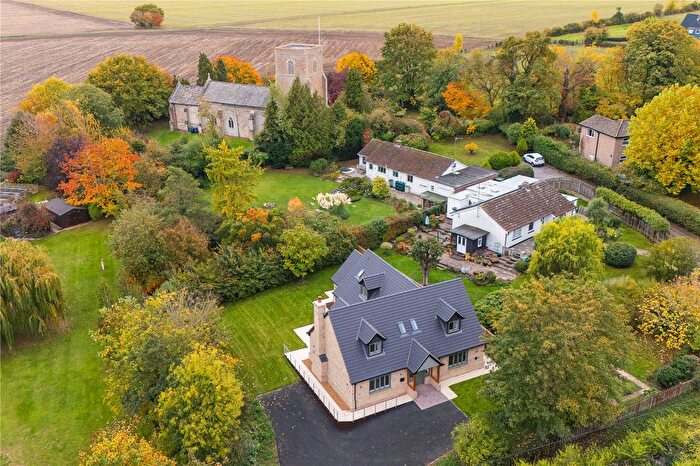
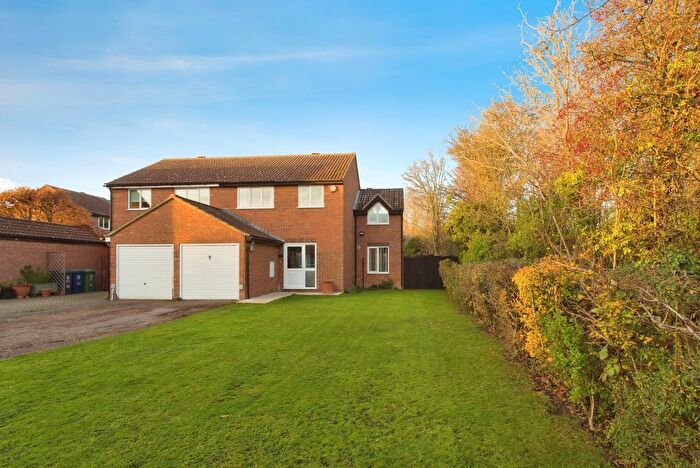
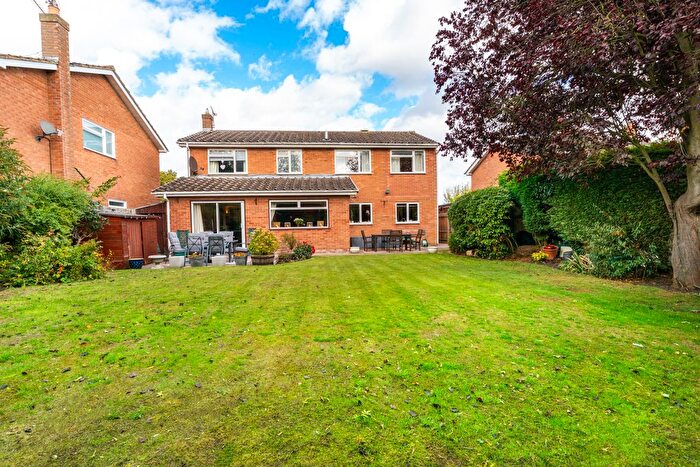
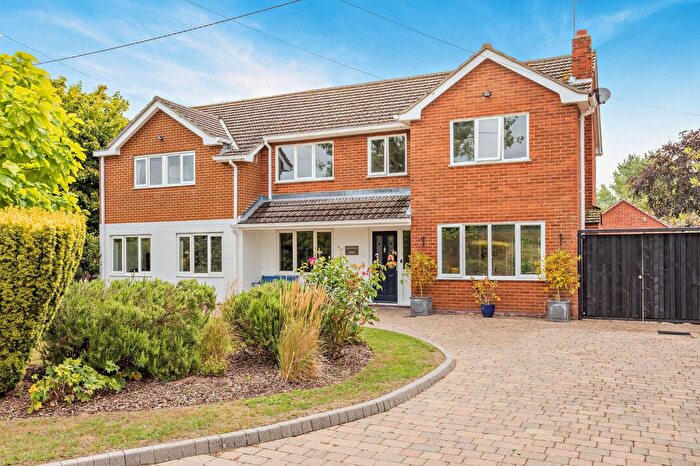
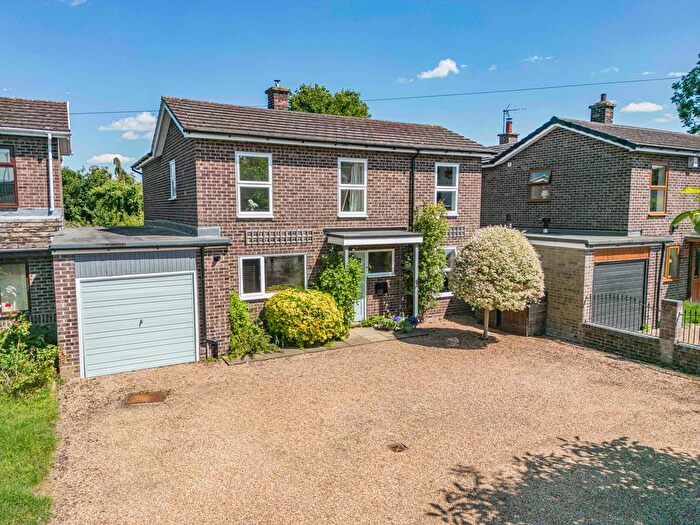
Houses for sale & to rent in Bar Hill, Cambridge
House Prices in Bar Hill
Properties in Bar Hill have an average house price of £375,350.00 and had 198 Property Transactions within the last 3 years¹.
Bar Hill is an area in Cambridge, Cambridgeshire with 2,117 households², where the most expensive property was sold for £950,000.00.
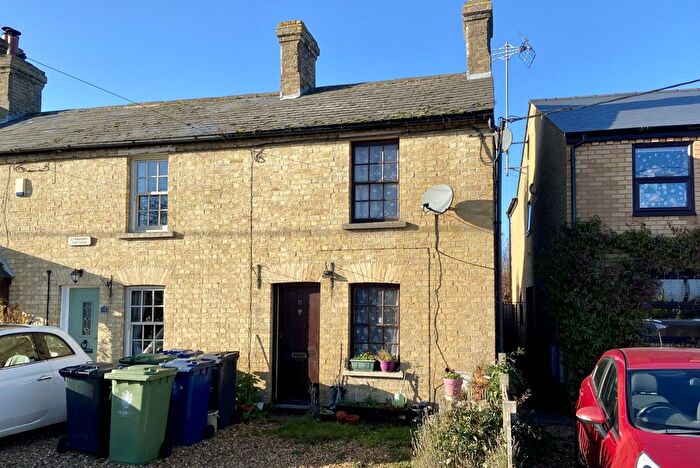
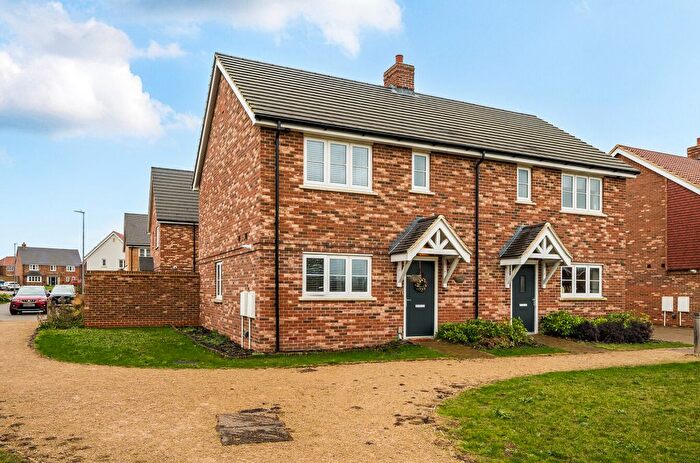
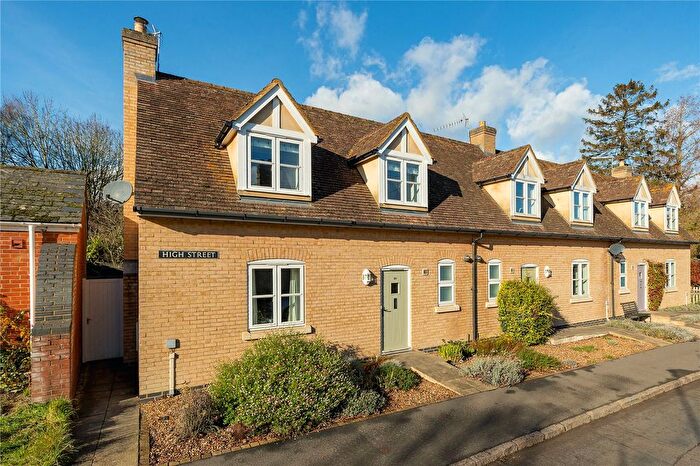
Properties for sale in Bar Hill
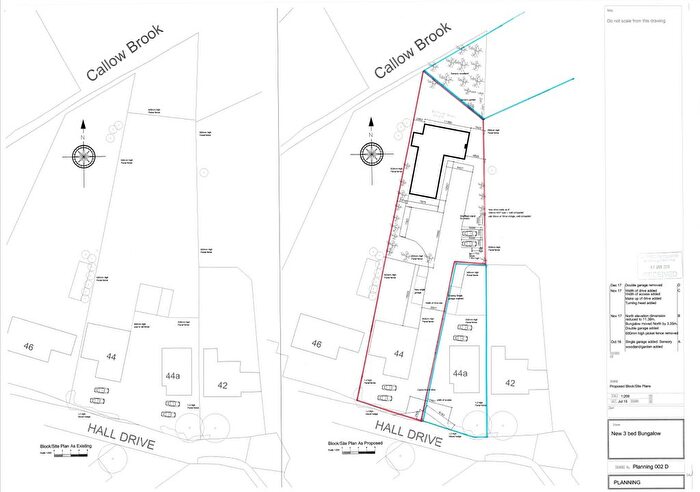
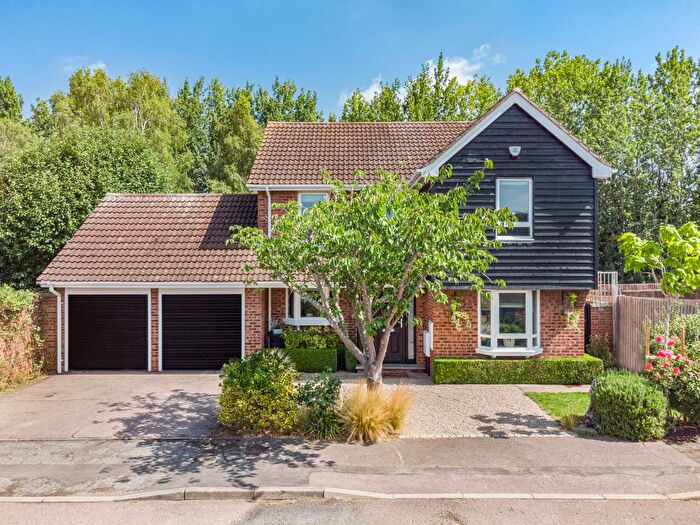
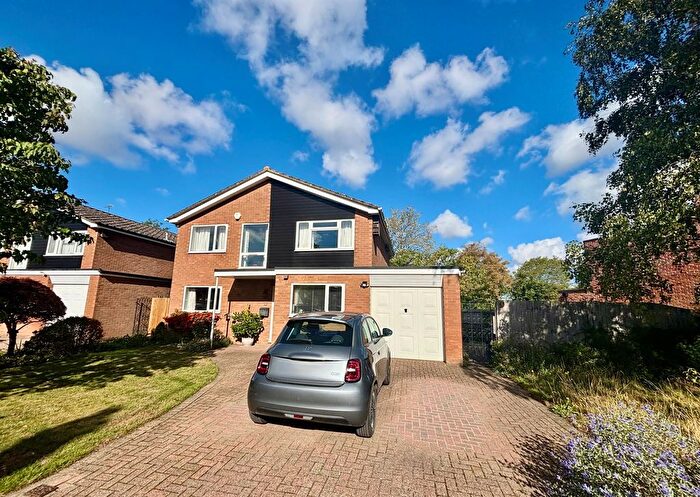
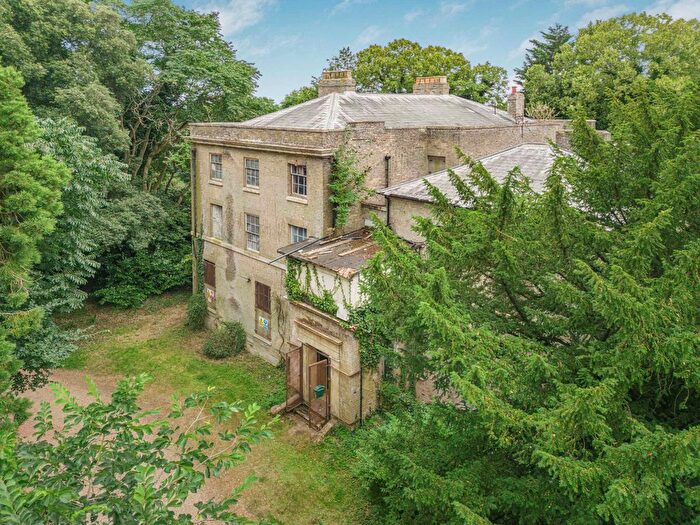
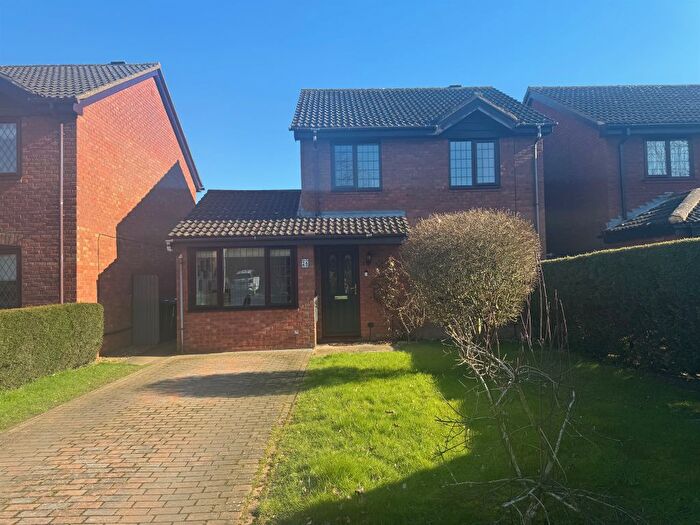
Previously listed properties in Bar Hill
Roads and Postcodes in Bar Hill
Navigate through our locations to find the location of your next house in Bar Hill, Cambridge for sale or to rent.
| Streets | Postcodes |
|---|---|
| Acorn Avenue | CB23 8DT |
| Almond Grove | CB23 8DU |
| Appletrees | CB23 8SJ CB23 8SN CB23 8SP CB23 8SW |
| Bakers Field | CB23 8EG |
| Bar Hill Business Park | CB23 8SL |
| Battlegate Road | CB23 4NH CB23 4NJ CB23 4NL |
| Brookdale | CB23 8UA |
| Chestnut Rise | CB23 8TF |
| Church Lane | CB23 8HE |
| Cottons Field | CB23 8DG |
| Crafts Way | CB23 8EJ |
| Elsworth Road | CB23 4LX |
| Farm Close | CB23 4NB |
| Field View | CB23 8SX CB23 8SY |
| Foxhollow | CB23 8EP CB23 8ER CB23 8ES |
| Gladeside | CB23 8DY |
| Grapevine Cottages | CB23 4NG |
| Hanover Close | CB23 8EH CB23 8SE |
| High Street | CB23 4LY CB23 4LZ CB23 8BS CB23 8HG |
| Hillcrest | CB23 8TG CB23 8TH CB23 8TQ |
| Hollytrees | CB23 8SF CB23 8SG |
| Hunting Grove | CB23 4NE |
| Huntingdon Road | CB23 8HD CB23 8DR CB23 8EF |
| Links Industrial Park | CB23 8UD |
| Little Meadow | CB23 8TD |
| Long Row | CB23 4NA |
| Manor Lane | CB23 4NF |
| Meridian Drive | CB23 8HP |
| Oak Crescent | CB23 8BY |
| Oakington Road | CB23 8DD CB23 8DE |
| Oatlands Avenue | CB23 8EQ |
| Old Rectory Drive | CB23 8BU |
| Otter Close | CB23 8EA |
| Otter Gardens | CB23 8ED |
| Park Lane | CB23 8DB |
| Park Street | CB23 8DA |
| Partridge Drive | CB23 8EN |
| Pettitts Close | CB23 8DQ |
| Pettitts Lane | CB23 8BT |
| Pheasant Rise | CB23 8SA CB23 8SB CB23 8SD |
| Redlands Road | CB23 8HQ |
| Robin Close | CB23 8DX |
| Robins Lane | CB23 8HH CB23 8HL |
| Saxon Way | CB23 8AP CB23 8TY |
| School Lane | CB23 4ND |
| Scotland Road | CB23 8BN CB23 8BX |
| Searles Meadow | CB23 8BW |
| Segraves | CB23 4LS |
| Stonefield | CB23 8TB CB23 8TE |
| The Brambles | CB23 8SZ CB23 8TA |
| The Fairway | CB23 8SR |
| The Green | CB23 8HF |
| The Mall | CB23 8DZ |
| The Spinney | CB23 8ST CB23 8SU CB23 8TP CB23 8TW |
| Thruffle Way | CB23 8TR |
| Trafalgar Way | CB23 8SQ CB23 8TU CB23 8BH |
| View Farm Close | CB23 8BP |
| Viking Way | CB23 8EE CB23 8EL |
| Watermead | CB23 8TJ CB23 8TL CB23 8TN |
| CB23 8EU |
Transport near Bar Hill
-
Cambridge North Station
-
Cambridge Station
-
Waterbeach Station
-
Shelford Station
-
Foxton Station
-
Shepreth Station
- FAQ
- Price Paid By Year
- Property Type Price
Frequently asked questions about Bar Hill
What is the average price for a property for sale in Bar Hill?
The average price for a property for sale in Bar Hill is £375,350. This amount is 27% lower than the average price in Cambridge. There are 165 property listings for sale in Bar Hill.
What streets have the most expensive properties for sale in Bar Hill?
The streets with the most expensive properties for sale in Bar Hill are Redlands Road at an average of £950,000, Searles Meadow at an average of £940,000 and School Lane at an average of £925,000.
What streets have the most affordable properties for sale in Bar Hill?
The streets with the most affordable properties for sale in Bar Hill are Little Meadow at an average of £208,375, Robin Close at an average of £225,000 and Watermead at an average of £228,722.
Which train stations are available in or near Bar Hill?
Some of the train stations available in or near Bar Hill are Cambridge North, Cambridge and Waterbeach.
Property Price Paid in Bar Hill by Year
The average sold property price by year was:
| Year | Average Sold Price | Price Change |
Sold Properties
|
|---|---|---|---|
| 2025 | £407,132 | 14% |
57 Properties |
| 2024 | £349,267 | -9% |
80 Properties |
| 2023 | £379,860 | -4% |
61 Properties |
| 2022 | £395,644 | 19% |
71 Properties |
| 2021 | £319,305 | -9% |
88 Properties |
| 2020 | £348,408 | 12% |
49 Properties |
| 2019 | £306,549 | 2% |
98 Properties |
| 2018 | £301,879 | -6% |
85 Properties |
| 2017 | £321,377 | 5% |
82 Properties |
| 2016 | £305,227 | 5% |
85 Properties |
| 2015 | £290,269 | 14% |
91 Properties |
| 2014 | £249,893 | 16% |
91 Properties |
| 2013 | £209,554 | 4% |
92 Properties |
| 2012 | £201,467 | 1% |
70 Properties |
| 2011 | £198,930 | -1% |
85 Properties |
| 2010 | £201,370 | 7% |
85 Properties |
| 2009 | £186,586 | -9% |
89 Properties |
| 2008 | £203,554 | -24% |
64 Properties |
| 2007 | £251,486 | 16% |
107 Properties |
| 2006 | £210,385 | 18% |
120 Properties |
| 2005 | £172,912 | 9% |
127 Properties |
| 2004 | £156,788 | 6% |
105 Properties |
| 2003 | £147,221 | 5% |
147 Properties |
| 2002 | £140,552 | 12% |
126 Properties |
| 2001 | £122,992 | 17% |
172 Properties |
| 2000 | £101,650 | 19% |
151 Properties |
| 1999 | £81,888 | 3% |
150 Properties |
| 1998 | £79,317 | 9% |
151 Properties |
| 1997 | £71,783 | 14% |
169 Properties |
| 1996 | £61,722 | -2% |
157 Properties |
| 1995 | £62,785 | - |
114 Properties |
Property Price per Property Type in Bar Hill
Here you can find historic sold price data in order to help with your property search.
The average Property Paid Price for specific property types in the last three years are:
| Property Type | Average Sold Price | Sold Properties |
|---|---|---|
| Semi Detached House | £323,542.00 | 53 Semi Detached Houses |
| Detached House | £534,863.00 | 68 Detached Houses |
| Terraced House | £269,478.00 | 75 Terraced Houses |
| Flat | £295,000.00 | 2 Flats |

