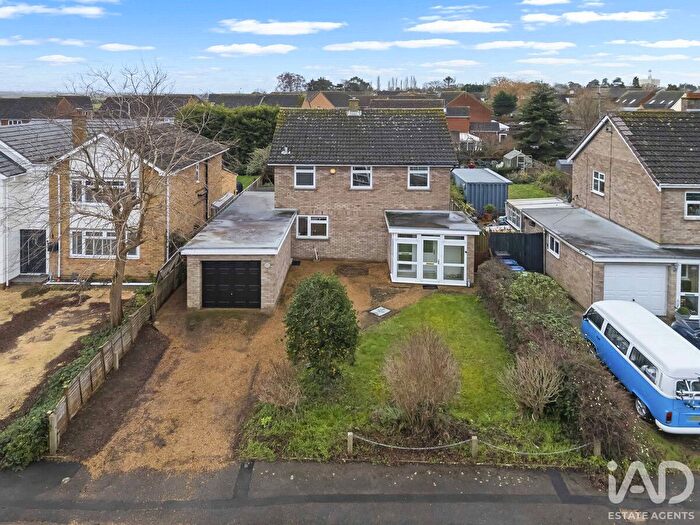
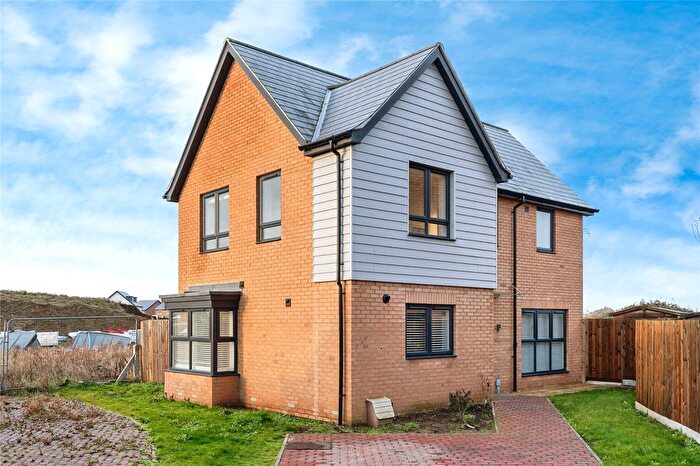
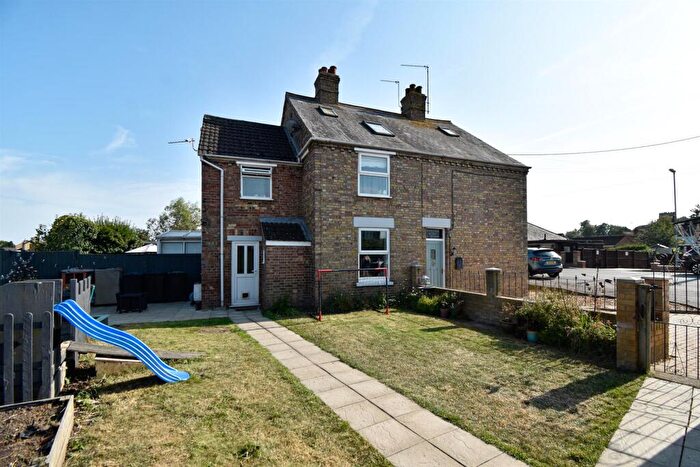
Houses for sale & to rent in Littleport East, Ely
House Prices in Littleport East
Properties in Littleport East have an average house price of £278,880.00 and had 154 Property Transactions within the last 3 years¹.
Littleport East is an area in Ely, Cambridgeshire with 2,135 households², where the most expensive property was sold for £600,000.00.
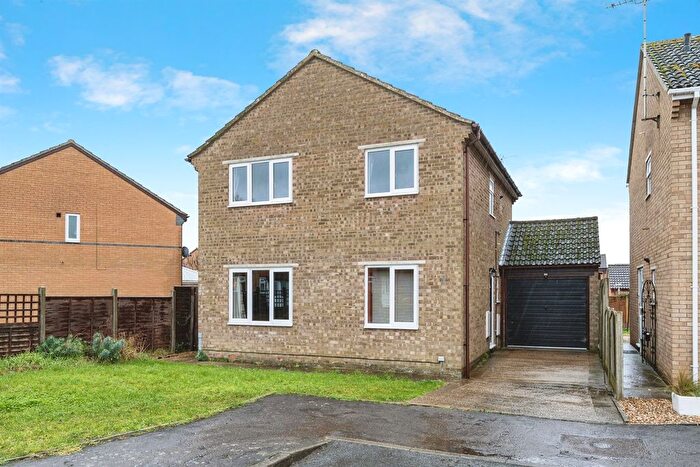
Properties for sale in Littleport East
Roads and Postcodes in Littleport East
Navigate through our locations to find the location of your next house in Littleport East, Ely for sale or to rent.
| Streets | Postcodes |
|---|---|
| Alexandra Road | CB6 1NX |
| Anchor Court | CB6 1NL |
| Ashley Gardens | CB6 1PD |
| Barkhams Lane | CB6 1NN |
| Bevin Court | CB6 1SF |
| Black Horse Drove | CB6 1EG |
| Broom Close | CB6 1HX |
| Camel Road | CB6 1EW CB6 1PU |
| Cedar Court | CB6 1PA |
| City Road | CB6 1NG |
| Croft Park Road | CB6 1NZ |
| Crown Lane | CB6 1PP |
| Eastfields | CB6 1XD |
| Ely Road | CB6 1HG CB6 1HJ CB6 1HL CB6 1HQ CB6 1RT |
| Fallowfield | CB6 1GY |
| Ferry Way | CB6 1QJ |
| Festival Way | CB6 1EQ |
| Fishers Bank | CB6 1LL CB6 1LN |
| Fleet Close | CB6 1PG |
| Globe Lane | CB6 1PW |
| Granary Lane | CB6 1PQ |
| Granby Street | CB6 1NE |
| Grange Lane | CB6 1HW |
| Guernsey Way | CB6 1GD |
| Hawthorn Close | CB6 1NY |
| Hempfield Place | CB6 1NP |
| Hempfield Road | CB6 1NW |
| High Street | CB6 1HE |
| Highfield Drive | CB6 1GA |
| Hitches Street | CB6 1PL |
| Hoof Close | CB6 1HU |
| Kelly Grove | CB6 1EZ |
| Kingsmead Court | CB6 1LR |
| Law Close | CB6 1TS |
| Lynn Road | CB6 1QG CB7 4TB CB7 4TD |
| Main Street | CB6 1PH CB6 1PJ |
| Manor Place | CB6 1QL |
| Mildenhall Road | CB7 4SY |
| Millfield | CB6 1HN |
| Millpit Furlong | CB6 1HT |
| Mow Fen Road | CB6 1PY |
| New River Bank | CB7 4TA |
| New Road | CB6 1PX |
| Oak Lane | CB6 1RS |
| Old School Close | CB6 1ET |
| Orchard Close | CB6 1NU |
| Padnal | CB6 1NS |
| Peacock Way | CB6 1AB |
| Plantation Farm Cottages | CB7 4SS |
| Ponts Hill | CB6 1PZ |
| Poplar Drove | CB6 1FB |
| Saffron Close | CB6 1HR |
| Sandhill | CB6 1NT |
| Sandys Crescent | CB6 1LP |
| Silt Road | CB6 1QD |
| Station Road | CB6 1QE CB6 1QF |
| Sycamore Place | CB6 1PF |
| Ten Mile Bank | CB6 1EE CB6 1EF |
| The Barns | CB6 1GG |
| The Brambles | CB6 1XH |
| The Coppice | CB6 1HP |
| The Crescent | CB6 1HS |
| The Holmes | CB6 1NH |
| The Hythe | CB6 1QA |
| Thoroughfare Way | CB6 1NJ |
| Upton Lane | CB6 1HF |
| Victoria Street | CB6 1LU CB6 1LX CB6 1LY CB6 1LZ CB6 1NA |
| Washington Close | CB6 1TG |
| Wellington Street | CB6 1PN |
| White Hart Lane | CB6 1NB |
| White House Road | CB7 4TF CB7 4TG |
| Willow Court | CB6 1NQ |
| CB7 4ST |
Transport near Littleport East
- FAQ
- Price Paid By Year
- Property Type Price
Frequently asked questions about Littleport East
What is the average price for a property for sale in Littleport East?
The average price for a property for sale in Littleport East is £278,880. This amount is 20% lower than the average price in Ely. There are 1,629 property listings for sale in Littleport East.
What streets have the most expensive properties for sale in Littleport East?
The streets with the most expensive properties for sale in Littleport East are Sandhill at an average of £500,000, Alexandra Road at an average of £447,500 and Upton Lane at an average of £375,333.
What streets have the most affordable properties for sale in Littleport East?
The streets with the most affordable properties for sale in Littleport East are Granby Street at an average of £132,750, Main Street at an average of £165,000 and White Hart Lane at an average of £194,000.
Which train stations are available in or near Littleport East?
Some of the train stations available in or near Littleport East are Littleport, Shippea Hill and Ely.
Property Price Paid in Littleport East by Year
The average sold property price by year was:
| Year | Average Sold Price | Price Change |
Sold Properties
|
|---|---|---|---|
| 2025 | £304,273 | 12% |
40 Properties |
| 2024 | £266,395 | -3% |
56 Properties |
| 2023 | £273,422 | 6% |
58 Properties |
| 2022 | £258,148 | -2% |
95 Properties |
| 2021 | £264,214 | 2% |
110 Properties |
| 2020 | £258,804 | 6% |
67 Properties |
| 2019 | £244,248 | 1% |
86 Properties |
| 2018 | £241,312 | 9% |
97 Properties |
| 2017 | £219,556 | 1% |
87 Properties |
| 2016 | £216,895 | 4% |
107 Properties |
| 2015 | £209,047 | 20% |
86 Properties |
| 2014 | £168,244 | 5% |
99 Properties |
| 2013 | £159,273 | 1% |
89 Properties |
| 2012 | £157,901 | 3% |
67 Properties |
| 2011 | £153,879 | 1% |
79 Properties |
| 2010 | £151,979 | 0,3% |
58 Properties |
| 2009 | £151,466 | -15% |
63 Properties |
| 2008 | £173,922 | 6% |
57 Properties |
| 2007 | £162,909 | -7% |
138 Properties |
| 2006 | £173,827 | 11% |
156 Properties |
| 2005 | £154,693 | 5% |
121 Properties |
| 2004 | £147,016 | 16% |
150 Properties |
| 2003 | £123,250 | 13% |
151 Properties |
| 2002 | £106,651 | 16% |
138 Properties |
| 2001 | £89,937 | 10% |
131 Properties |
| 2000 | £80,807 | 16% |
116 Properties |
| 1999 | £67,954 | 6% |
139 Properties |
| 1998 | £63,630 | 13% |
100 Properties |
| 1997 | £55,671 | 15% |
123 Properties |
| 1996 | £47,217 | -9% |
117 Properties |
| 1995 | £51,332 | - |
75 Properties |
Property Price per Property Type in Littleport East
Here you can find historic sold price data in order to help with your property search.
The average Property Paid Price for specific property types in the last three years are:
| Property Type | Average Sold Price | Sold Properties |
|---|---|---|
| Semi Detached House | £238,362.00 | 35 Semi Detached Houses |
| Detached House | £340,350.00 | 67 Detached Houses |
| Terraced House | £237,377.00 | 45 Terraced Houses |
| Flat | £159,928.00 | 7 Flats |

