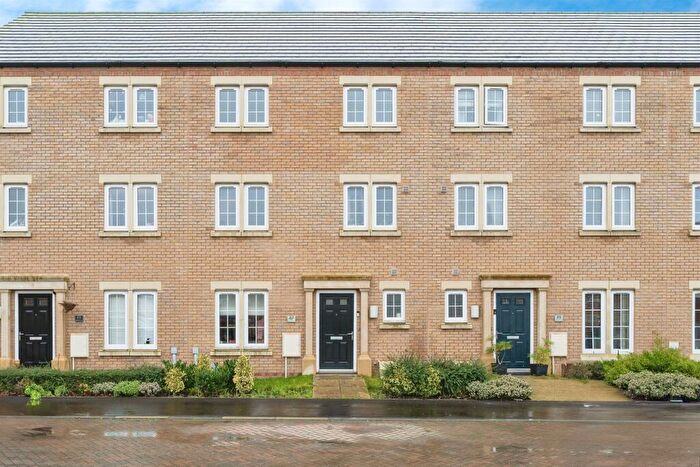
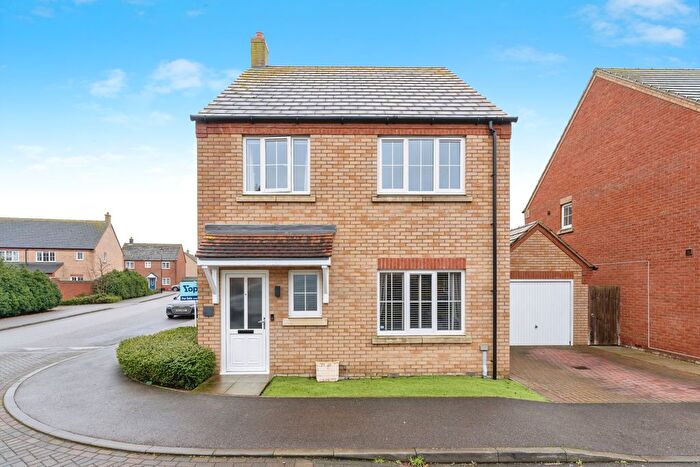
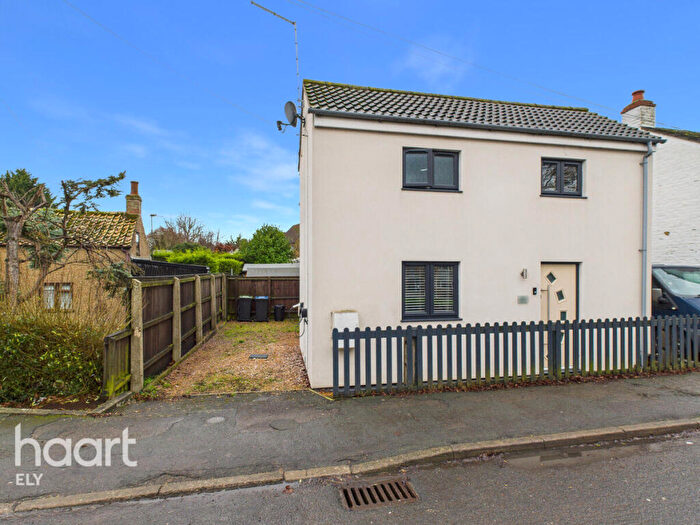
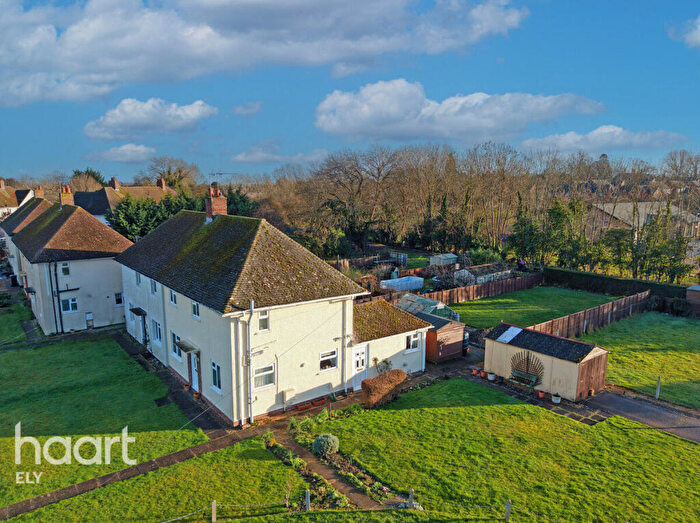
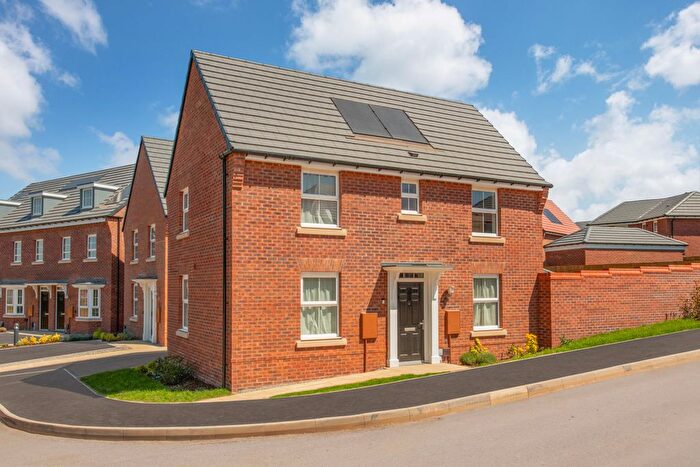
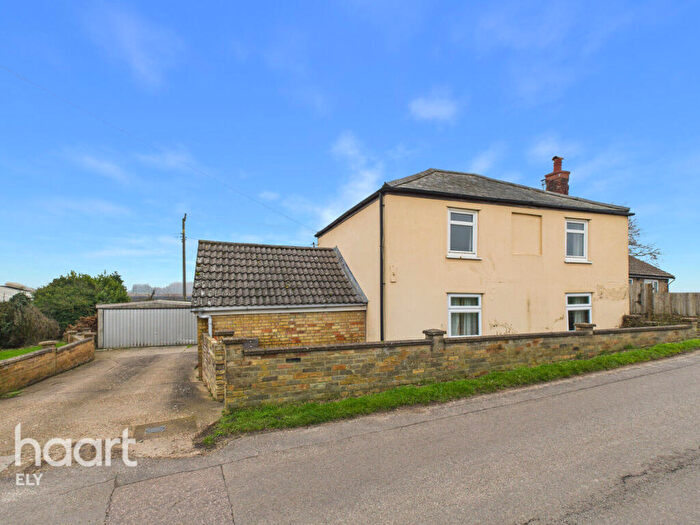
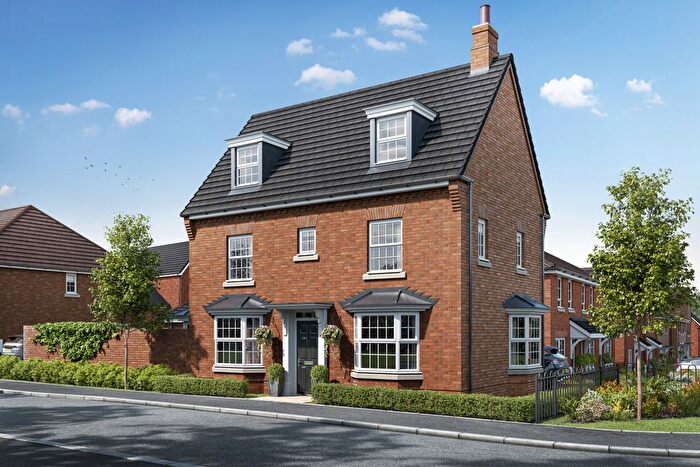
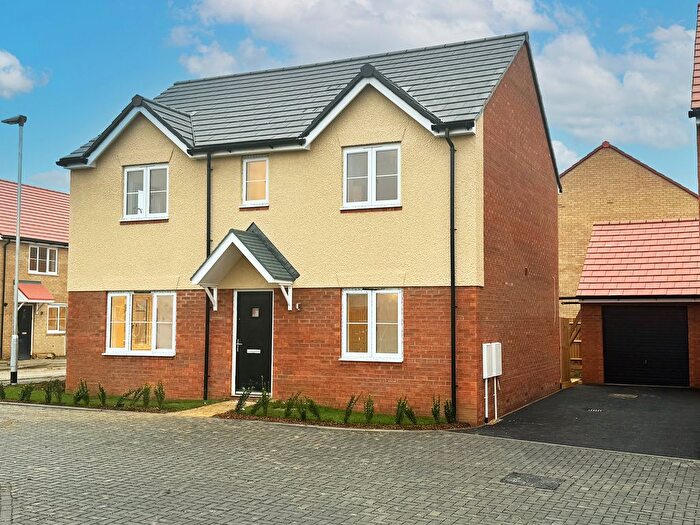
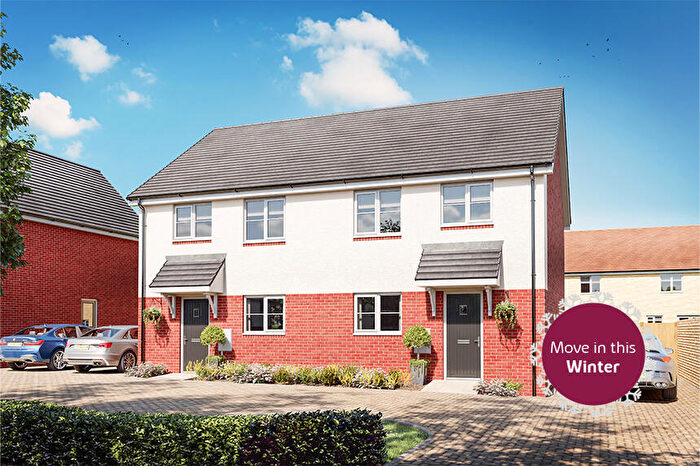
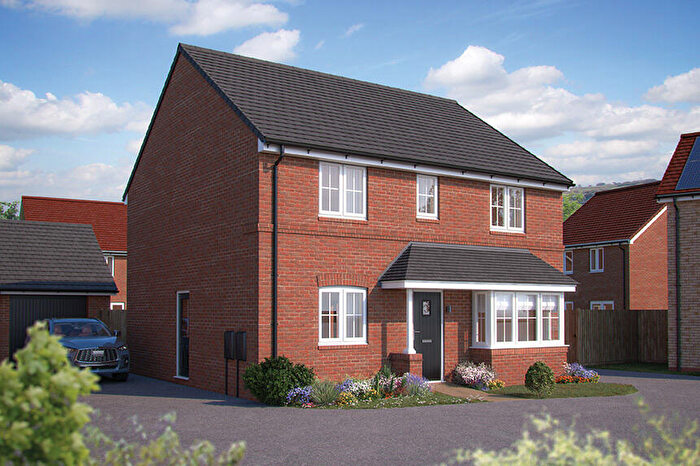
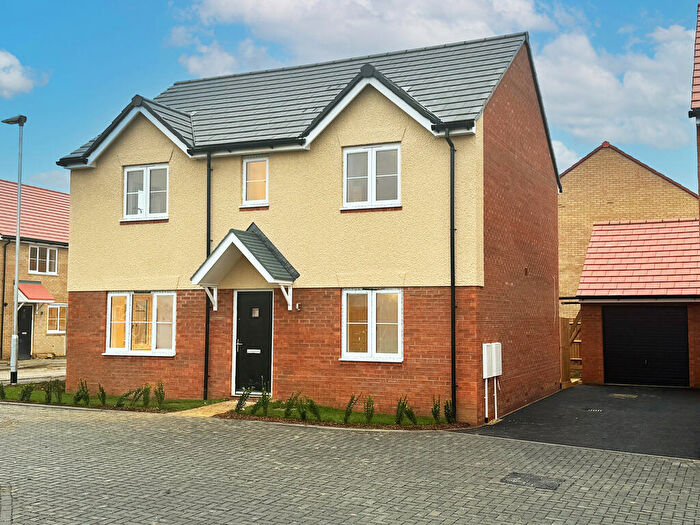
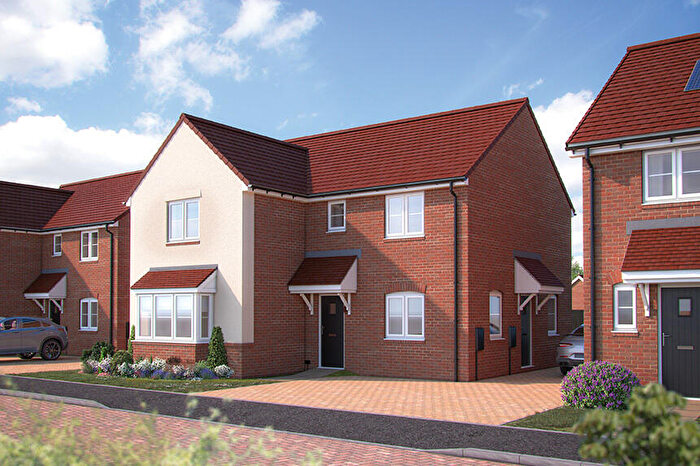
Houses for sale & to rent in Littleport West, Ely
House Prices in Littleport West
Properties in Littleport West have an average house price of £280,622.00 and had 117 Property Transactions within the last 3 years¹.
Littleport West is an area in Ely, Cambridgeshire with 1,225 households², where the most expensive property was sold for £1,400,000.00.
Properties for sale in Littleport West
Roads and Postcodes in Littleport West
Navigate through our locations to find the location of your next house in Littleport West, Ely for sale or to rent.
| Streets | Postcodes |
|---|---|
| Atkins Close | CB6 1JE |
| Brookside Grove | CB6 1JN |
| Browning Chase | CB6 1FH |
| Burnt Chimney Drove | CB6 1RN |
| Chamberlain Fields | CB6 1FJ |
| Church Lane | CB6 1PS CB6 1PT |
| Cottier Drive | CB6 1FG |
| Dairy Drove | CB6 1RR |
| Dexter Lane | CB6 1GE |
| Elmside | CB6 1LJ |
| Friars Place | CB6 1LG |
| Friars Way | CB6 1LF |
| Gilbert Road | CB6 1JZ |
| Hale Fen | CB6 1EJ CB6 1EL CB6 1EN |
| Hardwicke Close | CB6 1JB |
| Highfield Drive | CB6 1GB |
| Jersey Way | CB6 1GF |
| Kirby Cross Avenue | CB6 1LH |
| Knowle Court | CB6 1JR |
| Lester Way | CB6 1FW |
| Limes Close | CB6 1QQ |
| Longfield Road | CB6 1JY CB6 1LB |
| Lowfield Crescent | CB6 1FP |
| Lupins Close | CB6 1FN |
| Meadow Court | CB6 1JW CB6 1LQ |
| Monkswood | CB6 1JD |
| Noah's Way | CB6 1JA |
| Old Pool Drove | CB6 1RL |
| Parsons Lane | CB6 1JS CB6 1JU CB6 1JX |
| Plains Lane | CB6 1RJ |
| Queens Road | CB6 1LA |
| Rye Close | CB6 1GH |
| The Furrow | CB6 1GL |
| The Leap | CB6 1FR |
| Tilling Way | CB6 1GN |
| Upton Place | CB6 1LD CB6 1LE |
| Villers View | CB6 1HZ |
| Wisbech Road | CB6 1JH CB6 1JJ CB6 1PR CB6 1RA CB6 1RG |
| Woodfen Road | CB6 1JP |
| Yeomans Way | CB6 1FL |
Transport near Littleport West
- FAQ
- Price Paid By Year
- Property Type Price
Frequently asked questions about Littleport West
What is the average price for a property for sale in Littleport West?
The average price for a property for sale in Littleport West is £280,622. This amount is 20% lower than the average price in Ely. There are 1,130 property listings for sale in Littleport West.
What streets have the most expensive properties for sale in Littleport West?
The streets with the most expensive properties for sale in Littleport West are Woodfen Road at an average of £800,000, Chamberlain Fields at an average of £382,500 and Wisbech Road at an average of £329,746.
What streets have the most affordable properties for sale in Littleport West?
The streets with the most affordable properties for sale in Littleport West are Elmside at an average of £145,000, Burnt Chimney Drove at an average of £180,000 and Limes Close at an average of £206,100.
Which train stations are available in or near Littleport West?
Some of the train stations available in or near Littleport West are Littleport, Ely and Manea.
Property Price Paid in Littleport West by Year
The average sold property price by year was:
| Year | Average Sold Price | Price Change |
Sold Properties
|
|---|---|---|---|
| 2025 | £276,968 | -2% |
32 Properties |
| 2024 | £282,425 | 0,3% |
47 Properties |
| 2023 | £281,470 | -3% |
38 Properties |
| 2022 | £289,179 | 8% |
83 Properties |
| 2021 | £266,536 | -1% |
91 Properties |
| 2020 | £270,040 | 8% |
60 Properties |
| 2019 | £248,068 | 4% |
46 Properties |
| 2018 | £237,039 | 7% |
56 Properties |
| 2017 | £220,585 | 4% |
57 Properties |
| 2016 | £211,238 | 3% |
63 Properties |
| 2015 | £205,405 | 11% |
61 Properties |
| 2014 | £182,251 | 7% |
111 Properties |
| 2013 | £169,752 | -10% |
89 Properties |
| 2012 | £186,744 | 14% |
62 Properties |
| 2011 | £160,433 | -4% |
89 Properties |
| 2010 | £166,512 | 11% |
74 Properties |
| 2009 | £148,624 | -2% |
56 Properties |
| 2008 | £151,459 | -9% |
27 Properties |
| 2007 | £165,446 | 9% |
76 Properties |
| 2006 | £151,166 | -10% |
66 Properties |
| 2005 | £166,650 | 17% |
60 Properties |
| 2004 | £138,215 | 7% |
56 Properties |
| 2003 | £128,218 | 14% |
60 Properties |
| 2002 | £110,307 | 20% |
66 Properties |
| 2001 | £87,805 | 20% |
53 Properties |
| 2000 | £70,649 | 5% |
39 Properties |
| 1999 | £67,065 | 3% |
59 Properties |
| 1998 | £65,029 | 22% |
35 Properties |
| 1997 | £50,992 | 13% |
43 Properties |
| 1996 | £44,589 | 6% |
37 Properties |
| 1995 | £41,932 | - |
34 Properties |
Property Price per Property Type in Littleport West
Here you can find historic sold price data in order to help with your property search.
The average Property Paid Price for specific property types in the last three years are:
| Property Type | Average Sold Price | Sold Properties |
|---|---|---|
| Semi Detached House | £263,053.00 | 50 Semi Detached Houses |
| Detached House | £386,468.00 | 24 Detached Houses |
| Terraced House | £246,706.00 | 41 Terraced Houses |
| Flat | £145,000.00 | 2 Flats |

