
Houses for sale & to rent in Newmarket, Cambridgeshire
House Prices in Newmarket
Properties in Newmarket have an average house price of £506k and had 302 Property Transactions within the last 3 years.¹
Newmarket is an area in Cambridgeshire with 3,554 households², where the most expensive property was sold for £2.19M.
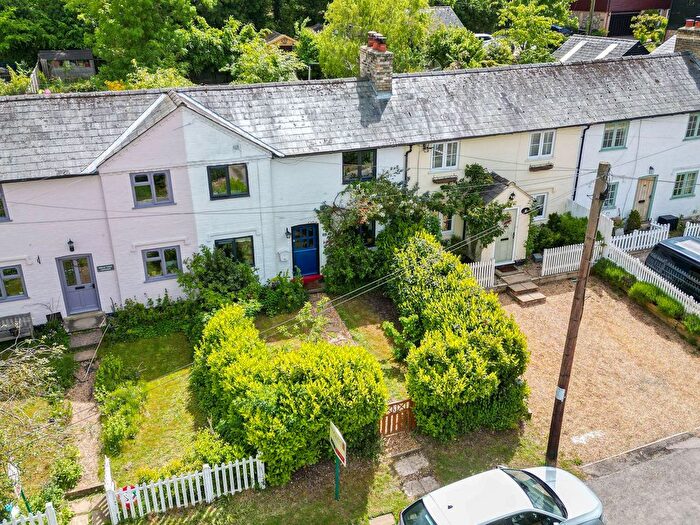
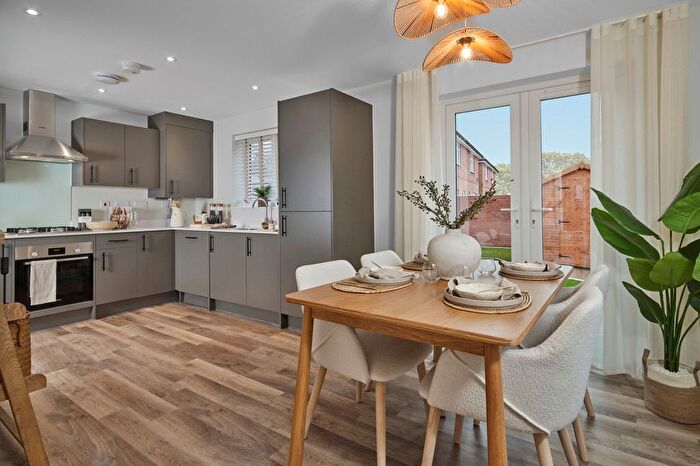
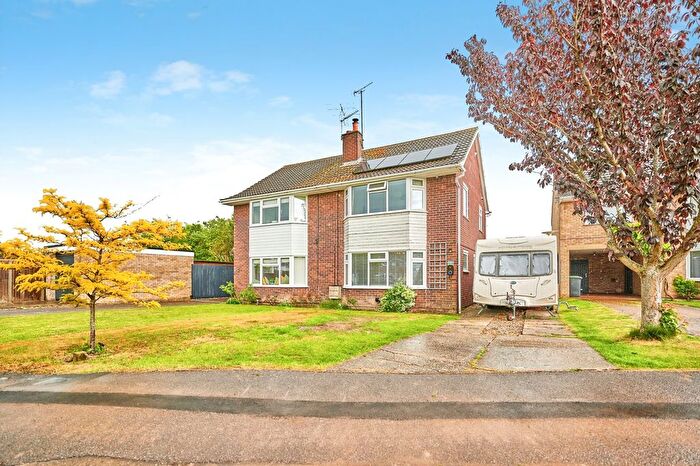
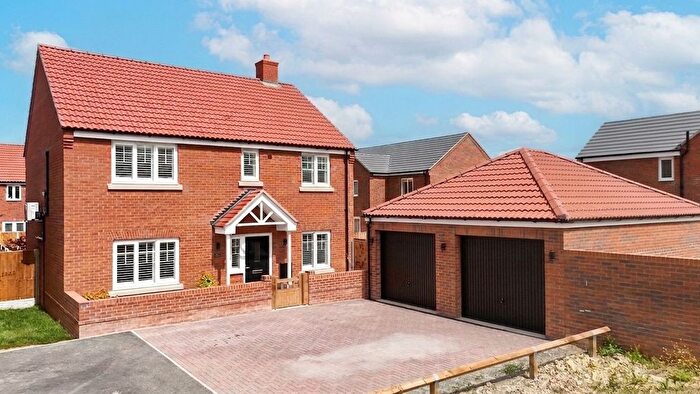
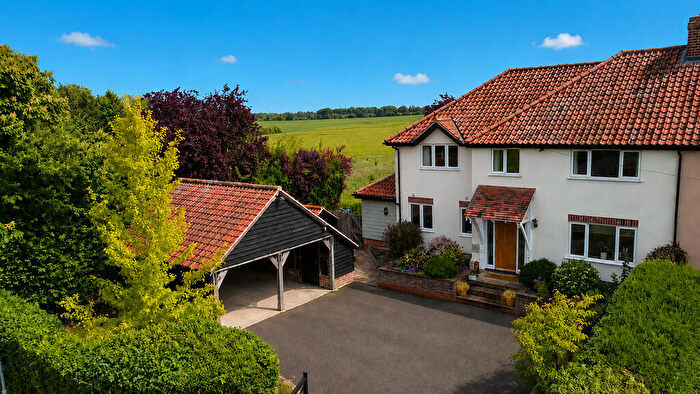
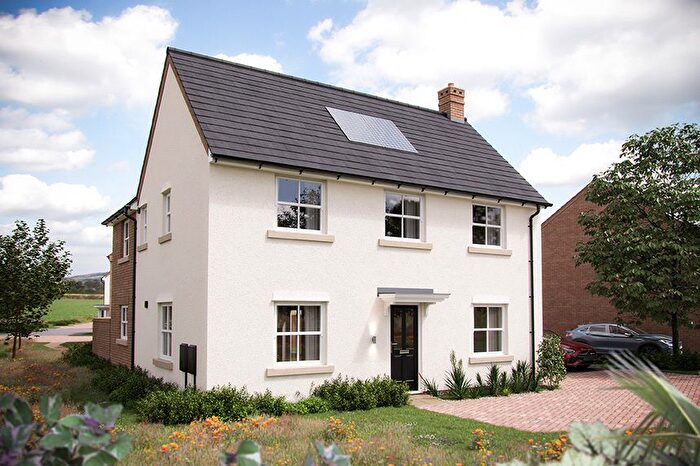
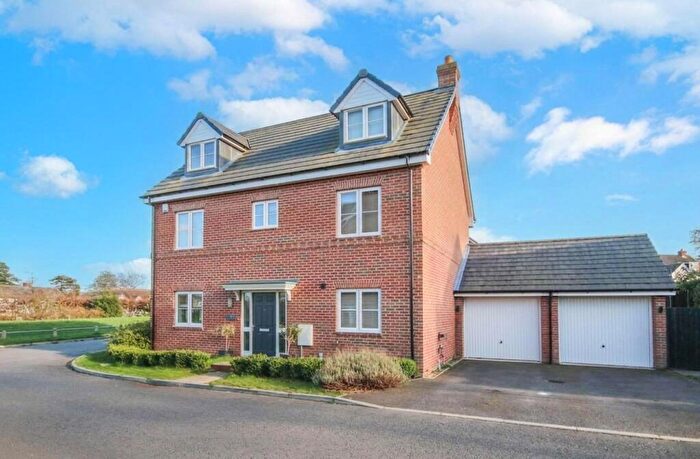
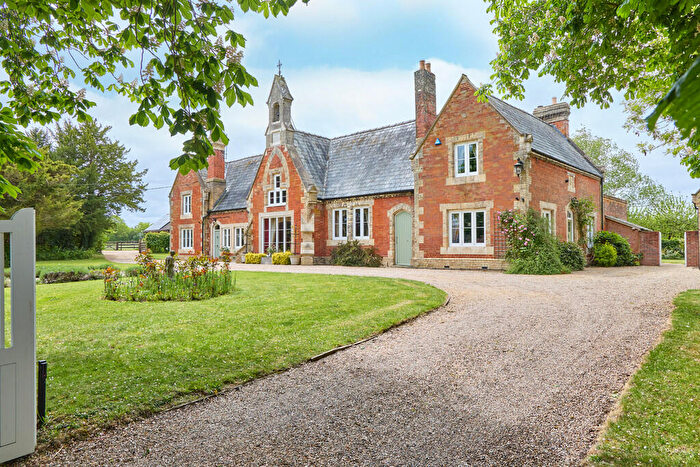
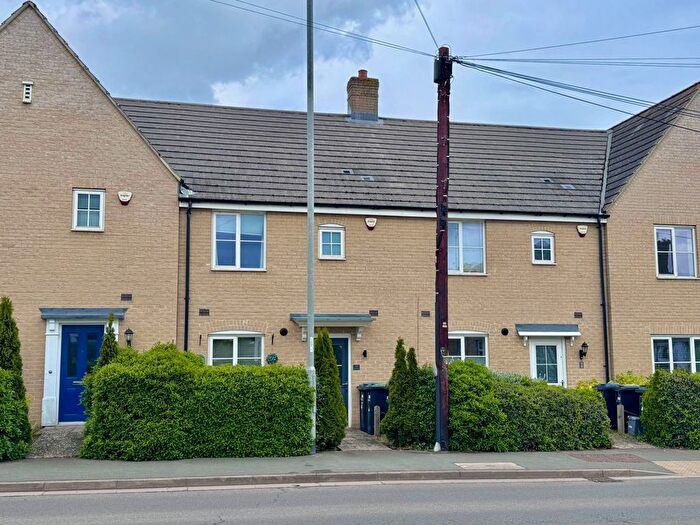
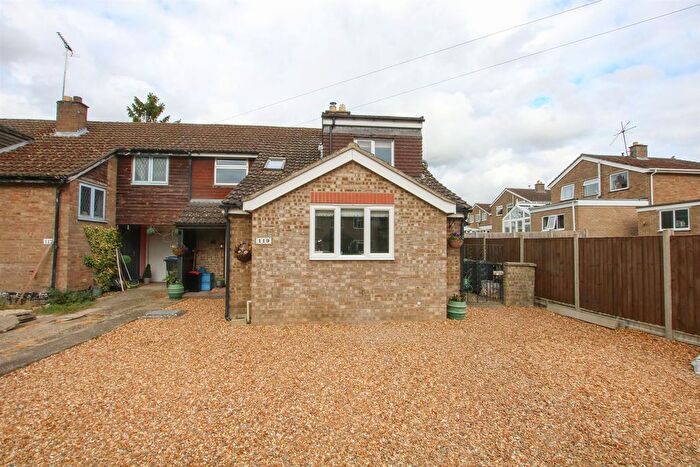
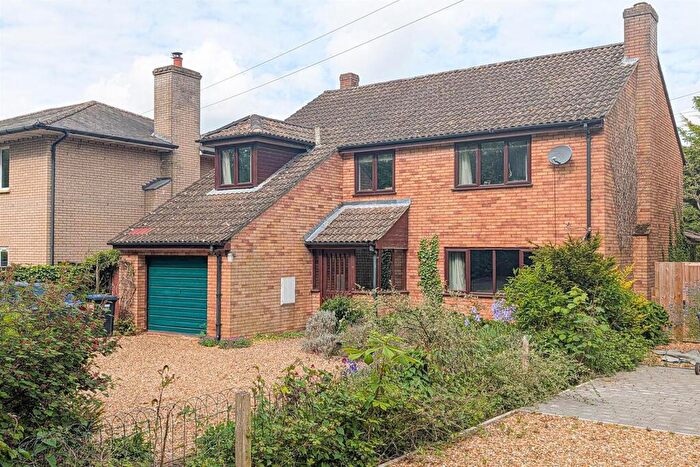
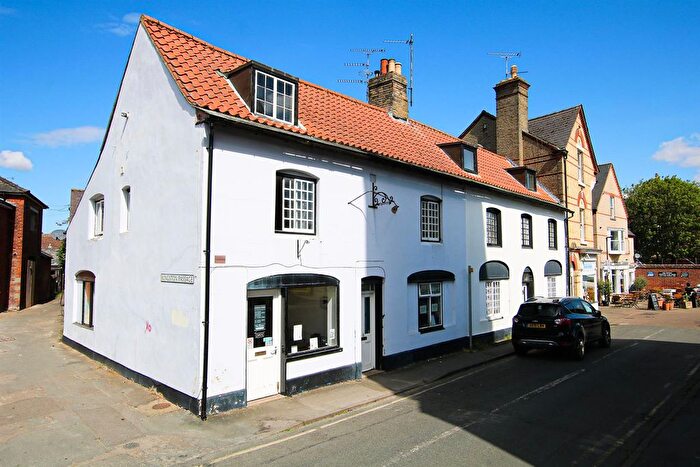
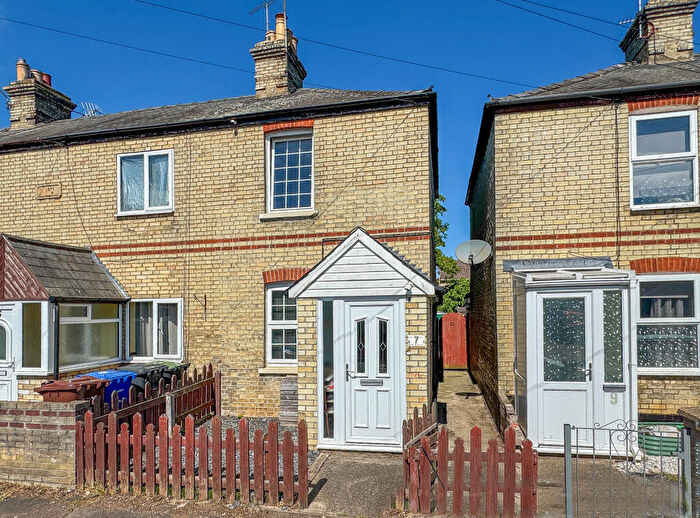
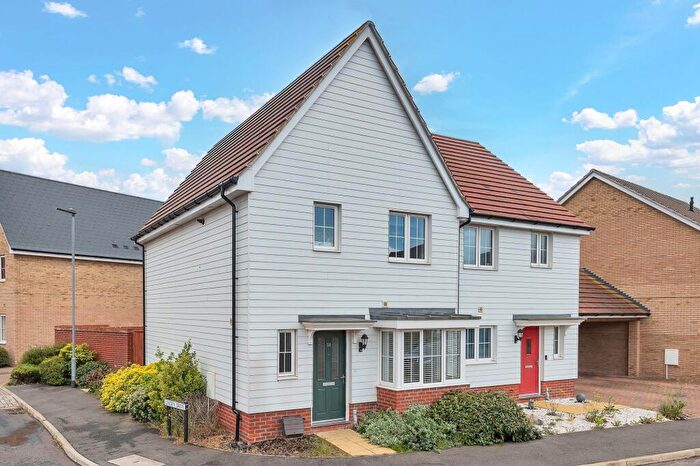
Properties for sale in Newmarket
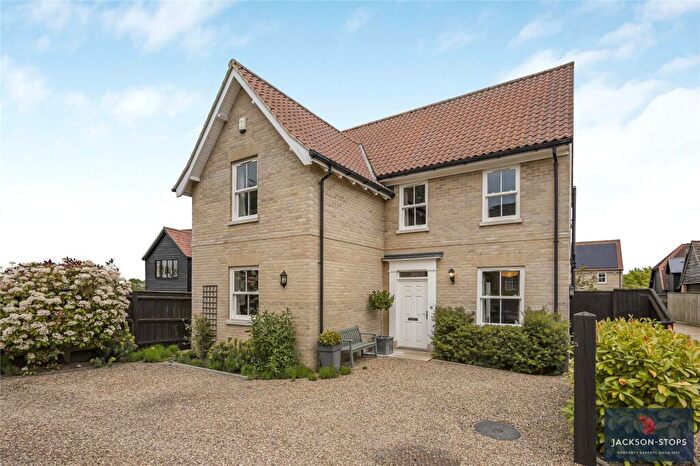
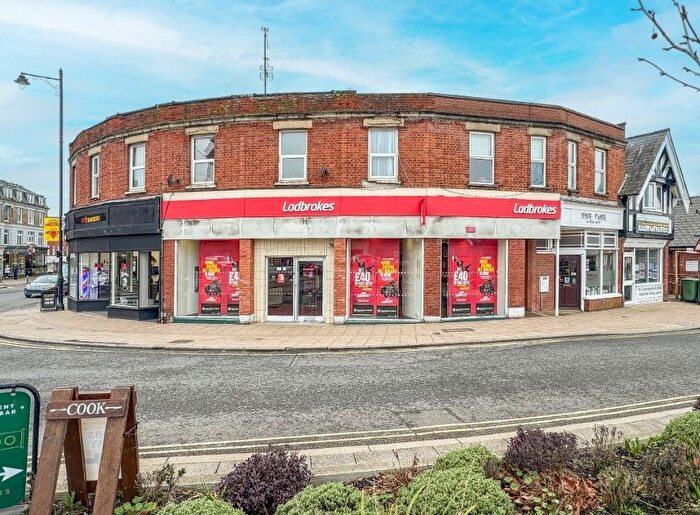

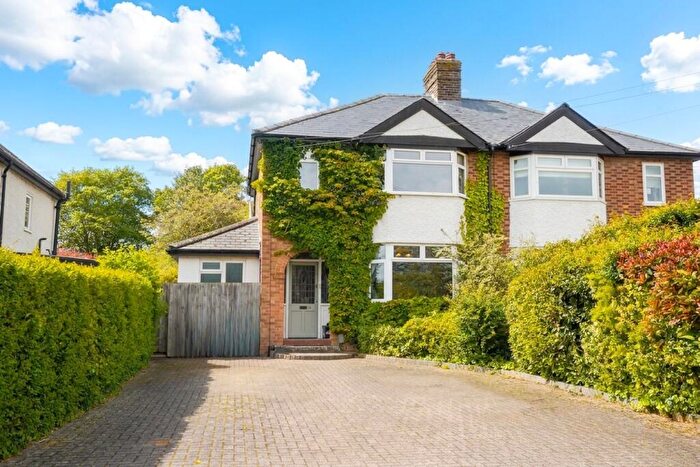
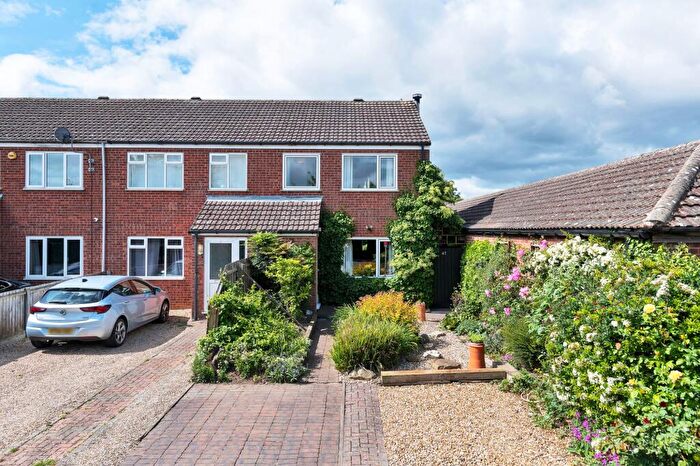
![]()
If you are looking to sell your house, let it out, or receive a property valuation, an expert can help you.
Click the button below to get started.
Neighbourhoods in Newmarket
Navigate through our locations to find the location of your next house in Newmarket, Cambridgeshire for sale or to rent.
Transport in Newmarket
Please see below transportation links in this area:

- FAQ
- Price Paid By Year
- Property Type Price
Frequently asked questions about Newmarket
What is the average price for a property for sale in Newmarket?
The average price for a property for sale in Newmarket is £506,430. This amount is 28% higher than the average price in Cambridgeshire. There are 5,087 property listings for sale in Newmarket.
What locations have the most expensive properties for sale in Newmarket?
The locations with the most expensive properties for sale in Newmarket are Balsham at an average of £653,000, Dullingham Villages at an average of £601,894 and Woodditton at an average of £571,232.
What locations have the most affordable properties for sale in Newmarket?
The locations with the most affordable properties for sale in Newmarket are The Wilbrahams at an average of £155,000, Fordham Villages at an average of £369,094 and Cheveley at an average of £487,929.
Which train stations are available in or near Newmarket?
Some of the train stations available in or near Newmarket are Newmarket, Dullingham and Kennett.
Property Price Paid in Newmarket by Year
The average sold property price by year was:
| Year | Average Sold Price | Price Change |
Sold Properties
|
|---|---|---|---|
| 2026 | £380,000 | -32% |
3 Properties |
| 2025 | £500,857 | -10% |
102 Properties |
| 2024 | £549,234 | 13% |
96 Properties |
| 2023 | £475,128 | -6% |
101 Properties |
| 2022 | £501,965 | 10% |
135 Properties |
| 2021 | £449,658 | 3% |
168 Properties |
| 2020 | £434,645 | -4% |
99 Properties |
| 2019 | £451,918 | 7% |
126 Properties |
| 2018 | £421,421 | 3% |
104 Properties |
| 2017 | £407,189 | 5% |
117 Properties |
| 2016 | £388,451 | 1% |
119 Properties |
| 2015 | £384,494 | 7% |
119 Properties |
| 2014 | £356,629 | 10% |
128 Properties |
| 2013 | £319,992 | -6% |
113 Properties |
| 2012 | £337,869 | 10% |
89 Properties |
| 2011 | £303,189 | -7% |
92 Properties |
| 2010 | £324,599 | -1% |
110 Properties |
| 2009 | £329,026 | -25% |
107 Properties |
| 2008 | £410,034 | 16% |
91 Properties |
| 2007 | £343,153 | 19% |
164 Properties |
| 2006 | £277,476 | -9% |
154 Properties |
| 2005 | £302,815 | 22% |
127 Properties |
| 2004 | £236,780 | -9% |
133 Properties |
| 2003 | £259,173 | 14% |
147 Properties |
| 2002 | £222,314 | 10% |
173 Properties |
| 2001 | £199,665 | 17% |
162 Properties |
| 2000 | £165,954 | 22% |
159 Properties |
| 1999 | £129,341 | 3% |
150 Properties |
| 1998 | £125,748 | 17% |
133 Properties |
| 1997 | £104,243 | 10% |
142 Properties |
| 1996 | £93,617 | -3% |
118 Properties |
| 1995 | £96,356 | - |
92 Properties |
Property Price per Property Type in Newmarket
Here you can find historic sold price data in order to help with your property search.
The average Property Paid Price for specific property types in the last three years are:
| Property Type | Average Sold Price | Sold Properties |
|---|---|---|
| Flat | £178,291.00 | 12 Flats |
| Semi Detached House | £386,255.00 | 81 Semi Detached Houses |
| Detached House | £618,092.00 | 175 Detached Houses |
| Terraced House | £333,814.00 | 34 Terraced Houses |