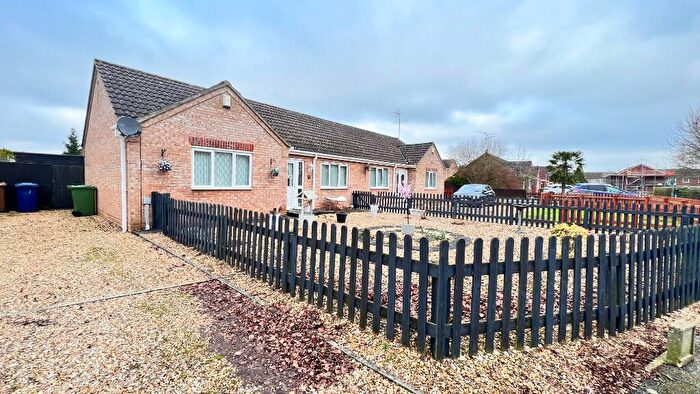
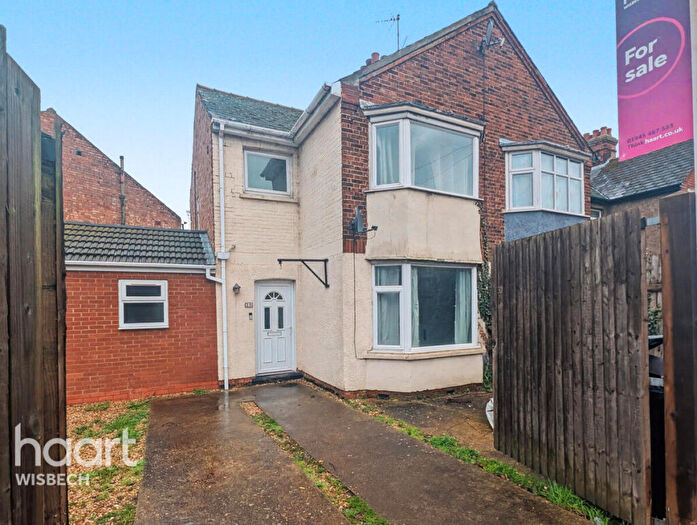
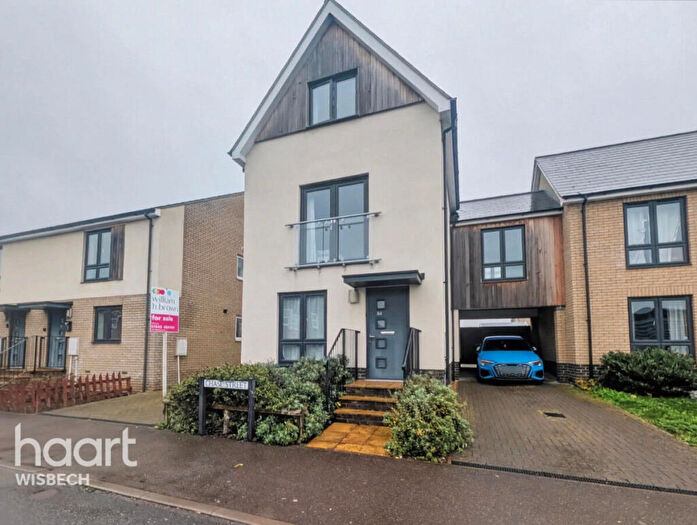
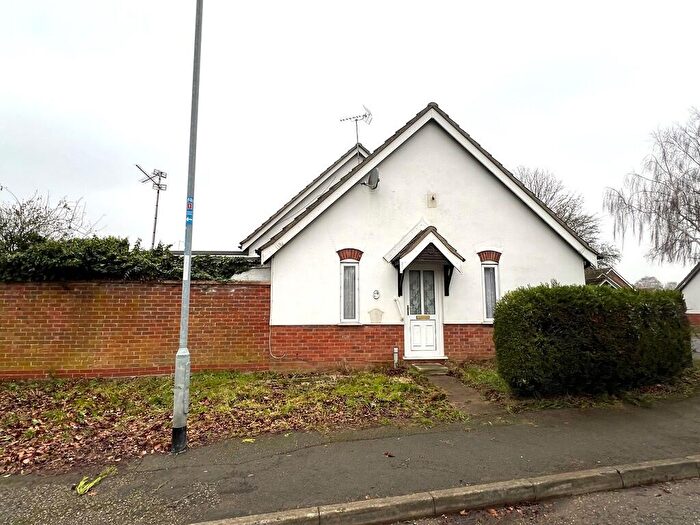
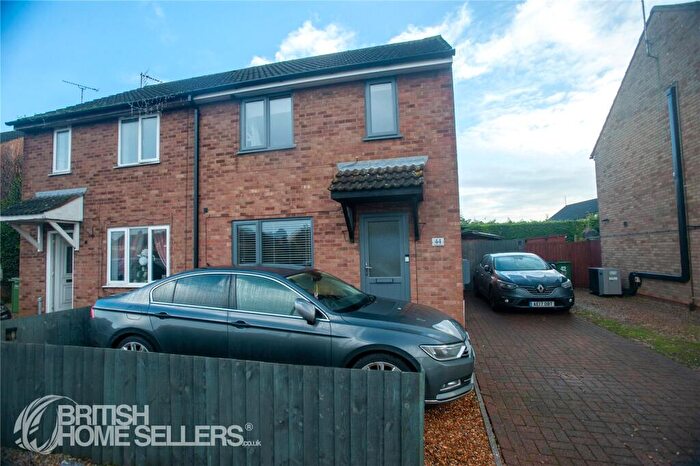
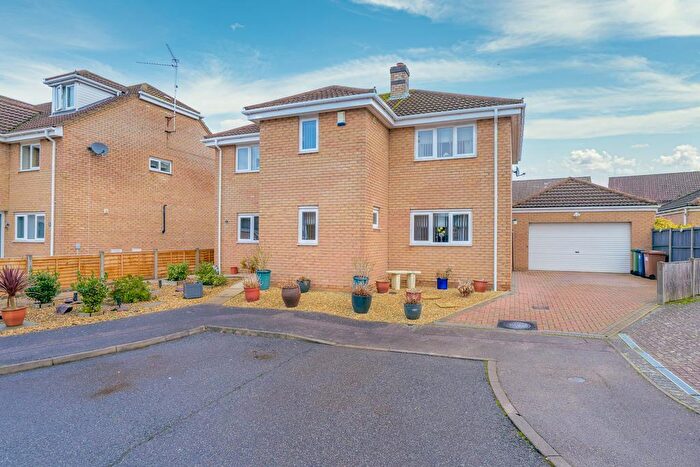
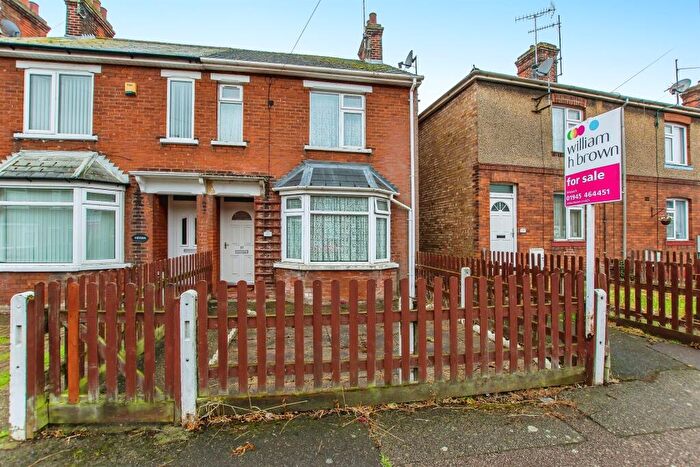
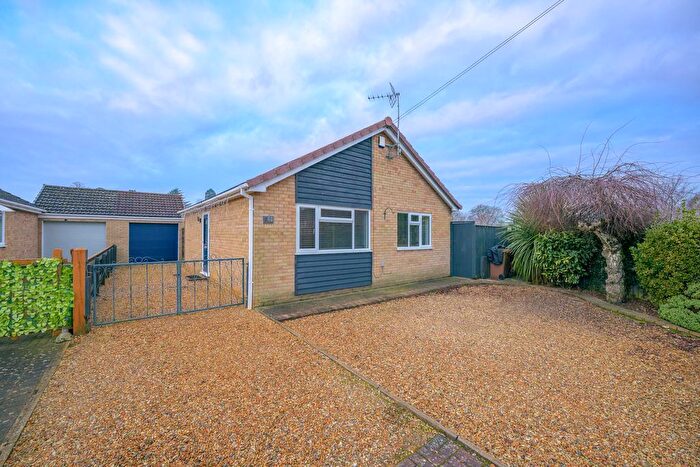
Houses for sale & to rent in Waterlees, Wisbech
House Prices in Waterlees
Properties in Waterlees have an average house price of £164,539.00 and had 178 Property Transactions within the last 3 years¹.
Waterlees is an area in Wisbech, Cambridgeshire with 2,029 households², where the most expensive property was sold for £420,000.00.
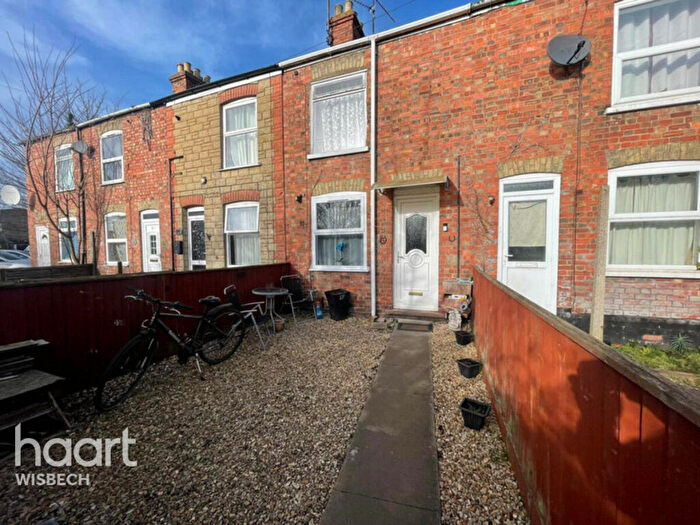
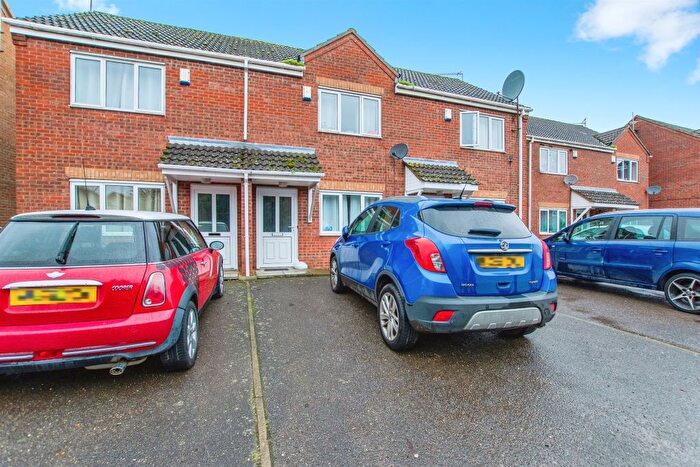
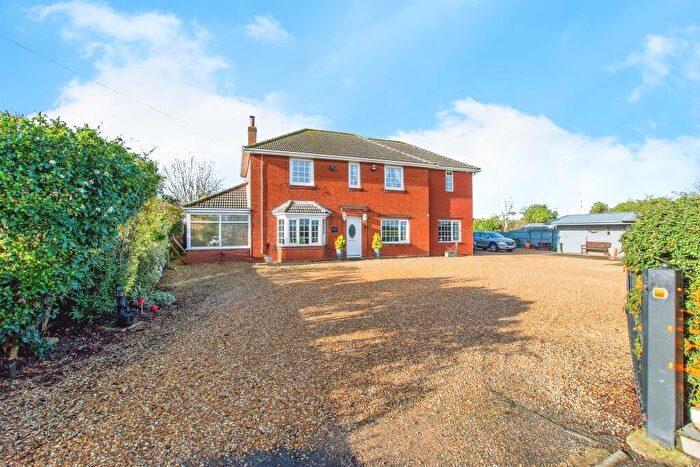
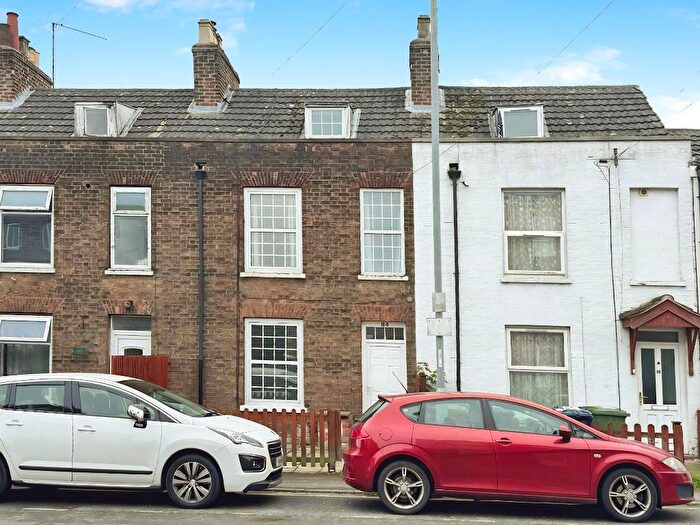
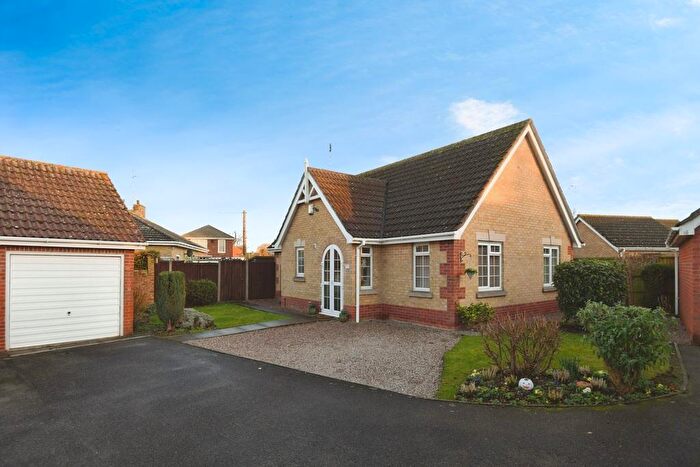
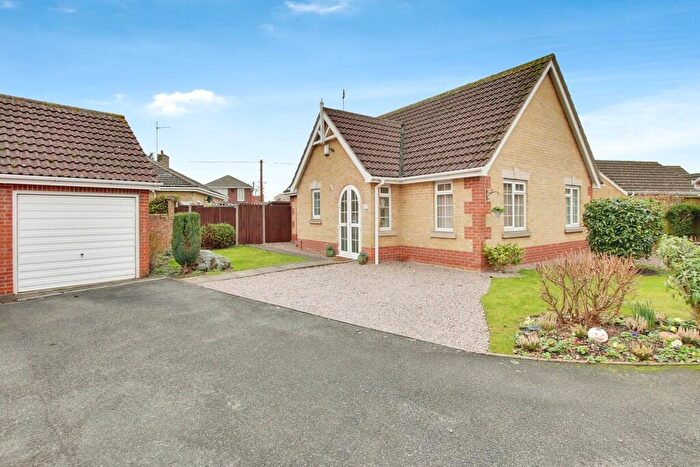
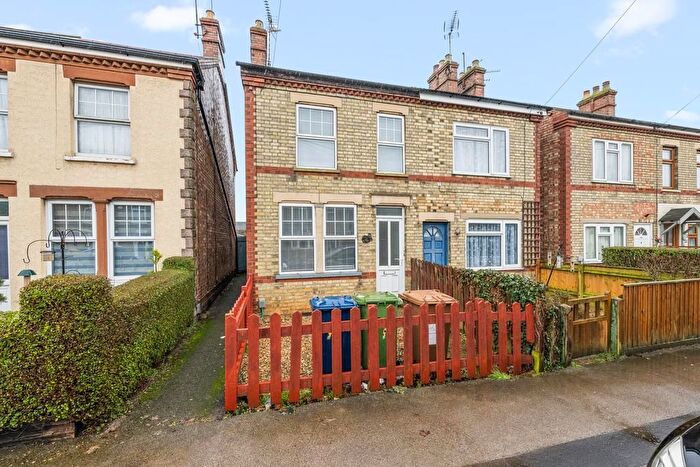
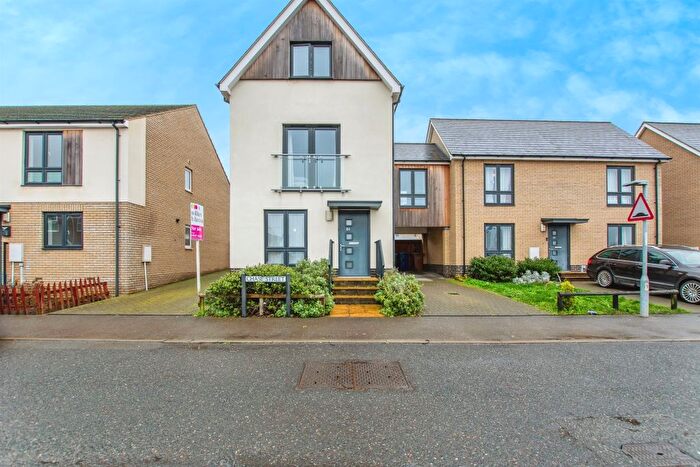
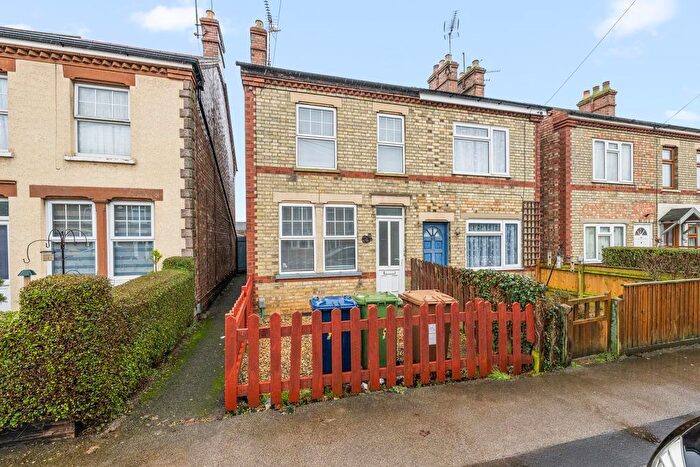
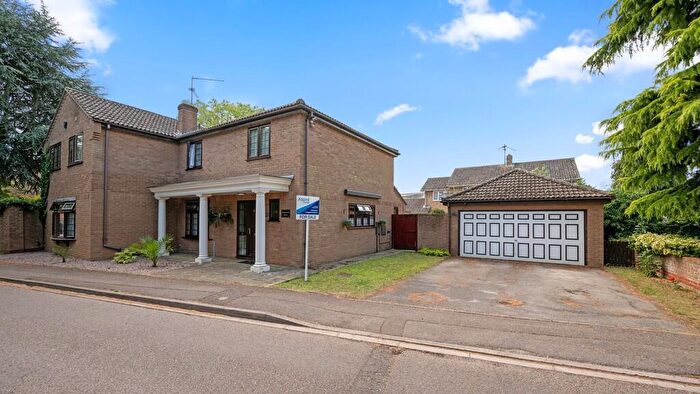
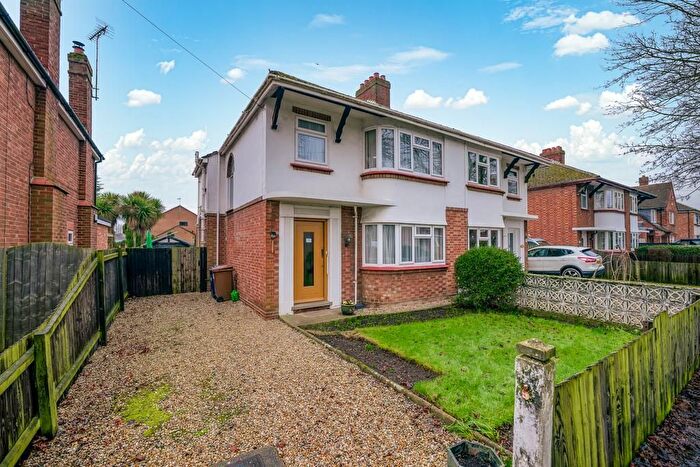
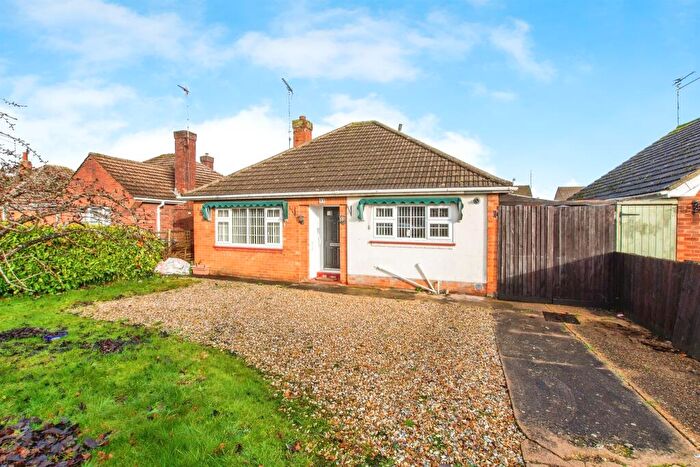
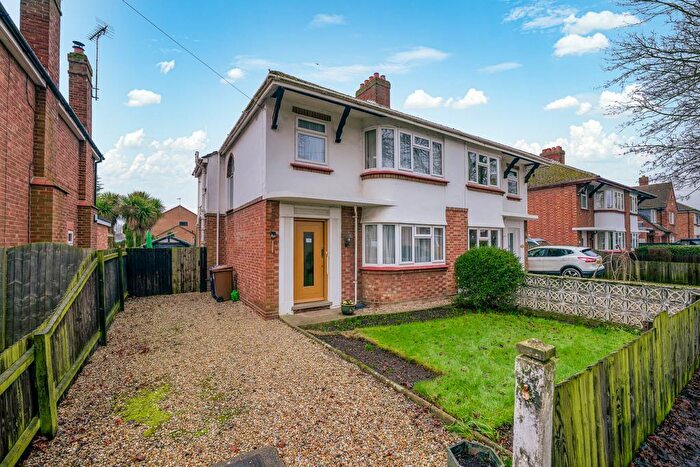
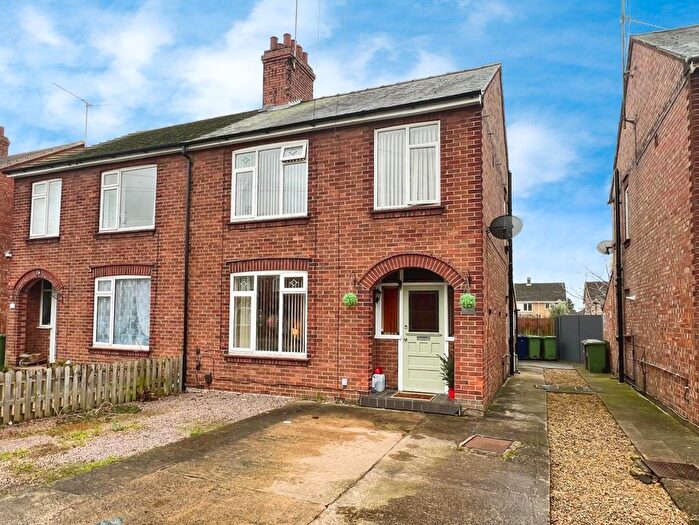
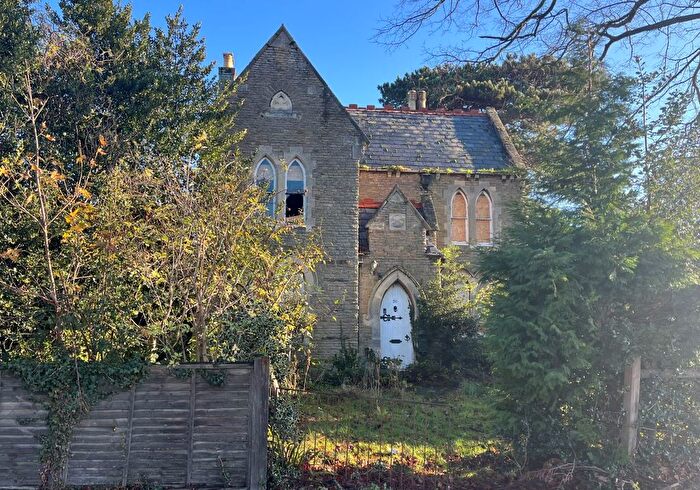
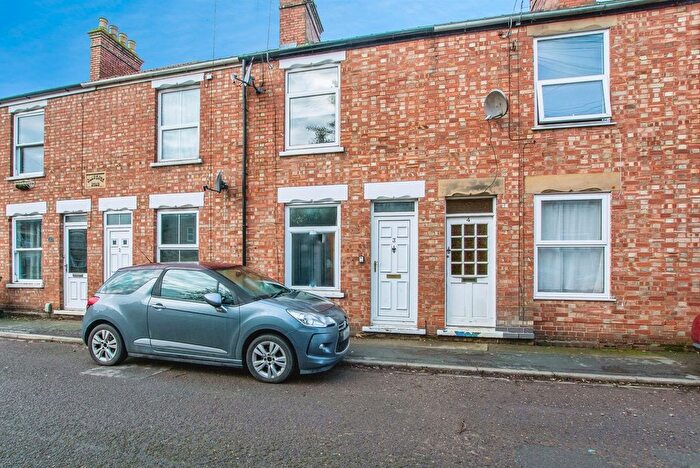
Properties for sale in Waterlees
Roads and Postcodes in Waterlees
Navigate through our locations to find the location of your next house in Waterlees, Wisbech for sale or to rent.
| Streets | Postcodes |
|---|---|
| Acacia Avenue | PE13 3LR PE13 3LW |
| Admirals Drive | PE13 3PU PE13 3PX |
| Apeldoorn Walk | PE13 3HP |
| Armada Close | PE13 3QF |
| Bath Road | PE13 3NH PE13 3NJ PE13 3NL |
| Beatrice Road | PE13 3PE |
| Beechwood Close | PE13 3PH |
| Beechwood Road | PE13 3PF |
| Braeburn Avenue | PE13 3PZ |
| Bramley Road | PE13 3PA |
| Buckingham Walk | PE13 3HL |
| Cherry Road | PE13 3NP PE13 3PJ PE13 3PL |
| Coblands | PE13 3BF |
| Coldhorn Crescent | PE13 3HA |
| Conference Way | PE13 3QG |
| Crab Marsh | PE13 3JG |
| Eastfield Road | PE13 3EJ |
| Edinburgh Drive | PE13 3LJ PE13 3LN PE13 3LP |
| Goddard Crescent | PE13 3NT |
| Godwin Road | PE13 3HR |
| Granger Close | PE13 3FB |
| Grosvenor Road | PE13 3NB PE13 3NS PE13 3NX |
| Haley Close | PE13 3PS |
| Hawthorne Avenue | PE13 3LB |
| Hedgelands | PE13 3BA |
| Henson Close | PE13 3PT |
| Jubilee Walk | PE13 3HW |
| Kinderley Road | PE13 3PP PE13 3PW |
| Kooreman Avenue | PE13 3HY |
| Lime Avenue | PE13 3LL |
| Lynn Road | PE13 3DY PE13 3DZ |
| Maple Avenue | PE13 3LS |
| Mount Pleasant Road | PE13 3LE PE13 3LH PE13 3LT PE13 3NA PE13 3NE |
| Myles Way | PE13 3PY |
| Nursery Drive | PE13 3ES |
| Ollard Avenue | PE13 3EY PE13 3HF |
| Osborne Road | PE13 3JP PE13 3JW PE13 3JX |
| Payne Avenue | PE13 3HS |
| Prince Of Wales Close | PE13 3HN |
| Prins Avenue | PE13 3HU |
| Prins Court | PE13 3HT |
| Savory Road | PE13 3LA |
| Sherwood Avenue | PE13 3HG |
| Southfields Close | PE13 3XG |
| Southwell Road | PE13 3LF PE13 3LG PE13 3LQ |
| St Martins Road | PE13 3EX |
| St Michaels Avenue | PE13 3NR PE13 3NW |
| Storbeck Road | PE13 3ND |
| Tindall Close | PE13 3PN PE13 3QT |
| Tinkers Drove | PE13 3PQ |
| Walton Road | PE13 3EL PE13 3EN PE13 3EP PE13 3ER PE13 3ET PE13 3EW PE13 3HH |
| Waterlees Road | PE13 3EG PE13 3EH PE13 3EZ PE13 3HB PE13 3HE PE13 3PG |
| Westfield Road | PE13 3EU |
| Weston Miller Drive | PE13 3LD |
| Windmill Gardens | PE14 7YA |
| Windsor Drive | PE13 3HJ |
| Worcester Road | PE13 3PB |
Transport near Waterlees
- FAQ
- Price Paid By Year
- Property Type Price
Frequently asked questions about Waterlees
What is the average price for a property for sale in Waterlees?
The average price for a property for sale in Waterlees is £164,539. This amount is 27% lower than the average price in Wisbech. There are 1,495 property listings for sale in Waterlees.
What streets have the most expensive properties for sale in Waterlees?
The streets with the most expensive properties for sale in Waterlees are St Martins Road at an average of £351,250, Eastfield Road at an average of £278,333 and Walton Road at an average of £240,900.
What streets have the most affordable properties for sale in Waterlees?
The streets with the most affordable properties for sale in Waterlees are Admirals Drive at an average of £110,909, Bramley Road at an average of £127,500 and Armada Close at an average of £129,600.
Which train stations are available in or near Waterlees?
Some of the train stations available in or near Waterlees are March, Watlington and Downham Market.
Property Price Paid in Waterlees by Year
The average sold property price by year was:
| Year | Average Sold Price | Price Change |
Sold Properties
|
|---|---|---|---|
| 2025 | £165,951 | -0,3% |
50 Properties |
| 2024 | £166,445 | 3% |
65 Properties |
| 2023 | £161,452 | -5% |
63 Properties |
| 2022 | £168,931 | 10% |
74 Properties |
| 2021 | £151,879 | 6% |
83 Properties |
| 2020 | £142,791 | 4% |
54 Properties |
| 2019 | £136,421 | 0,4% |
73 Properties |
| 2018 | £135,860 | 3% |
90 Properties |
| 2017 | £131,147 | 8% |
88 Properties |
| 2016 | £121,067 | 8% |
80 Properties |
| 2015 | £111,711 | -1% |
80 Properties |
| 2014 | £112,852 | 10% |
59 Properties |
| 2013 | £101,926 | 9% |
64 Properties |
| 2012 | £92,608 | -7% |
32 Properties |
| 2011 | £99,405 | -11% |
45 Properties |
| 2010 | £110,467 | -0,1% |
46 Properties |
| 2009 | £110,528 | 3% |
30 Properties |
| 2008 | £107,617 | -9% |
47 Properties |
| 2007 | £117,535 | 6% |
164 Properties |
| 2006 | £110,657 | 5% |
120 Properties |
| 2005 | £105,651 | 2% |
110 Properties |
| 2004 | £103,181 | 24% |
144 Properties |
| 2003 | £78,389 | 16% |
169 Properties |
| 2002 | £65,895 | 23% |
221 Properties |
| 2001 | £50,575 | 5% |
171 Properties |
| 2000 | £47,934 | 16% |
154 Properties |
| 1999 | £40,325 | 16% |
110 Properties |
| 1998 | £34,057 | -3% |
83 Properties |
| 1997 | £34,959 | 12% |
80 Properties |
| 1996 | £30,819 | -5% |
66 Properties |
| 1995 | £32,338 | - |
76 Properties |
Property Price per Property Type in Waterlees
Here you can find historic sold price data in order to help with your property search.
The average Property Paid Price for specific property types in the last three years are:
| Property Type | Average Sold Price | Sold Properties |
|---|---|---|
| Semi Detached House | £159,488.00 | 72 Semi Detached Houses |
| Detached House | £220,548.00 | 41 Detached Houses |
| Terraced House | £135,739.00 | 64 Terraced Houses |
| Flat | £75,000.00 | 1 Flat |

