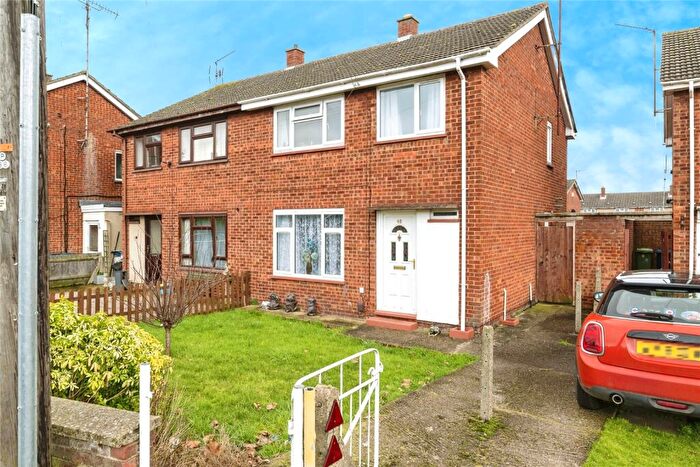
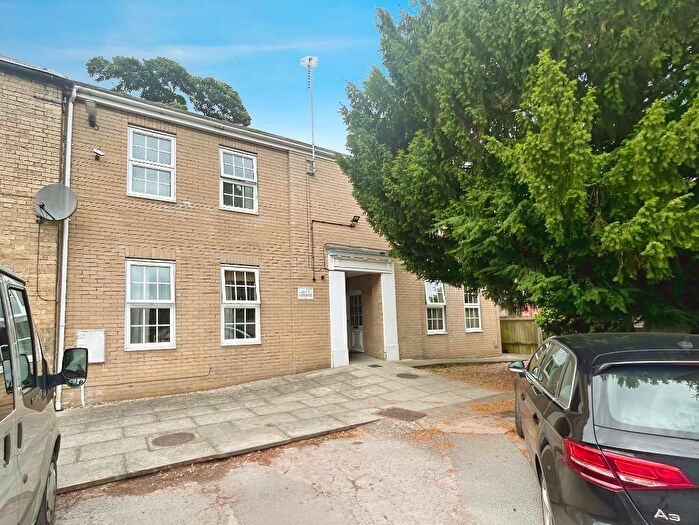
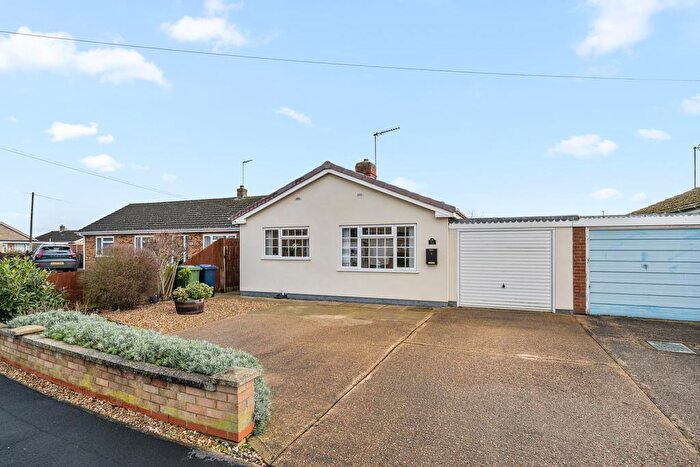
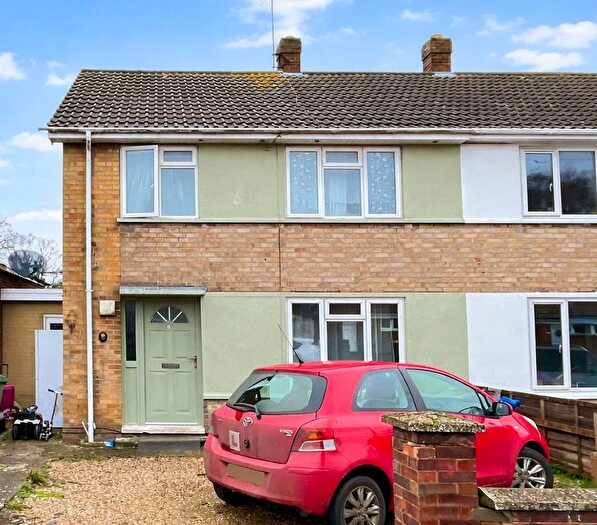
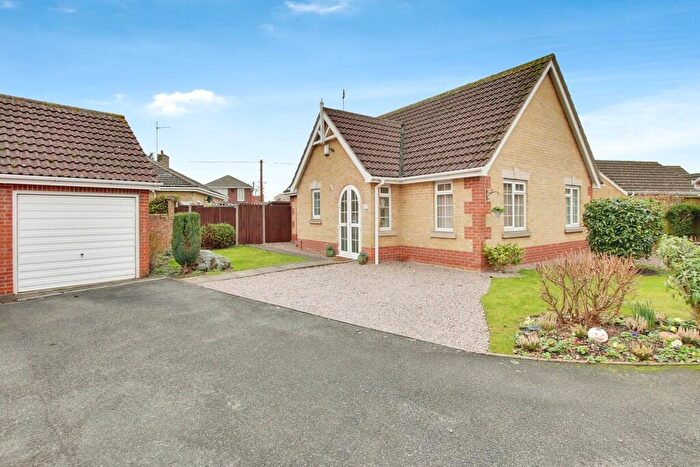
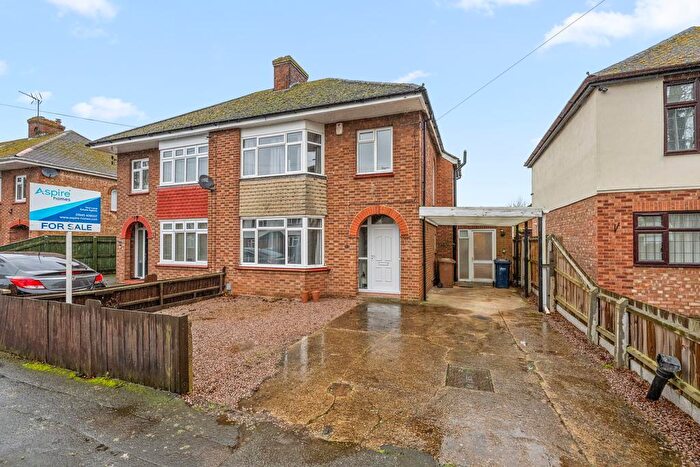
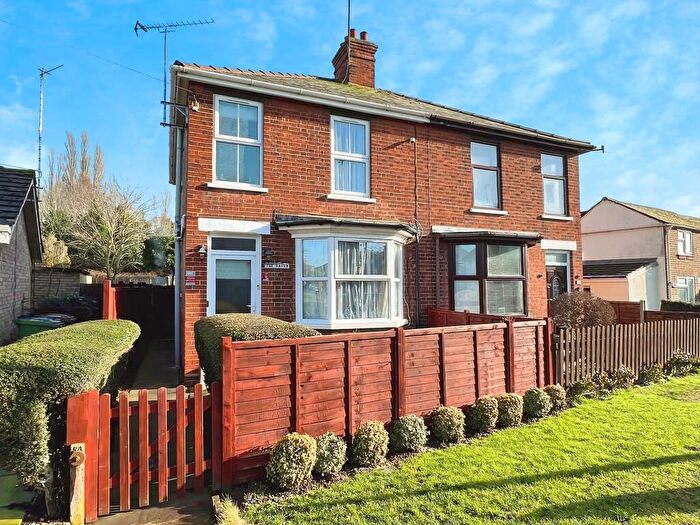
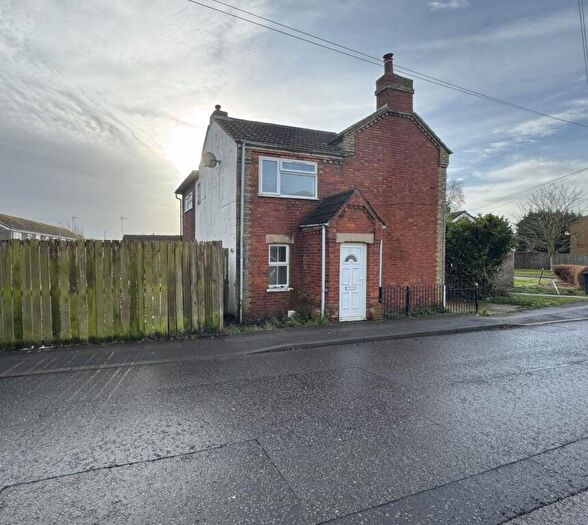
Houses for sale & to rent in Kirkgate, Wisbech
House Prices in Kirkgate
Properties in Kirkgate have an average house price of £205,080.00 and had 92 Property Transactions within the last 3 years¹.
Kirkgate is an area in Wisbech, Cambridgeshire with 924 households², where the most expensive property was sold for £550,000.00.
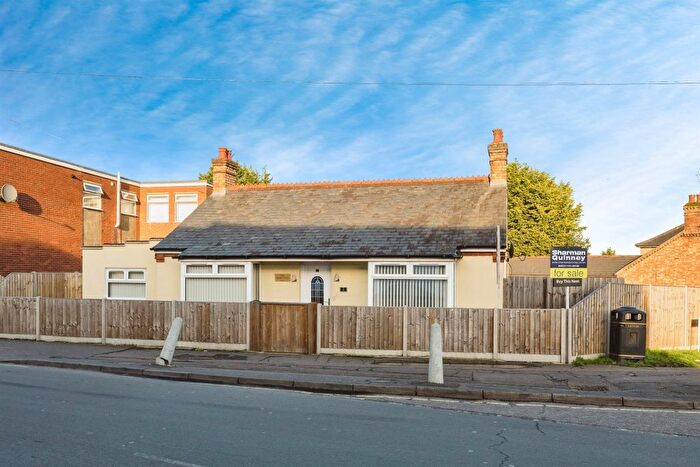
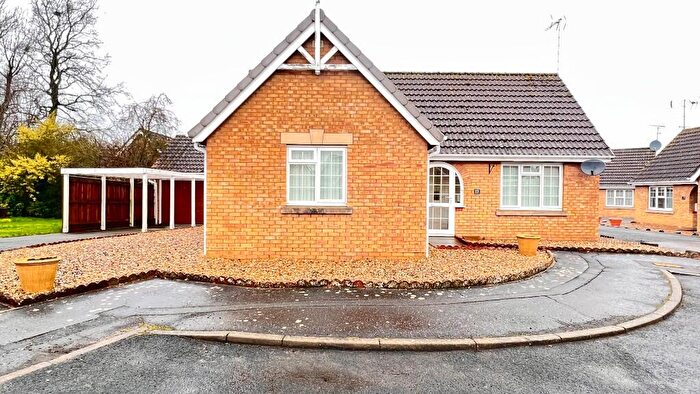
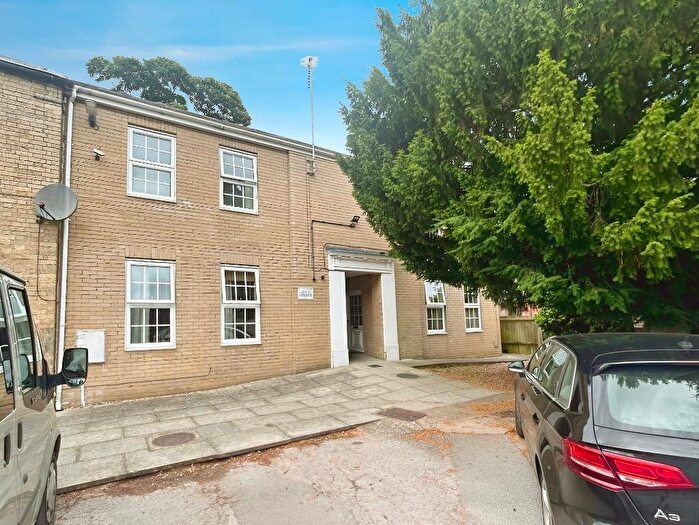
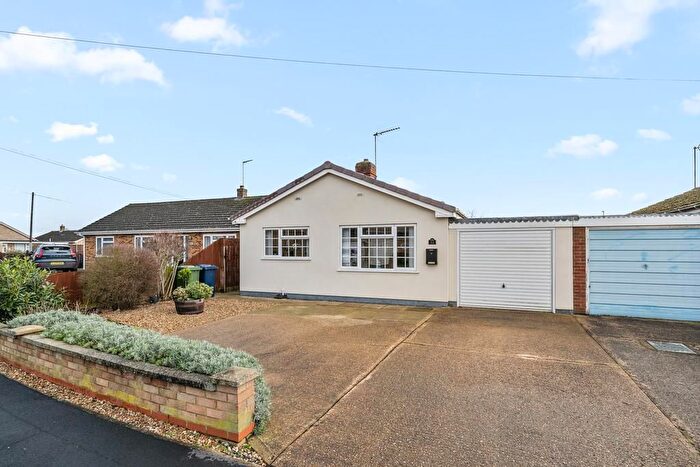
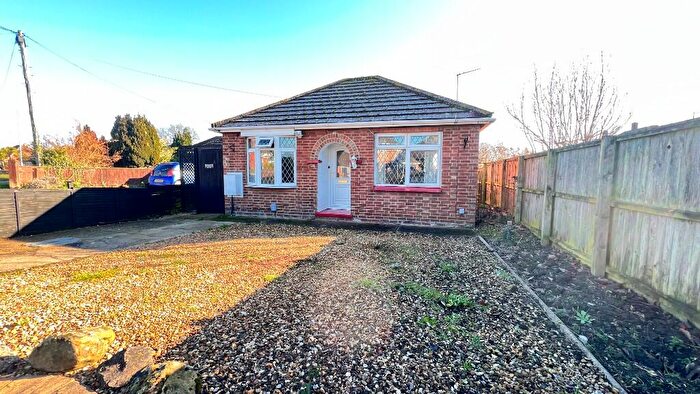
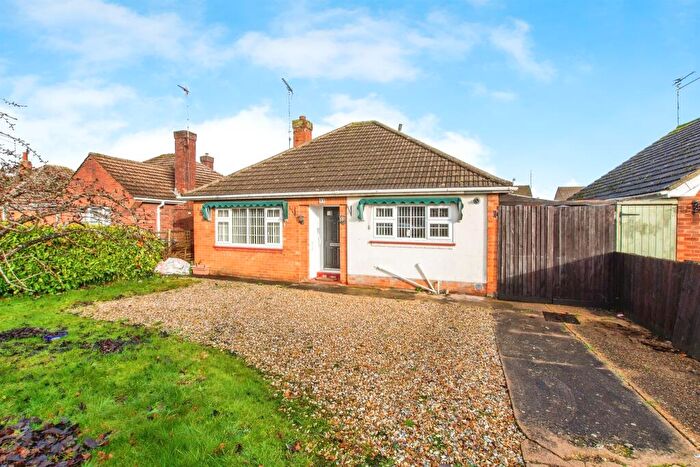
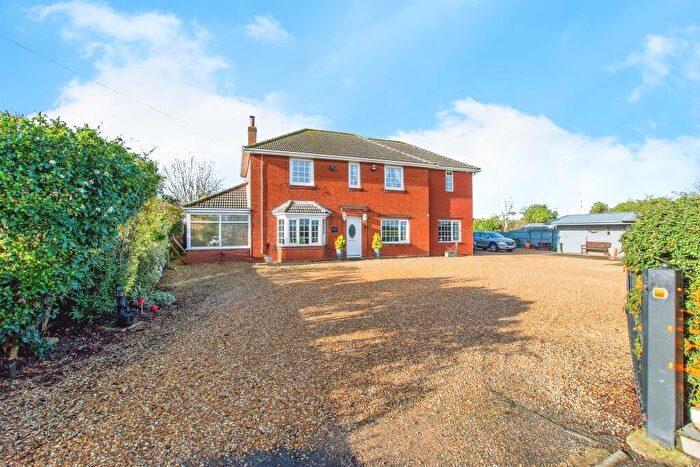
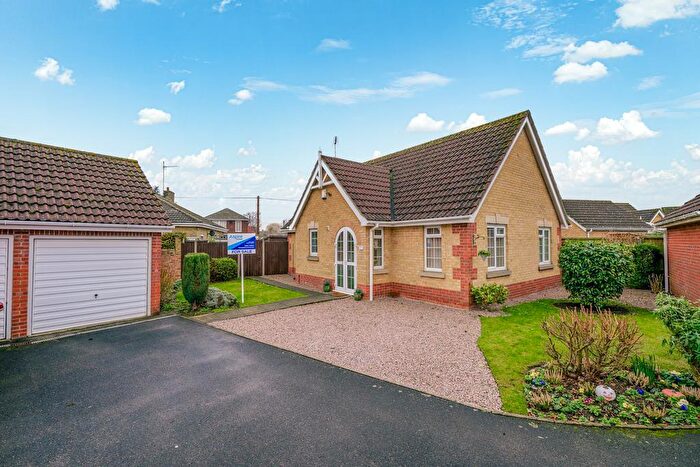
Properties for sale in Kirkgate
Roads and Postcodes in Kirkgate
Navigate through our locations to find the location of your next house in Kirkgate, Wisbech for sale or to rent.
| Streets | Postcodes |
|---|---|
| Apple Drive | PE13 3SE |
| Baxter Close | PE13 3UU |
| Black Bear Lane | PE13 3SA |
| Clarence Road | PE13 2ED |
| Fen Close | PE13 3HD |
| Fenland Road | PE13 3QB PE13 3QD |
| Fenmen Place | PE13 3FA |
| Grimmers Road | PE13 3QJ |
| Jasmin Close | PE13 3RN |
| Jeffery Avenue | PE13 3QY |
| Kirkgate Street | PE13 3QS PE13 3QZ PE13 3QP PE13 3QU PE13 3QX |
| Laburnum Close | PE13 3RJ |
| Lebanon Drive | PE13 3RX |
| Lerowe Road | PE13 3QA PE13 3QH PE13 3QL |
| Lilac Close | PE13 3RL |
| Lucombe Drive | PE13 3RZ |
| Lynn Road | PE13 3DP PE13 3EB PE13 3EE |
| Norwich Road | PE13 3LX PE13 3UJ PE13 3UQ |
| Oaklands Drive | PE13 3RY |
| Old Lynn Road | PE13 3SB PE14 7AJ |
| Pendula Road | PE13 3RR |
| Petts Close | PE13 3QE |
| Rectory Gardens | PE13 3UH |
| Rowan Close | PE13 3RW |
| Sandringham Avenue | PE13 3ED |
| Sefton Avenue | PE13 3QN PE13 3QW |
| Smockmill Place | PE13 3SF |
| Steeple View | PE13 3NZ |
| Trafford Park | PE13 2DF |
| Trafford Road | PE13 2ES |
| Turnpike Close | PE13 3UR |
| Westminster Close | PE13 3RE |
| Wistaria Road | PE13 3RH |
| York Gardens | PE13 2EE |
| York Road | PE13 2EB |
Transport near Kirkgate
- FAQ
- Price Paid By Year
- Property Type Price
Frequently asked questions about Kirkgate
What is the average price for a property for sale in Kirkgate?
The average price for a property for sale in Kirkgate is £205,080. This amount is 9% lower than the average price in Wisbech. There are 1,299 property listings for sale in Kirkgate.
What streets have the most expensive properties for sale in Kirkgate?
The streets with the most expensive properties for sale in Kirkgate are Old Lynn Road at an average of £425,000, Lynn Road at an average of £303,375 and Fenland Road at an average of £272,000.
What streets have the most affordable properties for sale in Kirkgate?
The streets with the most affordable properties for sale in Kirkgate are Norwich Road at an average of £110,290, Clarence Road at an average of £122,750 and York Road at an average of £150,437.
Which train stations are available in or near Kirkgate?
Some of the train stations available in or near Kirkgate are March, Watlington and Downham Market.
Property Price Paid in Kirkgate by Year
The average sold property price by year was:
| Year | Average Sold Price | Price Change |
Sold Properties
|
|---|---|---|---|
| 2025 | £199,484 | 1% |
35 Properties |
| 2024 | £196,714 | -16% |
35 Properties |
| 2023 | £227,295 | 7% |
22 Properties |
| 2022 | £211,468 | 12% |
63 Properties |
| 2021 | £186,281 | 2% |
69 Properties |
| 2020 | £183,470 | 8% |
42 Properties |
| 2019 | £169,063 | -0,4% |
67 Properties |
| 2018 | £169,815 | 4% |
72 Properties |
| 2017 | £162,182 | 10% |
41 Properties |
| 2016 | £146,715 | 1% |
51 Properties |
| 2015 | £144,547 | 18% |
37 Properties |
| 2014 | £117,999 | 3% |
32 Properties |
| 2013 | £114,012 | -3% |
39 Properties |
| 2012 | £117,370 | -9% |
27 Properties |
| 2011 | £128,470 | -1% |
26 Properties |
| 2010 | £129,979 | -5% |
30 Properties |
| 2009 | £136,047 | 18% |
21 Properties |
| 2008 | £111,880 | -13% |
34 Properties |
| 2007 | £126,363 | 1% |
69 Properties |
| 2006 | £125,149 | -6% |
68 Properties |
| 2005 | £132,802 | 16% |
38 Properties |
| 2004 | £110,988 | 17% |
55 Properties |
| 2003 | £91,971 | 13% |
53 Properties |
| 2002 | £79,653 | 16% |
68 Properties |
| 2001 | £67,056 | 15% |
70 Properties |
| 2000 | £57,156 | 14% |
50 Properties |
| 1999 | £49,368 | 1% |
53 Properties |
| 1998 | £48,924 | -3% |
64 Properties |
| 1997 | £50,512 | 10% |
74 Properties |
| 1996 | £45,592 | 5% |
30 Properties |
| 1995 | £43,156 | - |
22 Properties |
Property Price per Property Type in Kirkgate
Here you can find historic sold price data in order to help with your property search.
The average Property Paid Price for specific property types in the last three years are:
| Property Type | Average Sold Price | Sold Properties |
|---|---|---|
| Semi Detached House | £192,910.00 | 39 Semi Detached Houses |
| Detached House | £254,257.00 | 33 Detached Houses |
| Terraced House | £165,250.00 | 16 Terraced Houses |
| Flat | £77,362.00 | 4 Flats |

