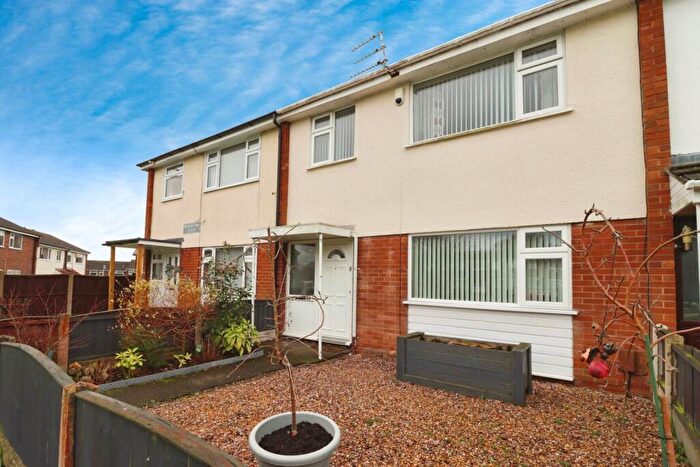
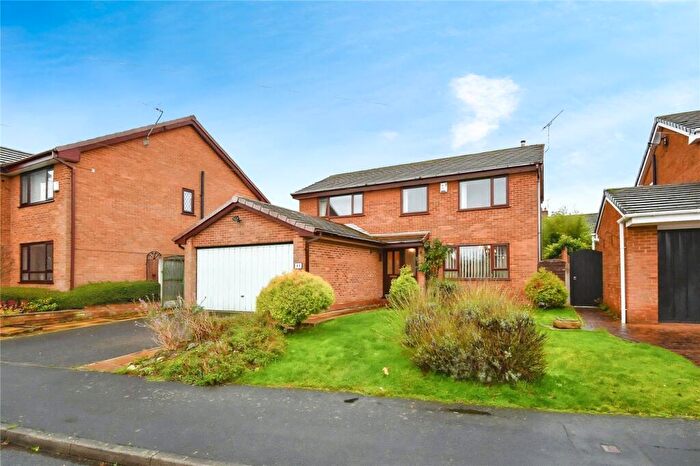
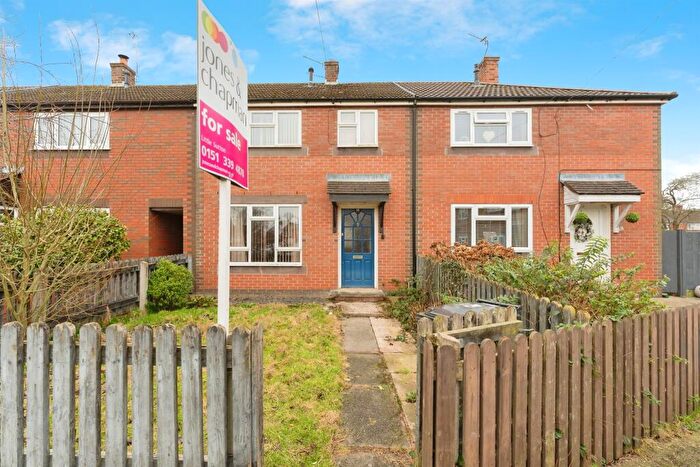
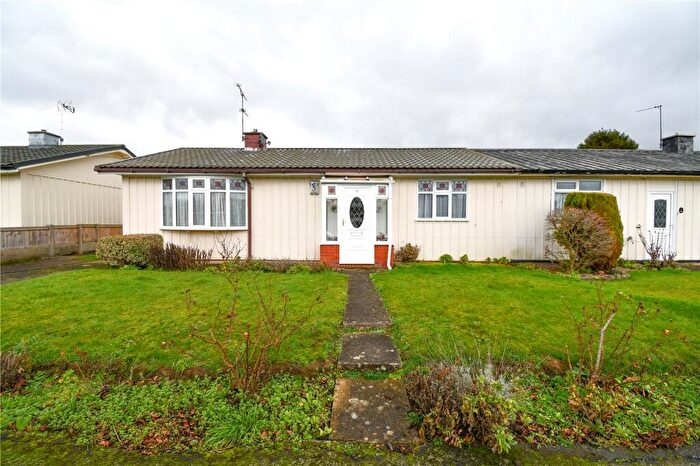
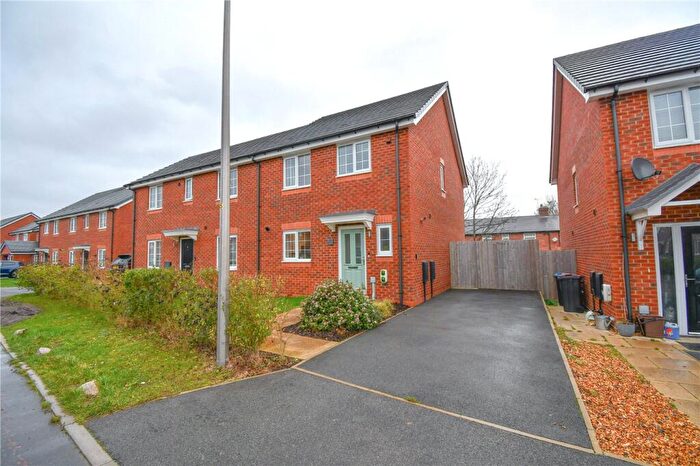
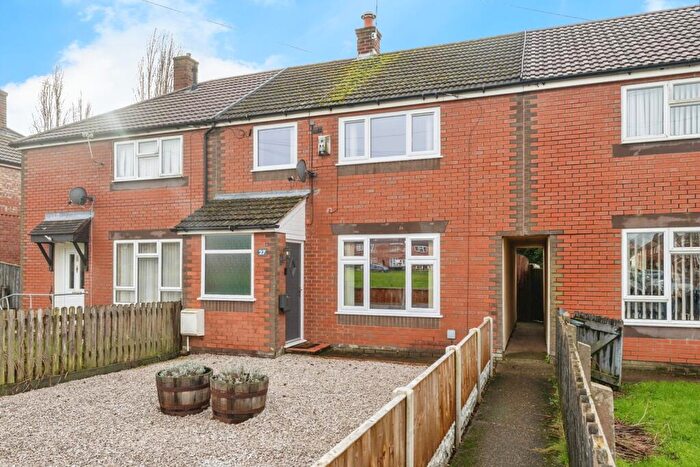
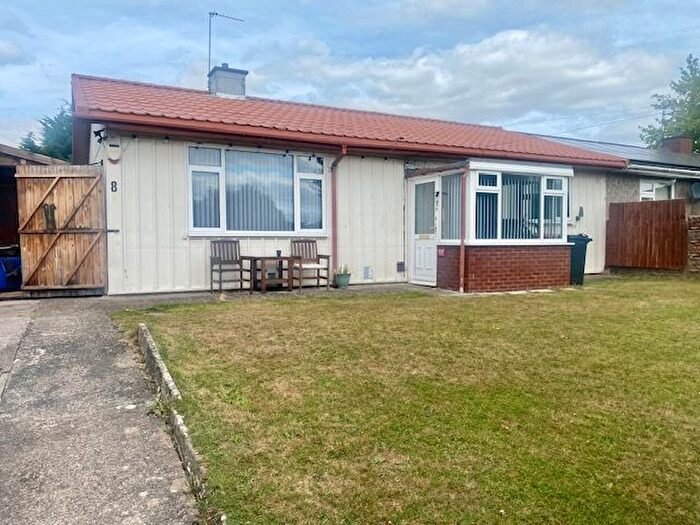
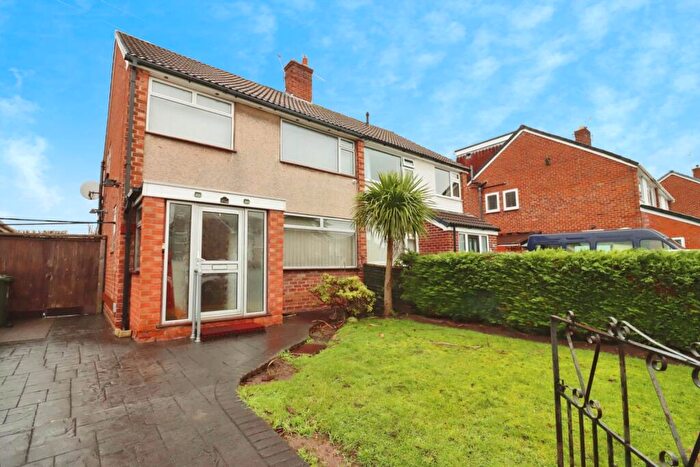
Houses for sale & to rent in Netherpool, Ellesmere Port
House Prices in Netherpool
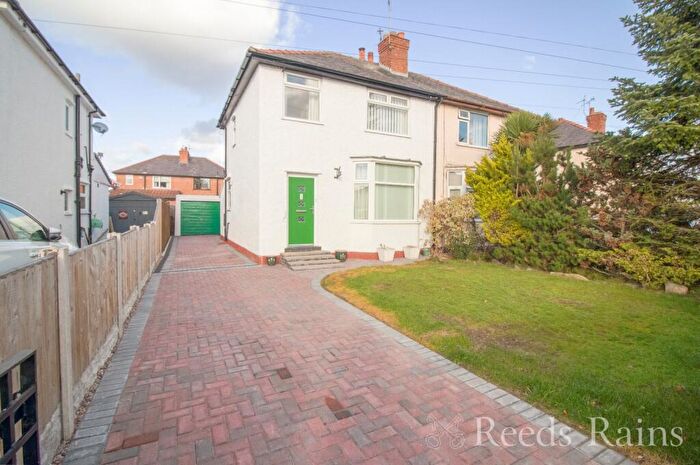
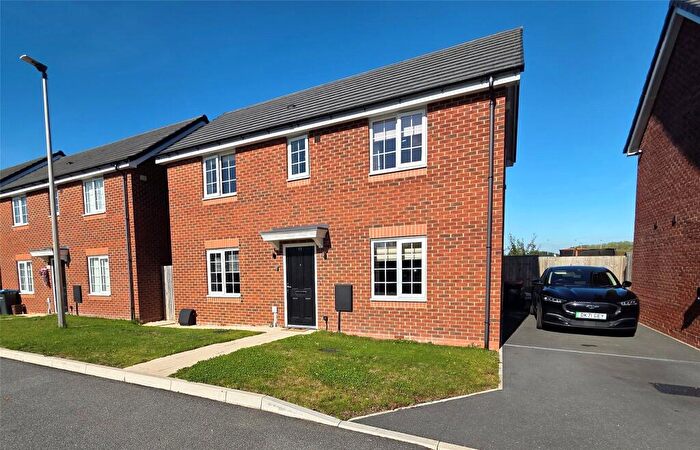
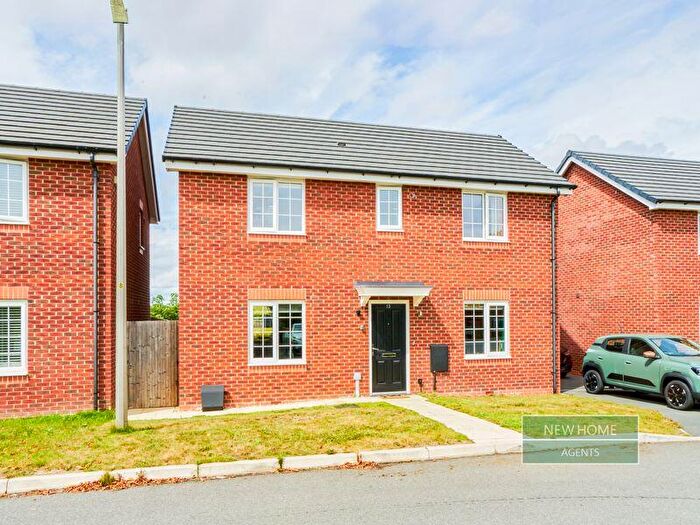
Properties in Netherpool have an average house price of £175,123.00 and had 146 Property Transactions within the last 3 years¹.
Netherpool is an area in Ellesmere Port, Cheshire with 1,489 households², where the most expensive property was sold for £385,000.00.
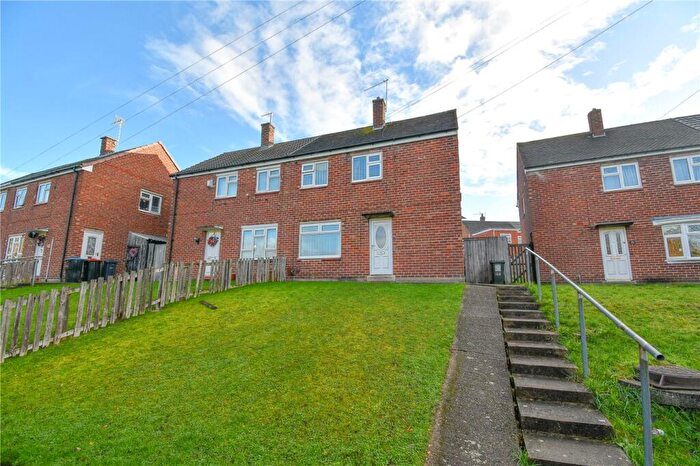
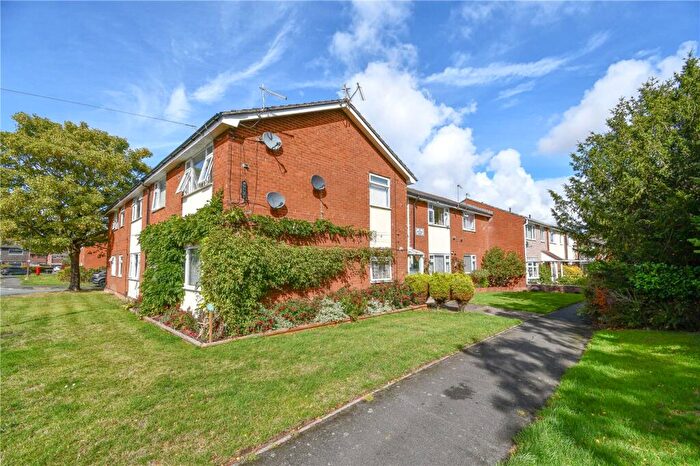
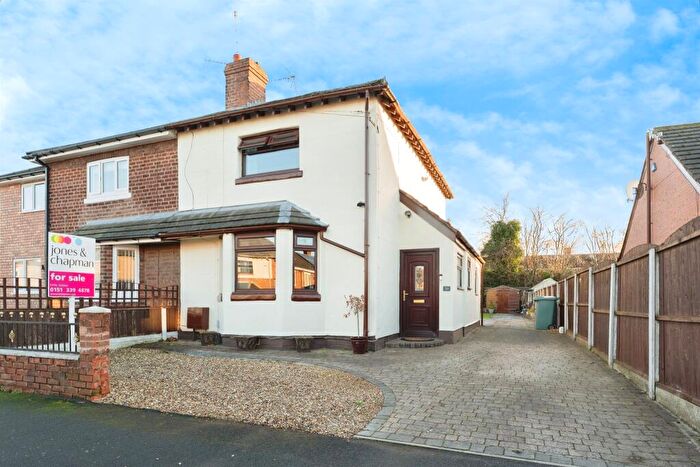
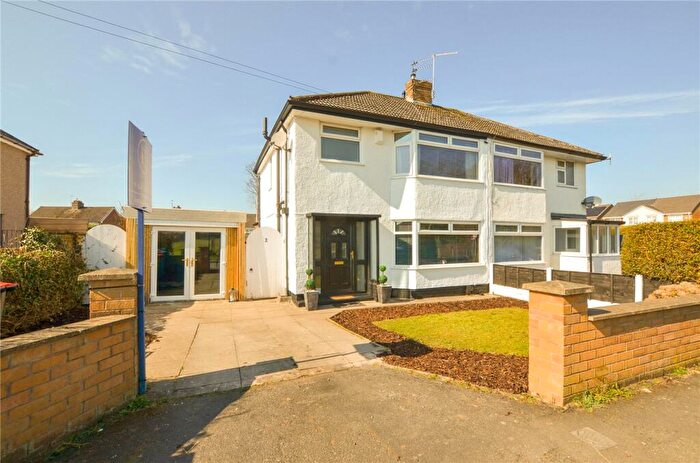
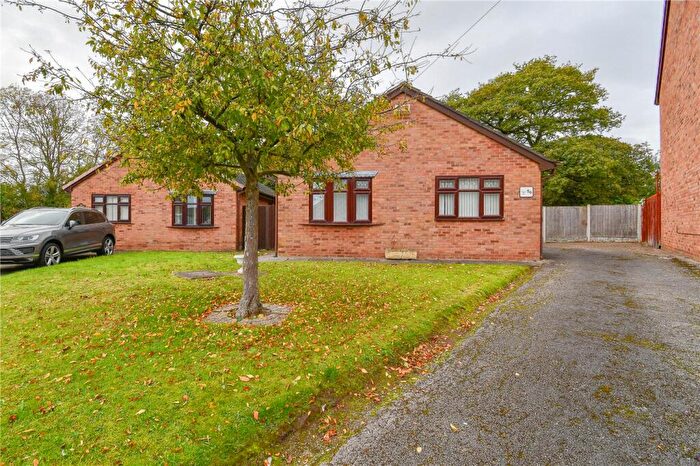
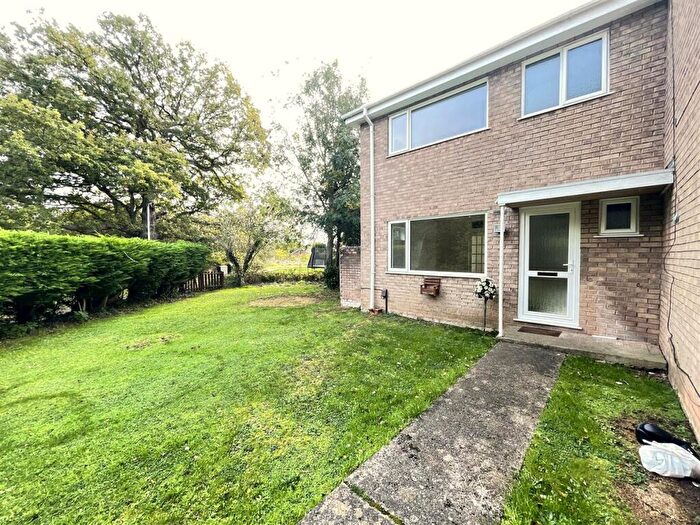
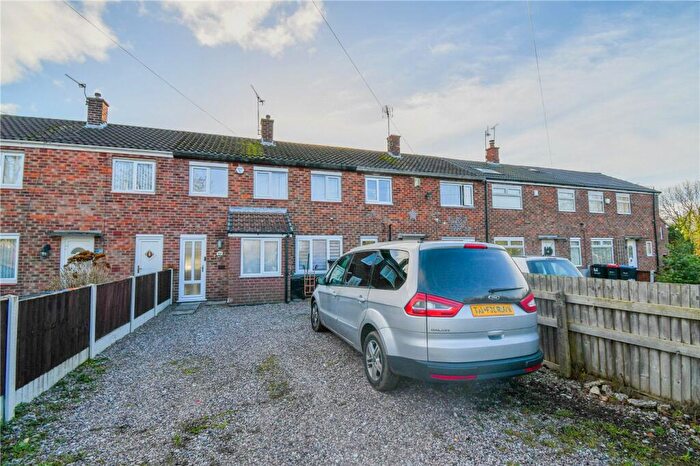
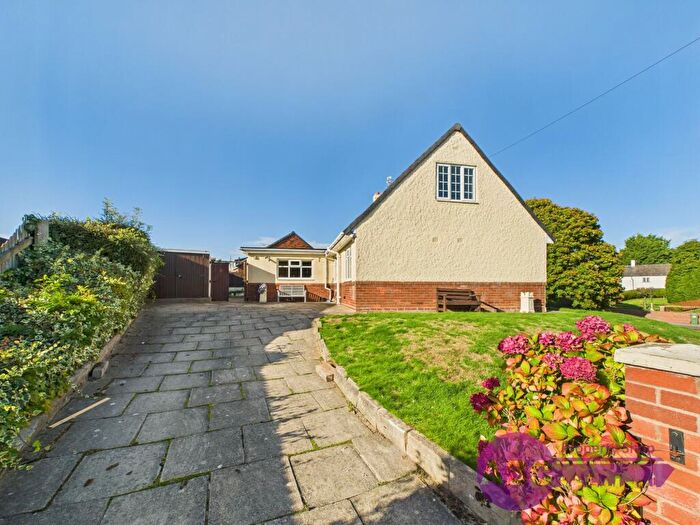
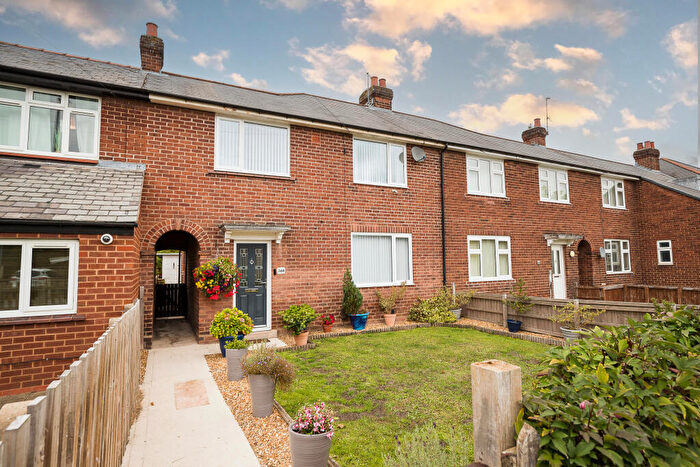
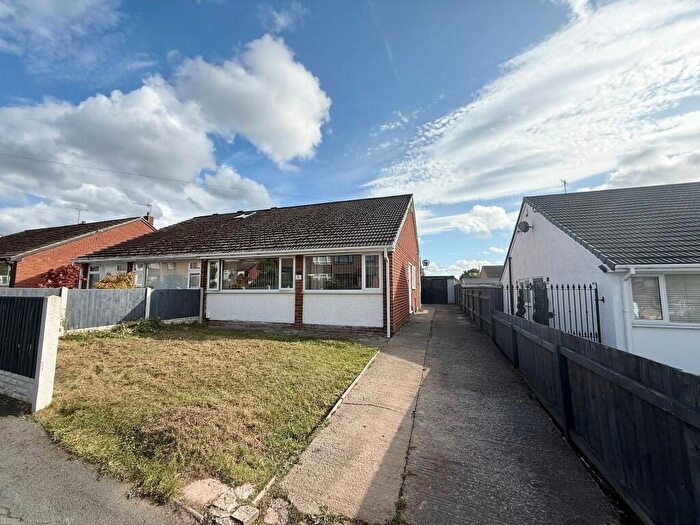
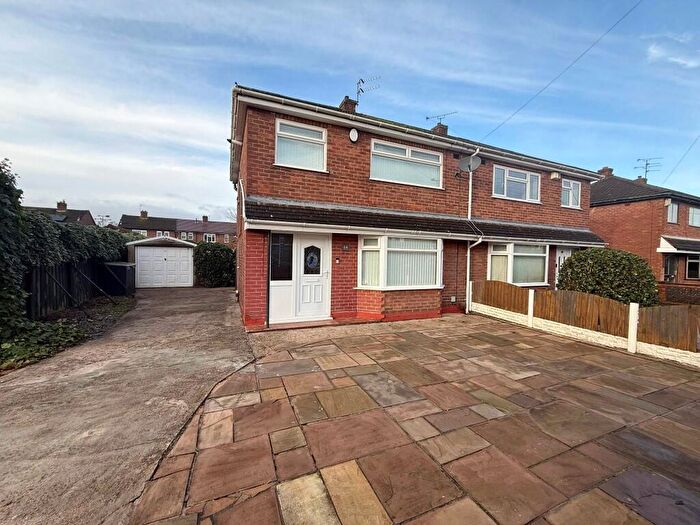
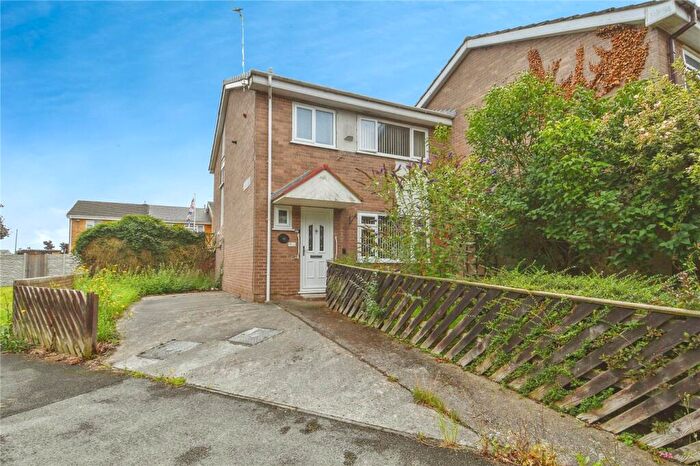
Properties for sale in Netherpool
Roads and Postcodes in Netherpool
Navigate through our locations to find the location of your next house in Netherpool, Ellesmere Port for sale or to rent.
| Streets | Postcodes |
|---|---|
| Airfield Way | CH65 1BJ CH65 1BQ |
| Almond Way | CH66 1SX |
| Atlas Way | CH66 1TL |
| Bailey Avenue | CH65 3BH CH65 3BJ CH65 3BL CH65 3BP |
| Beverley Way | CH66 1RB |
| Blackstairs Road | CH66 1TX |
| Bracken Way | CH66 1AD |
| Campion Place | CH66 1AE |
| Carlton Crescent | CH66 1SN |
| Childwall Court | CH66 1RJ |
| Childwall Gardens | CH66 1RL |
| Clayhill Green | CH66 1HN |
| Craig Gardens | CH66 1LA |
| Crossley Avenue | CH66 1LT |
| Croughton Road | CH66 1RP |
| Elbrus Drive | CH66 1TN |
| Eric Fountain Road | CH65 1AX |
| Ferguson Avenue | CH66 1NB CH66 1ND |
| Forest Road | CH66 1JY CH66 1JZ |
| Gateacre Court | CH66 1RH |
| Gowy Court | CH66 1RG |
| Hillside Drive | CH66 1JL CH66 1JP CH66 1JR CH66 1JS |
| Himalayan Birch Close | CH66 1SU |
| Huxley Court | CH66 1TF |
| Lowland Court | CH66 1AA |
| Matterhorn Road | CH66 1TR |
| Moelwyn Drive | CH66 1TY |
| Moorland Road | CH66 1LH |
| Mulberry Park | CH66 1SZ |
| Naylor Close | CH66 1TH |
| Naylor Crescent | CH66 1TP CH66 1TW |
| Naylor Green | CH66 1TJ |
| Naylor Place | CH66 1TU |
| Naylor Road | CH66 1SD |
| Naylor Walk | CH66 1TQ |
| North Road | CH65 1AB CH65 1AD CH65 1AE CH65 1AF CH65 1AL CH65 1AQ CH65 1BA CH65 1BW |
| Overpool Road | CH66 1JN CH66 1JW |
| Plantation Drive | CH66 1JT CH66 1JU |
| Plemston Court | CH66 1TE |
| Poole Hall Lane | CH66 1SS |
| Rivacre Brow | CH66 1LE CH66 1LF |
| Rivacre Road | CH66 1LG CH66 1LJ CH66 1LL CH66 1LN CH66 1LQ CH66 1NJ |
| Rivacre View | CH66 1AF |
| Rossmore Road East | CH65 3BN CH65 3BW |
| Rossmore Road West | CH66 1LP CH66 1LR CH66 1LS CH66 1LW |
| Scafell Close | CH66 1TZ |
| Seymour Drive | CH66 1LU CH66 1LX CH66 1LY CH66 1LZ CH66 1NA |
| Stapleford Court | CH66 1RW |
| Station Green | CH66 1QD |
| Straker Avenue | CH65 3BD CH65 3BE CH65 3BG CH65 3BQ |
| The Breck | CH66 1LB |
| Thornleigh Drive | CH66 1NE CH66 1NF |
| Tryfan Way | CH66 1TS |
| Vauxhall Supply Park | CH65 1BL |
| Warren Drive | CH66 1LD |
| Wavertree Court | CH66 1RN |
| Wellswood Road | CH66 1JX |
| West Road | CH65 1BD |
| Westenra Avenue | CH65 3AU CH65 3AX CH65 3AY CH65 3AZ |
| Woodacre Grove | CH66 1TD |
| Woodacre Road | CH66 1SW |
| Woodend Road | CH65 3BA CH65 3BB |
| Woolton Court | CH66 1RQ |
Transport near Netherpool
-
Overpool Station
-
Little Sutton Station
-
Ellesmere Port Station
-
Capenhurst Station
-
Hooton Station
-
Eastham Rake Station
- FAQ
- Price Paid By Year
- Property Type Price
Frequently asked questions about Netherpool
What is the average price for a property for sale in Netherpool?
The average price for a property for sale in Netherpool is £175,123. This amount is 16% lower than the average price in Ellesmere Port. There are 405 property listings for sale in Netherpool.
What streets have the most expensive properties for sale in Netherpool?
The streets with the most expensive properties for sale in Netherpool are Matterhorn Road at an average of £354,750, Atlas Way at an average of £274,000 and Mulberry Park at an average of £247,200.
What streets have the most affordable properties for sale in Netherpool?
The streets with the most affordable properties for sale in Netherpool are Plemston Court at an average of £70,000, Naylor Road at an average of £113,166 and Plantation Drive at an average of £115,000.
Which train stations are available in or near Netherpool?
Some of the train stations available in or near Netherpool are Overpool, Little Sutton and Ellesmere Port.
Property Price Paid in Netherpool by Year
The average sold property price by year was:
| Year | Average Sold Price | Price Change |
Sold Properties
|
|---|---|---|---|
| 2025 | £189,932 | 13% |
42 Properties |
| 2024 | £165,244 | -4% |
42 Properties |
| 2023 | £171,783 | 4% |
62 Properties |
| 2022 | £165,113 | 4% |
44 Properties |
| 2021 | £159,162 | 1% |
65 Properties |
| 2020 | £157,974 | 7% |
52 Properties |
| 2019 | £146,820 | -6% |
67 Properties |
| 2018 | £155,098 | 14% |
48 Properties |
| 2017 | £134,020 | 0,4% |
71 Properties |
| 2016 | £133,485 | -3% |
64 Properties |
| 2015 | £137,258 | -4% |
68 Properties |
| 2014 | £142,934 | 8% |
86 Properties |
| 2013 | £131,960 | -2% |
70 Properties |
| 2012 | £134,805 | 5% |
43 Properties |
| 2011 | £127,827 | -19% |
49 Properties |
| 2010 | £152,408 | 3% |
37 Properties |
| 2009 | £147,497 | -7% |
42 Properties |
| 2008 | £158,414 | 13% |
42 Properties |
| 2007 | £137,834 | 10% |
155 Properties |
| 2006 | £124,032 | 11% |
116 Properties |
| 2005 | £109,931 | 8% |
42 Properties |
| 2004 | £100,854 | 35% |
54 Properties |
| 2003 | £65,561 | 19% |
59 Properties |
| 2002 | £53,291 | 7% |
42 Properties |
| 2001 | £49,714 | 7% |
43 Properties |
| 2000 | £46,244 | 4% |
38 Properties |
| 1999 | £44,614 | 11% |
37 Properties |
| 1998 | £39,838 | 9% |
37 Properties |
| 1997 | £36,360 | -4% |
32 Properties |
| 1996 | £37,675 | -9% |
20 Properties |
| 1995 | £40,943 | - |
16 Properties |
Property Price per Property Type in Netherpool
Here you can find historic sold price data in order to help with your property search.
The average Property Paid Price for specific property types in the last three years are:
| Property Type | Average Sold Price | Sold Properties |
|---|---|---|
| Semi Detached House | £177,633.00 | 73 Semi Detached Houses |
| Detached House | £288,999.00 | 16 Detached Houses |
| Terraced House | £162,222.00 | 37 Terraced Houses |
| Flat | £98,725.00 | 20 Flats |

