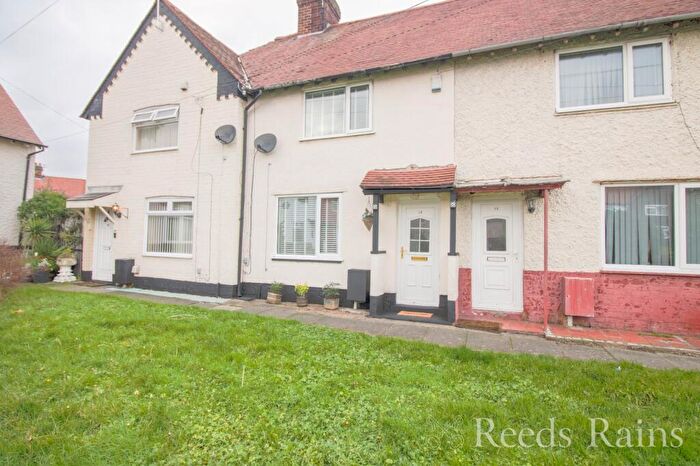
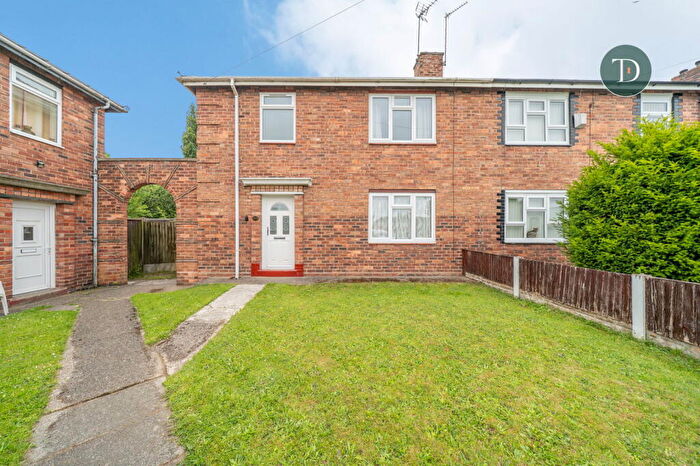
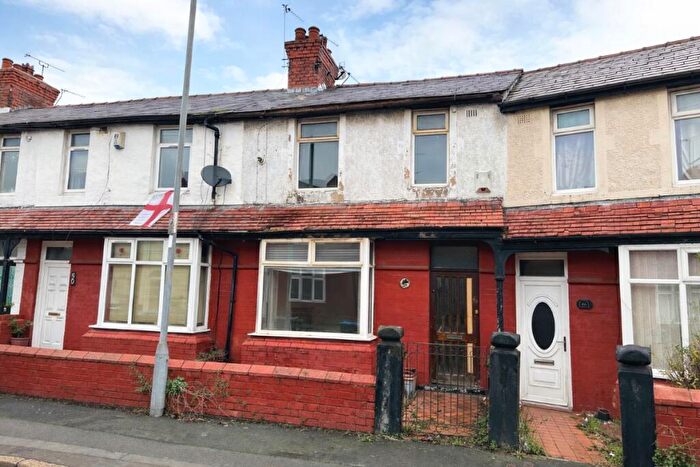
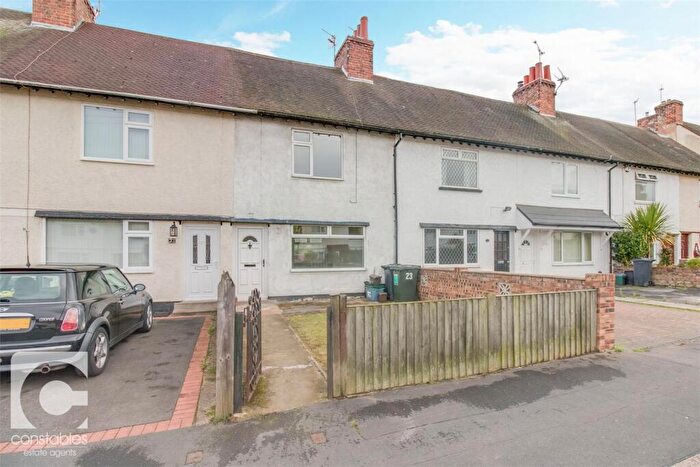
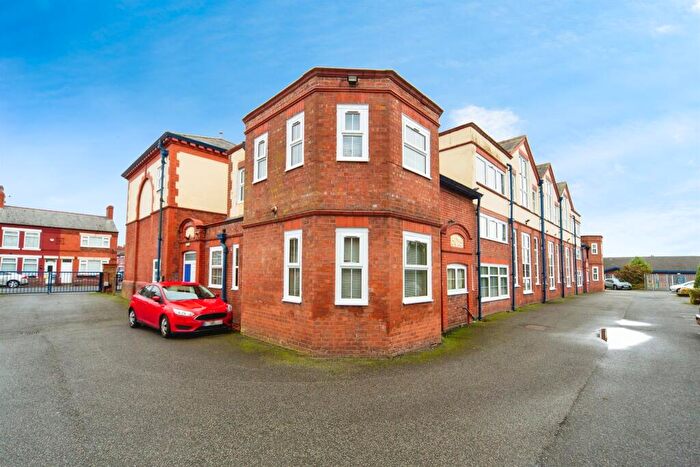
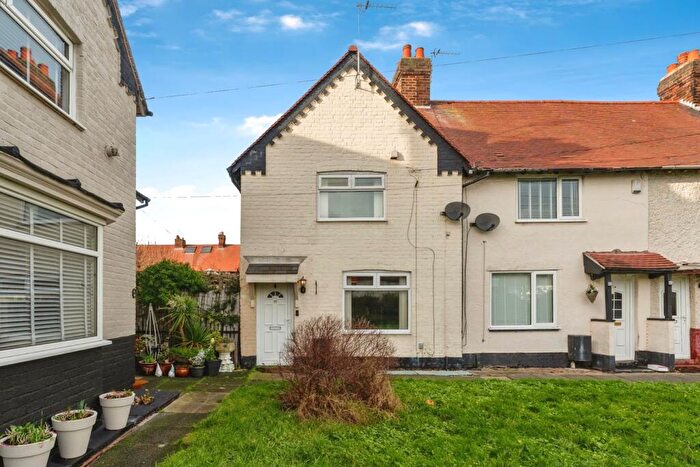
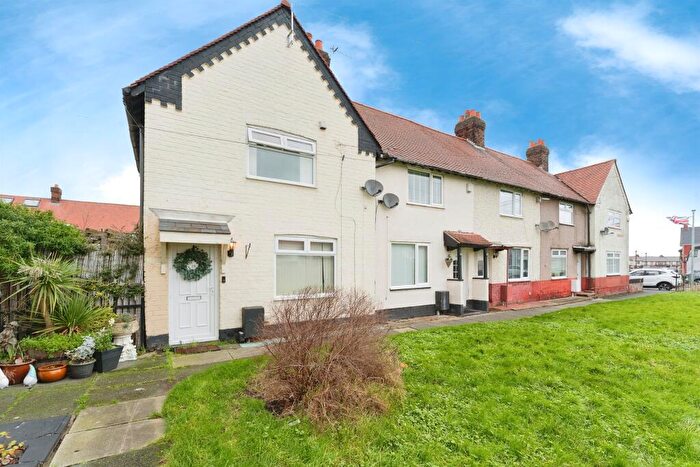
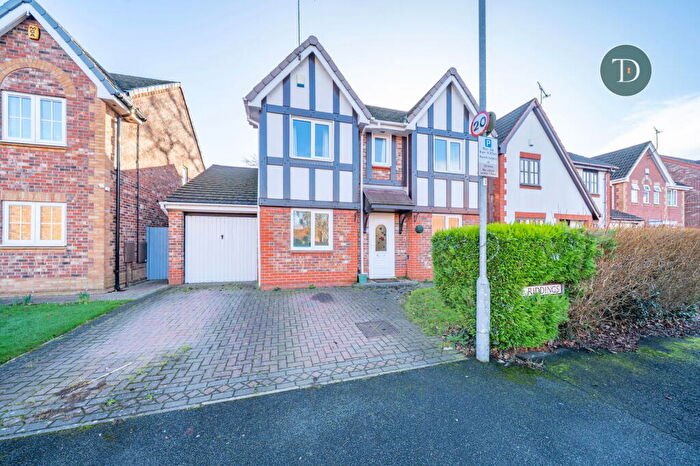
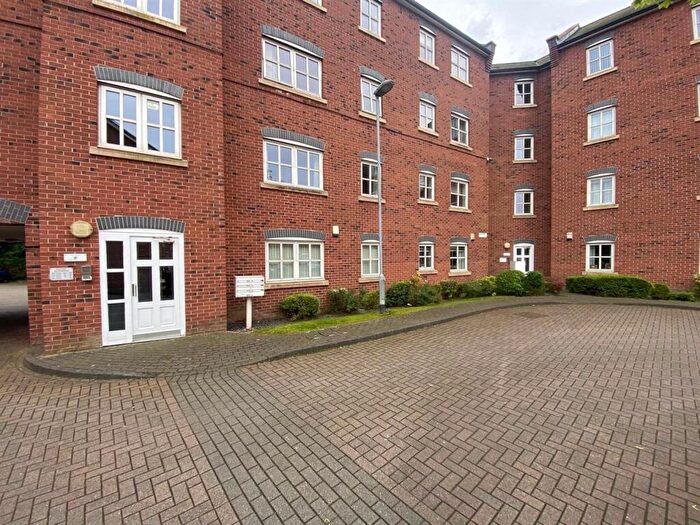
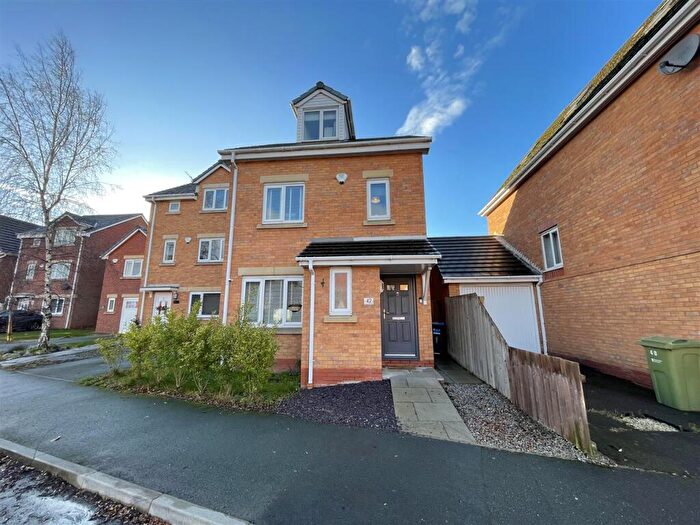
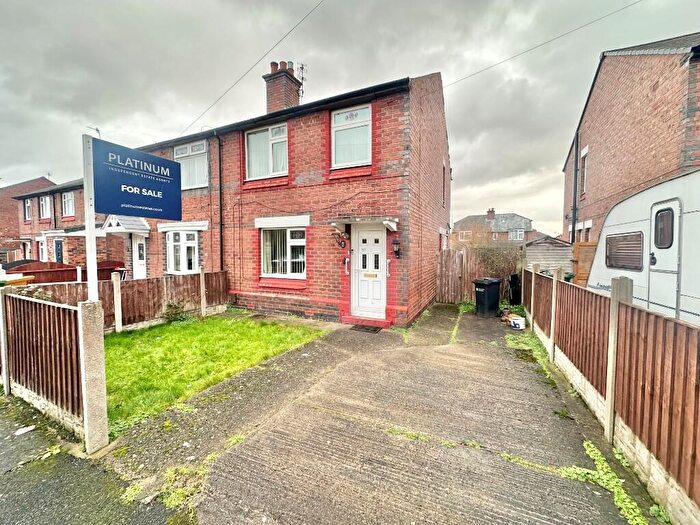
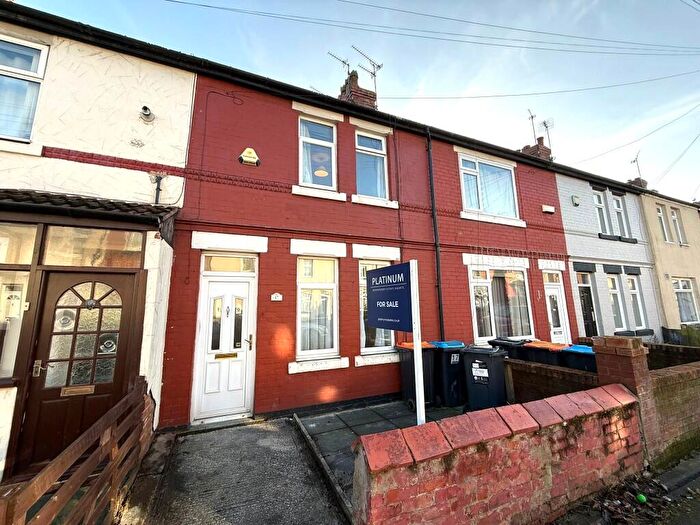
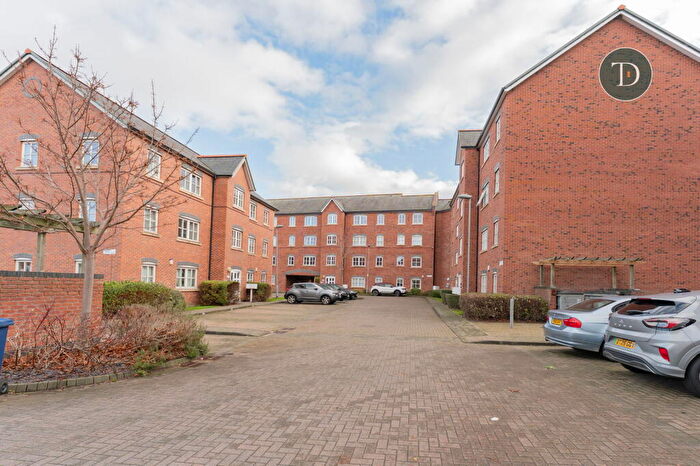
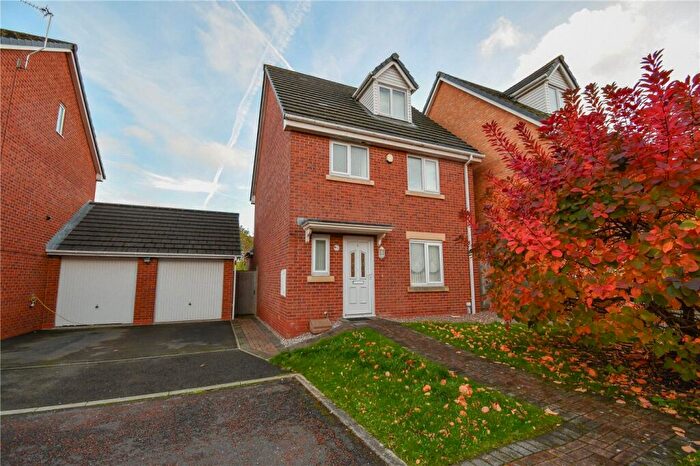
Houses for sale & to rent in Rossmore, Ellesmere Port
House Prices in Rossmore
Properties in Rossmore have an average house price of £135,224.00 and had 194 Property Transactions within the last 3 years¹.
Rossmore is an area in Ellesmere Port, Cheshire with 1,661 households², where the most expensive property was sold for £330,000.00.
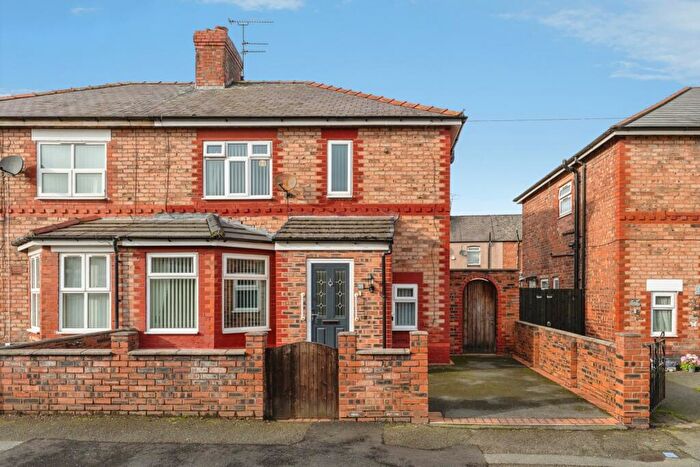
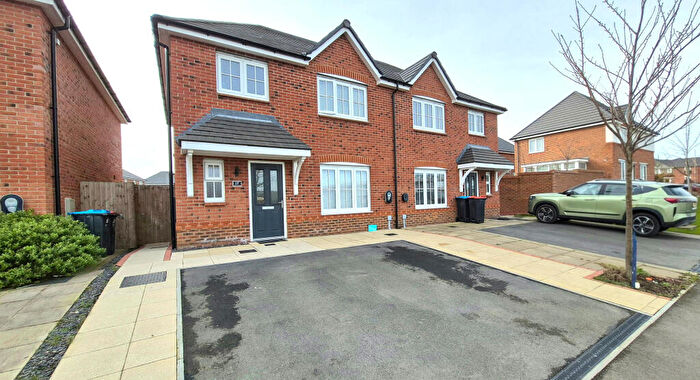
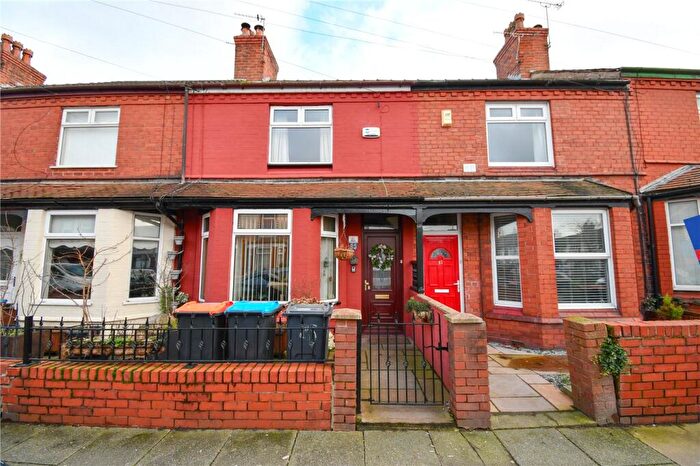
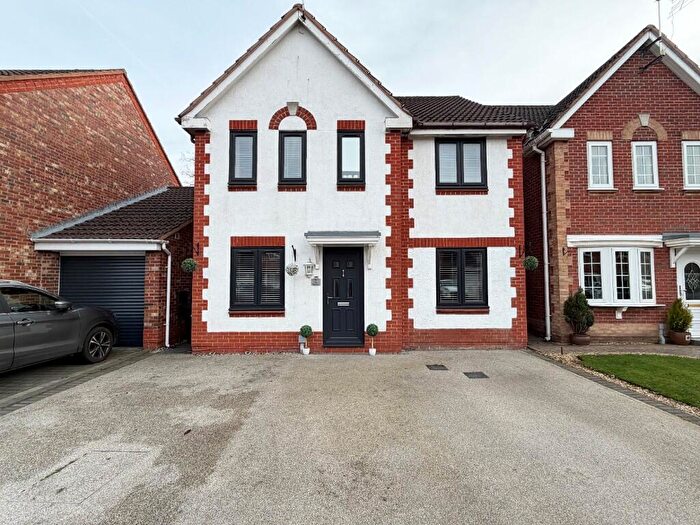
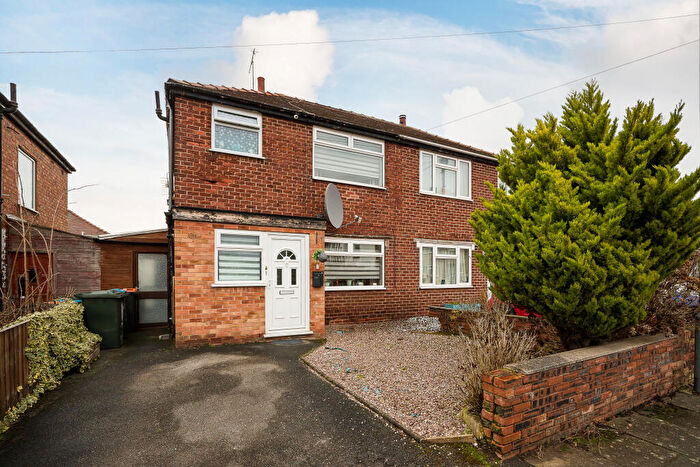
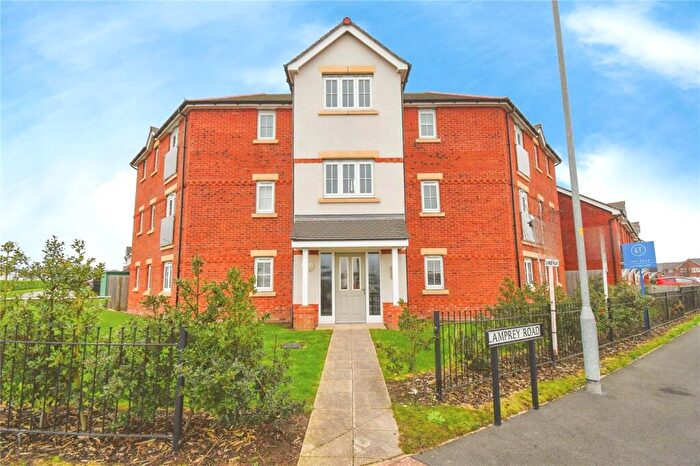
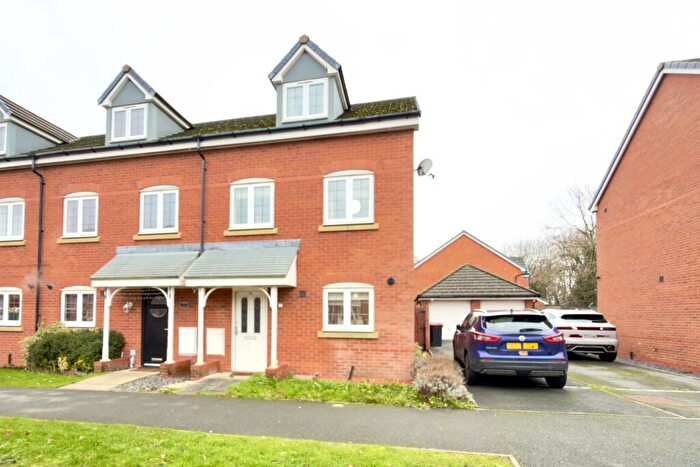
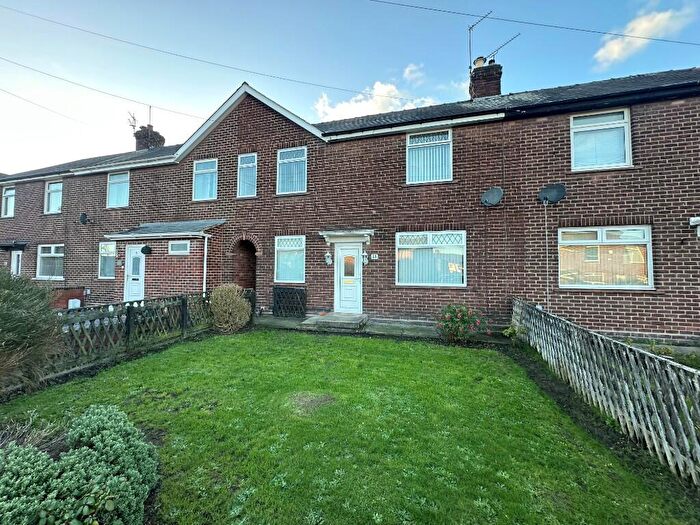
Properties for sale in Rossmore
Roads and Postcodes in Rossmore
Navigate through our locations to find the location of your next house in Rossmore, Ellesmere Port for sale or to rent.
| Streets | Postcodes |
|---|---|
| Aire Close | CH65 3DW |
| Alexandra Street | CH65 2BL |
| Blakemere Court | CH65 2HA |
| Broad Birches | CH65 3AB |
| Chapel Close | CH65 2HP |
| Charles Price Gardens | CH65 2DP |
| Church Parade | CH65 2ER |
| Church Street | CH65 2AA CH65 2AB CH65 2AD CH65 2DR CH65 2DS CH65 2DT |
| Church Walk | CH65 2EP |
| Clover Birches | CH65 3BY |
| Colemere Court | CH65 2EZ |
| Cook Street | CH65 4AT |
| Crescent Road | CH65 4DY CH65 4DZ |
| Cressington Gardens | CH65 2BT |
| Dove Close | CH66 1SR |
| Edward Street | CH65 2BP |
| Egerton Street | CH65 2BY |
| Eleanor Street | CH65 4BB |
| Errington Avenue | CH65 2EB |
| Fleming Street | CH65 4BA |
| Frome Court | CH65 2HE |
| George Street | CH65 2BR |
| Grace Road | CH65 2BH CH65 2BJ CH65 2EH CH65 2EJ |
| Grafton Road | CH65 2BD |
| Grosvenor Wharf Road | CH65 4AL CH65 4AS CH65 4AY |
| Hallwood Walk | CH65 3AR |
| Jacks Wood Avenue | CH65 3BT |
| Jacks Wood Green | CH65 3AE |
| John Nicholas Crescent | CH65 2DL |
| John Street | CH65 2ED |
| King Street | CH65 4AZ |
| Leven Walk | CH66 1SP |
| Lime Street | CH65 2AY CH65 2AZ |
| Little Birches | CH65 3BX |
| Livingstone Road | CH65 2BE |
| Lydden Road | CH65 2HG |
| Meadow Lane | CH65 4EW |
| Merseyton Road | CH65 2AW |
| Nelson Road | CH65 2BB |
| New Grosvenor Road | CH65 2HH |
| Old Church Close | CH65 2HU |
| Percival Road | CH65 2DD CH65 2DE CH65 2DF CH65 2DG |
| Poole Hall Industrial Estate | CH66 1ST |
| Raddle Wharf | CH65 4FY |
| Redhillswood Close | CH65 3AP |
| Rosswood Road | CH65 3BU |
| Slackswood Close | CH65 3AH |
| Standingwood Road | CH65 3AG |
| Stanley Road | CH65 2BQ |
| Station Road | CH65 4BH CH65 4BQ CH65 4BW |
| Stour Court | CH65 2HF |
| Sunnyside | CH65 2HD |
| Swale Road | CH65 3DL |
| Tees Court | CH65 3DJ |
| Telfords Quay | CH65 4FL |
| Ure Court | CH65 3DN |
| Wellwood Close | CH65 3AF |
| Westminster Grove | CH65 2DU |
| Westminster Road | CH65 2BU CH65 2BX CH65 2EE CH65 2EF CH65 2EG CH65 2EQ |
| Wharfe Lane | CH65 3DQ |
| Whitemere Court | CH65 2EY |
| Wilkinson Street | CH65 2DX CH65 2DY CH65 2DZ |
| Wilkinson Street North | CH65 2BN |
| William Johnson Gardens | CH65 2DW |
| Worcester Street | CH65 4DA |
| Worcester Walk | CH65 2ES CH65 2ET |
Transport near Rossmore
-
Ellesmere Port Station
-
Overpool Station
-
Little Sutton Station
-
Capenhurst Station
-
Stanlow and Thornton Station
- FAQ
- Price Paid By Year
- Property Type Price
Frequently asked questions about Rossmore
What is the average price for a property for sale in Rossmore?
The average price for a property for sale in Rossmore is £135,224. This amount is 35% lower than the average price in Ellesmere Port. There are 733 property listings for sale in Rossmore.
What streets have the most expensive properties for sale in Rossmore?
The streets with the most expensive properties for sale in Rossmore are Broad Birches at an average of £299,950, Rosswood Road at an average of £247,500 and Jacks Wood Avenue at an average of £239,705.
What streets have the most affordable properties for sale in Rossmore?
The streets with the most affordable properties for sale in Rossmore are Grafton Road at an average of £80,000, Percival Road at an average of £80,800 and Station Road at an average of £81,000.
Which train stations are available in or near Rossmore?
Some of the train stations available in or near Rossmore are Ellesmere Port, Overpool and Little Sutton.
Property Price Paid in Rossmore by Year
The average sold property price by year was:
| Year | Average Sold Price | Price Change |
Sold Properties
|
|---|---|---|---|
| 2025 | £129,821 | 5% |
55 Properties |
| 2024 | £122,781 | -22% |
64 Properties |
| 2023 | £149,805 | -1% |
75 Properties |
| 2022 | £150,964 | 19% |
103 Properties |
| 2021 | £122,308 | 19% |
78 Properties |
| 2020 | £98,810 | -9% |
59 Properties |
| 2019 | £107,317 | -2% |
73 Properties |
| 2018 | £109,066 | -2% |
60 Properties |
| 2017 | £111,419 | -3% |
68 Properties |
| 2016 | £114,399 | 19% |
55 Properties |
| 2015 | £92,854 | -19% |
53 Properties |
| 2014 | £110,892 | -6% |
63 Properties |
| 2013 | £117,757 | 9% |
46 Properties |
| 2012 | £107,700 | -10% |
47 Properties |
| 2011 | £118,401 | 0,2% |
71 Properties |
| 2010 | £118,175 | 0,1% |
66 Properties |
| 2009 | £118,045 | 6% |
65 Properties |
| 2008 | £111,039 | 6% |
65 Properties |
| 2007 | £104,009 | 15% |
117 Properties |
| 2006 | £88,525 | 5% |
62 Properties |
| 2005 | £84,128 | 13% |
59 Properties |
| 2004 | £73,505 | 14% |
105 Properties |
| 2003 | £63,450 | 32% |
79 Properties |
| 2002 | £43,366 | 7% |
100 Properties |
| 2001 | £40,460 | 19% |
69 Properties |
| 2000 | £32,950 | -6% |
64 Properties |
| 1999 | £34,880 | -1% |
56 Properties |
| 1998 | £35,093 | -7% |
46 Properties |
| 1997 | £37,476 | 14% |
43 Properties |
| 1996 | £32,146 | -2% |
36 Properties |
| 1995 | £32,880 | - |
40 Properties |
Property Price per Property Type in Rossmore
Here you can find historic sold price data in order to help with your property search.
The average Property Paid Price for specific property types in the last three years are:
| Property Type | Average Sold Price | Sold Properties |
|---|---|---|
| Semi Detached House | £158,912.00 | 37 Semi Detached Houses |
| Detached House | £264,284.00 | 19 Detached Houses |
| Terraced House | £117,394.00 | 85 Terraced Houses |
| Flat | £101,018.00 | 53 Flats |

