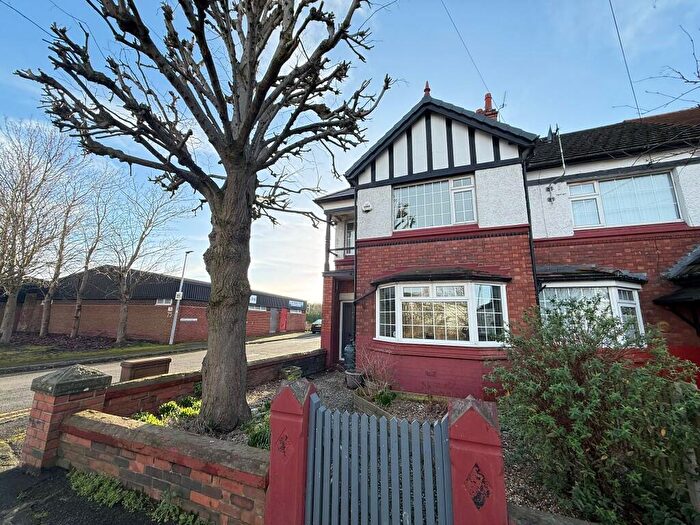
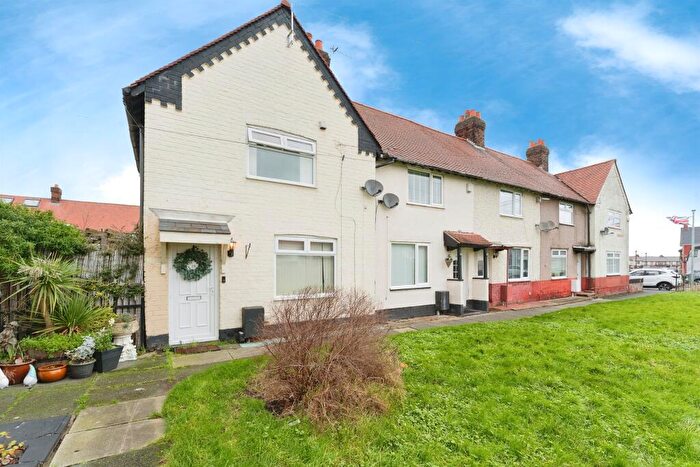
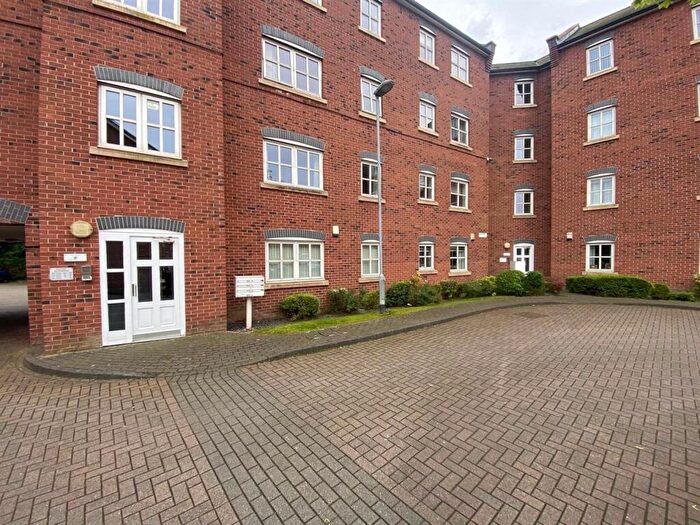
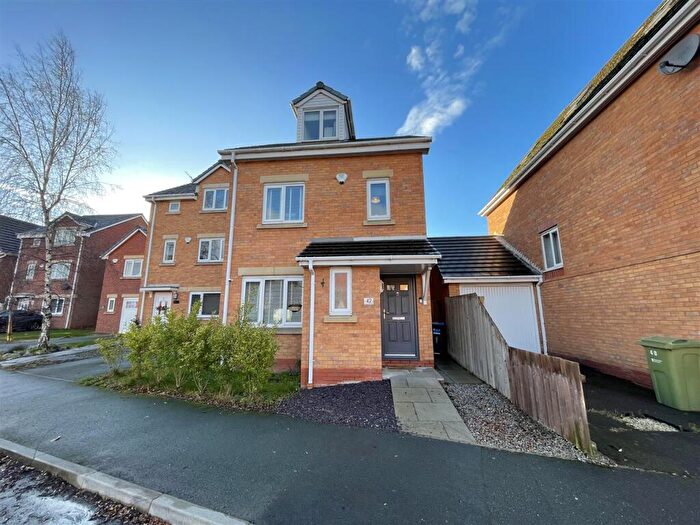
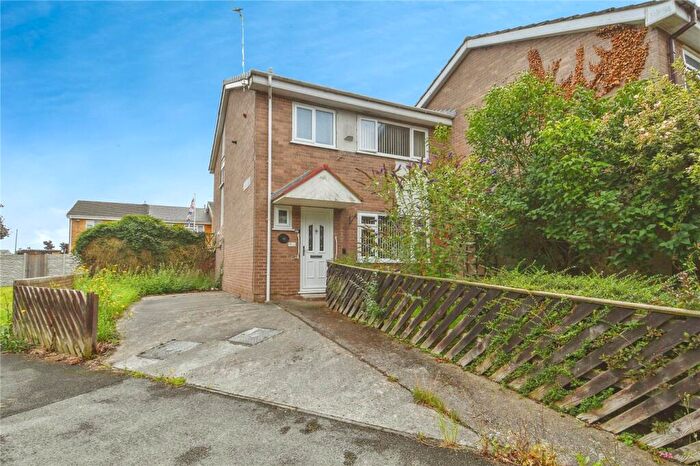
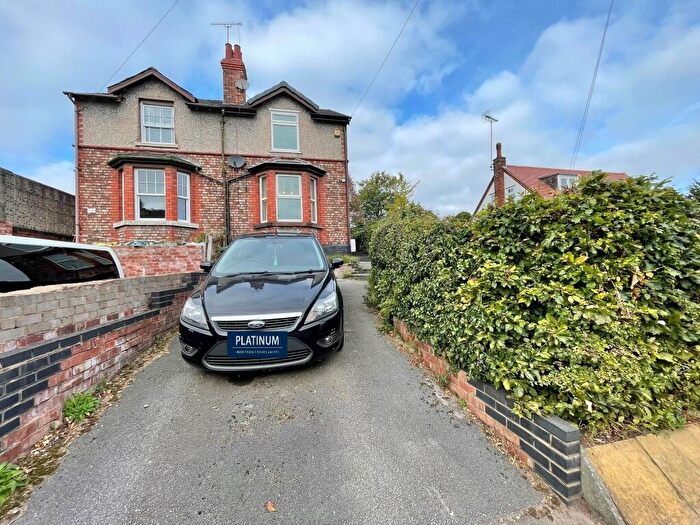
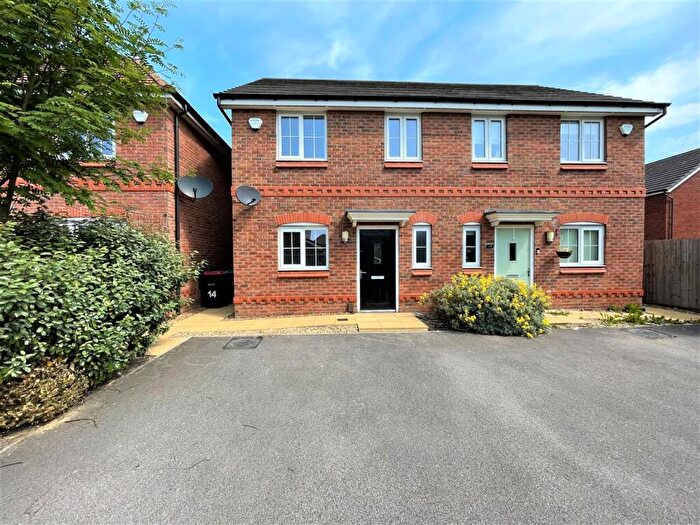
Houses for sale & to rent in Westminster, Ellesmere Port
House Prices in Westminster
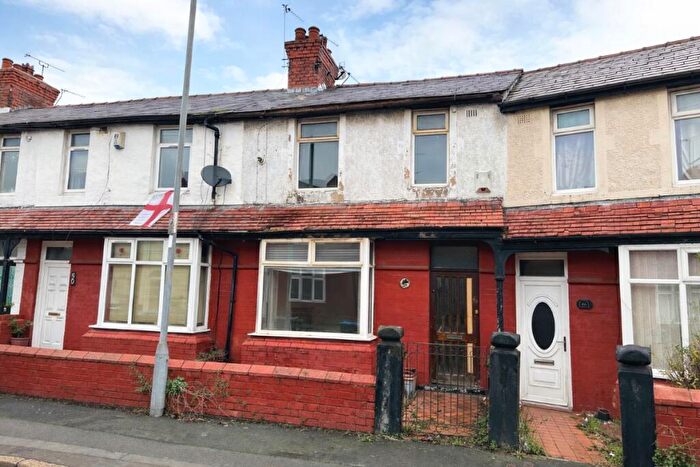
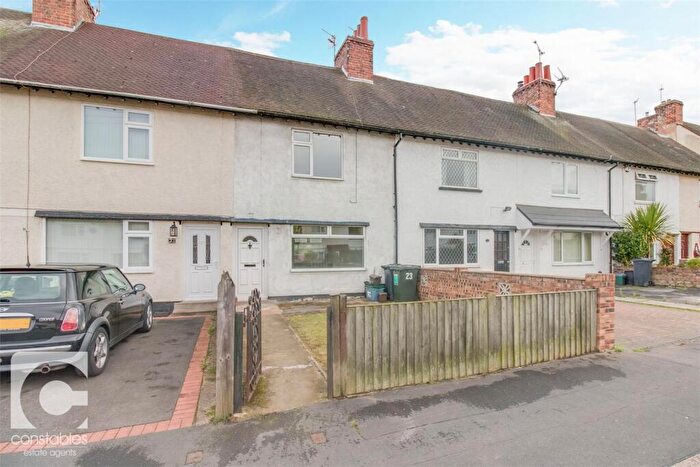
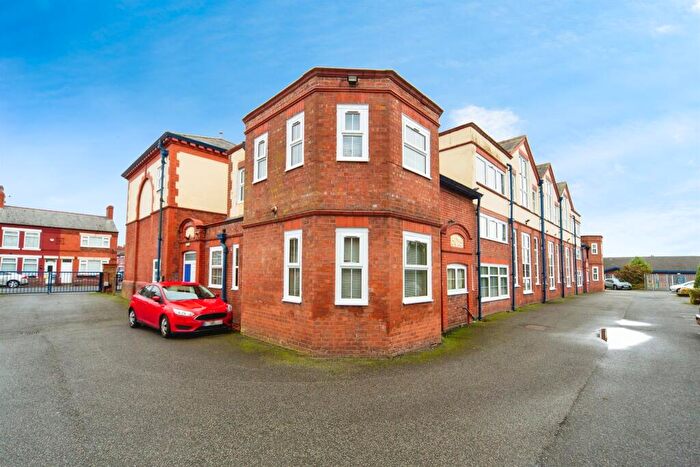
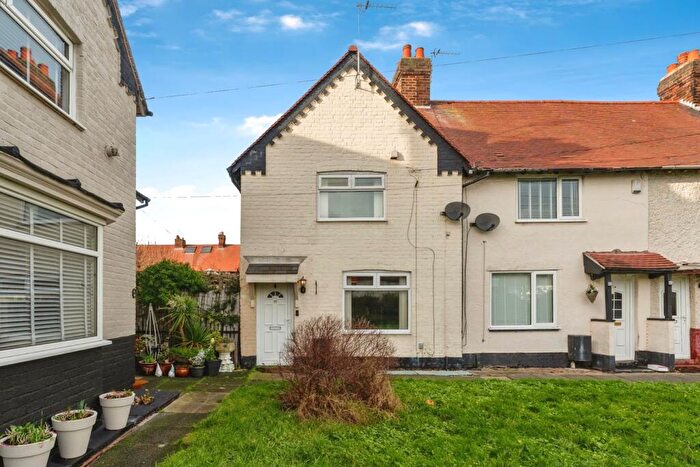
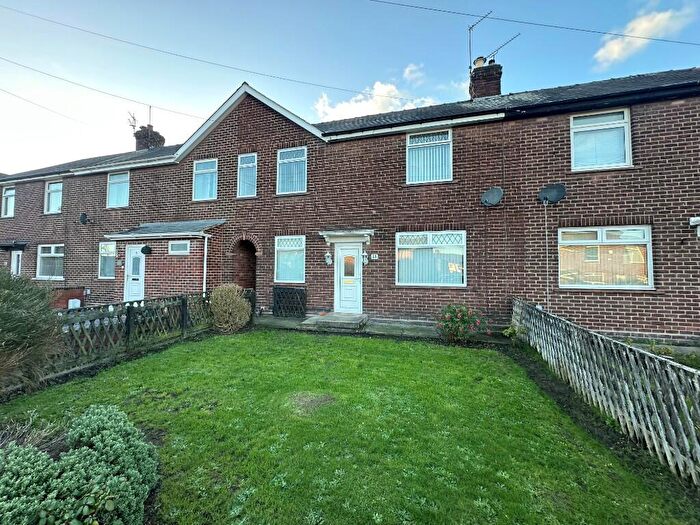
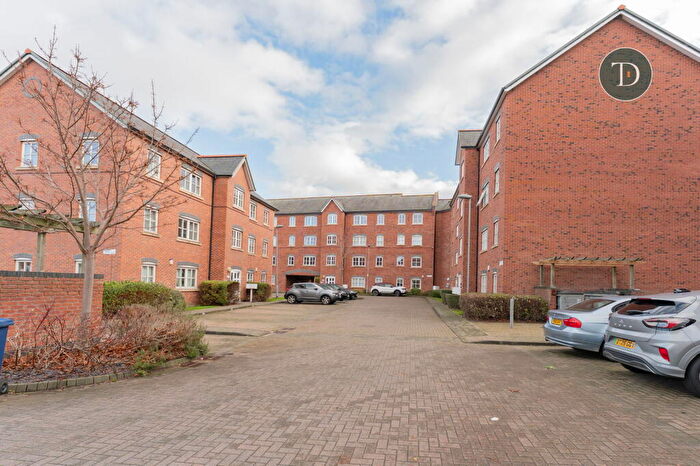
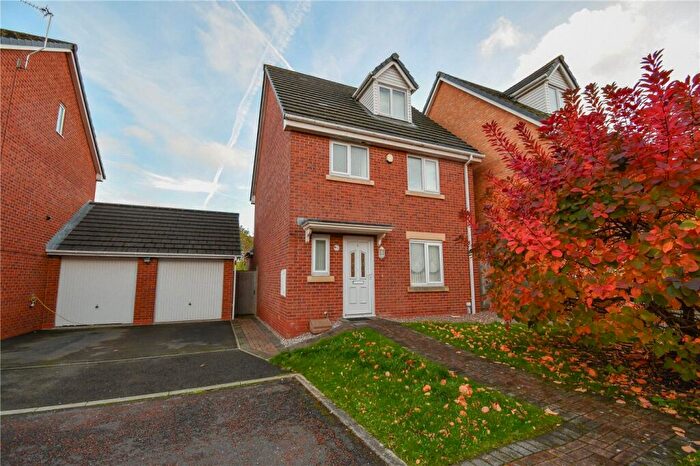
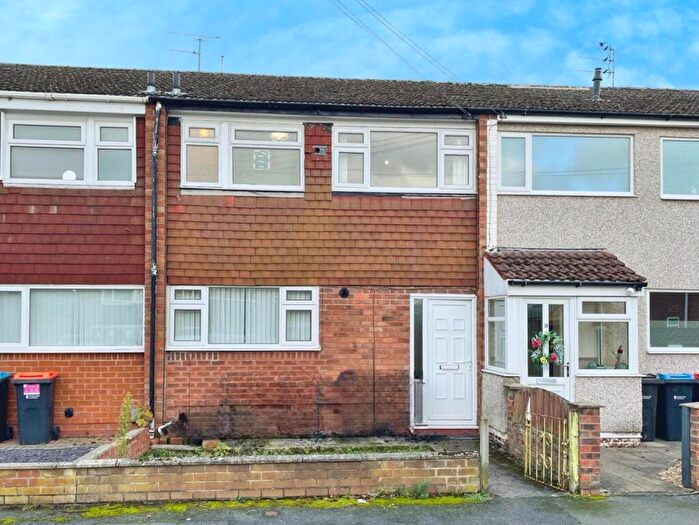
Properties in Westminster have an average house price of £226,420.00 and had 81 Property Transactions within the last 3 years¹.
Westminster is an area in Ellesmere Port, Cheshire with 303 households², where the most expensive property was sold for £359,912.00.
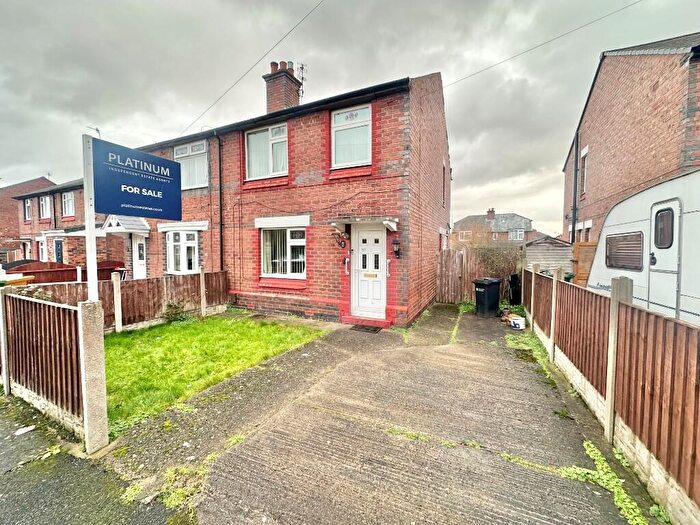
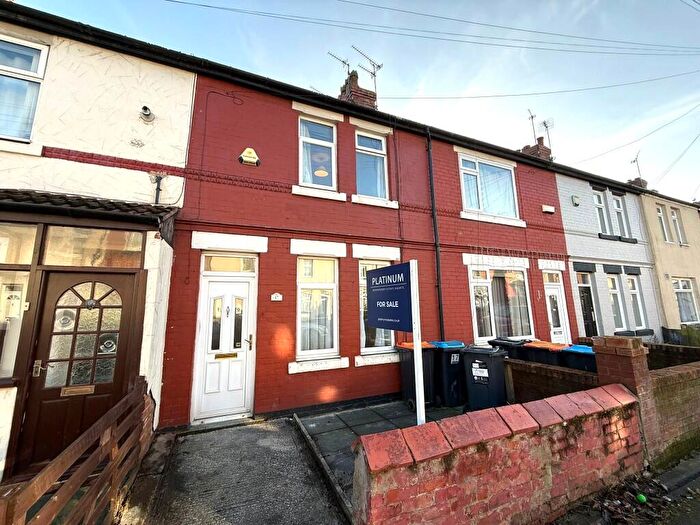
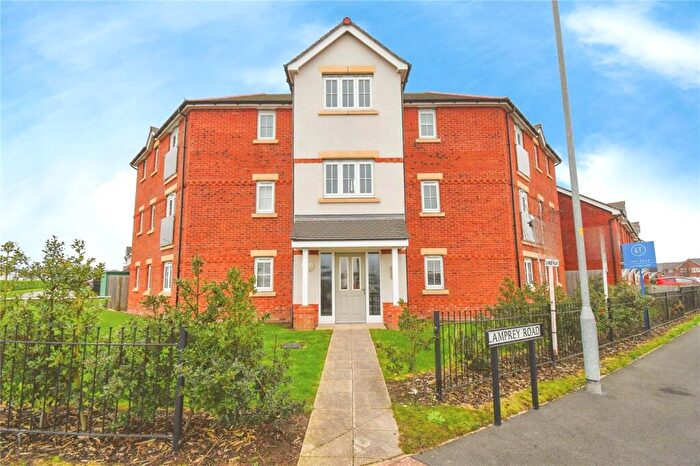
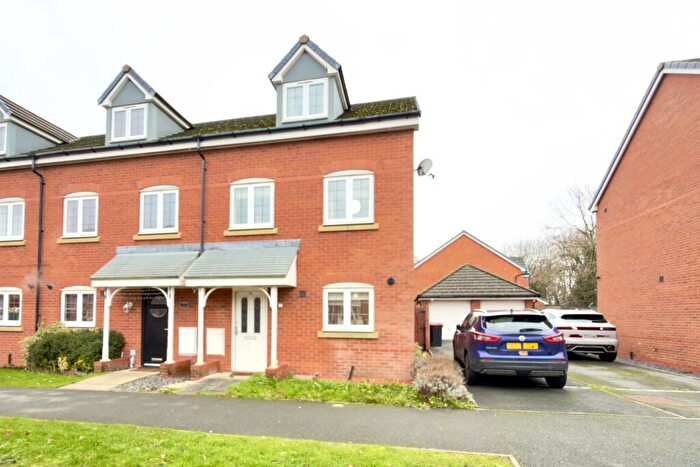
Properties for sale in Westminster
Roads and Postcodes in Westminster
Navigate through our locations to find the location of your next house in Westminster, Ellesmere Port for sale or to rent.
| Streets | Postcodes |
|---|---|
| Abbey Court | CH65 2AE |
| Abbots Mews | CH65 2FB |
| Bateman Close | CH65 3BZ |
| Bitterling Street | CH66 1UL |
| Bluebelle Drive | CH65 3EG CH65 3EQ |
| Bream Lane | CH66 1UF |
| Canal Bridge Enterprise Centre | CH65 4EH |
| Cedab Road | CH65 4FE |
| Cook Street | CH65 4AU |
| Crescent Road | CH65 4EA |
| Cuddington Grove | CH65 3DT |
| Dock Street | CH65 4DH |
| Dock View Road | CH65 1AU |
| Don Walk | CH65 3DH |
| Elm Street | CH65 2AU |
| Europa Way | CH65 4BY CH65 4FG |
| Firenza Avenue | CH65 3AQ |
| Frosts Mews | CH65 2HX |
| Gibson Court | CH65 3DZ |
| Grayling Avenue | CH66 1UD |
| Griffin Drive | CH65 3EU |
| Grosvenor Mews | CH65 2EL |
| High Pond Lane | CH66 1UN |
| Horace Black Gardens | CH65 2DN |
| Ilkeston Way | CH65 3EF |
| Imperial Mews | CH65 2HY |
| Inward Way | CH65 3EN CH65 3EY |
| Jacks Wood Avenue | CH65 3AA |
| Kingfisher Street | CH65 3DG |
| Lamprey Road | CH66 1UB |
| Longbank Court | CH66 1UE |
| Low Pike Lane | CH66 1UG |
| Lower Mersey Street | CH65 2AL |
| Maryville Close | CH65 2HN |
| Meadow Lane | CH65 4EX |
| Meadow Lane Industrial Park | CH65 4TY |
| Merlin Place | CH65 3DS |
| Merseyton Road | CH65 2JE CH65 3AD CH65 2JF |
| Monks Grove | CH65 2FD |
| Myrtle Street | CH65 2AX |
| New Grosvenor Road | CH65 2HB |
| North Road | CH65 1AY |
| Oak Street | CH65 2AS |
| Pondside Drive | CH66 1UH |
| Poole Hall Business Park | CH66 1UA |
| Redhills Mews | CH65 2HZ |
| Rockling Street | CH66 1UJ |
| Rossbank Road | CH65 3AN |
| Rossmore Road East | CH65 3AL CH65 3BR CH65 3DD CH65 3EW |
| Rother Drive | CH65 3DP |
| Searside Close | CH66 1UP |
| Serenity Avenue | CH65 3ER |
| Shephard Close | CH65 4BG CH65 4BJ |
| South Pier Road | CH65 4FW |
| Standingwood Road | CH65 3DF |
| Station Road | CH65 4AX CH65 4BN CH65 4BX CH65 4FT |
| Venables Way | CH65 3DE |
| Viva Way | CH65 3BF |
| Westminster Road | CH65 2JG |
| Whitby Road | CH65 4AR |
| Wilkinson Street Mews | CH65 2BA |
| Wilkinson Street North | CH65 2BW |
| Wyvern Road | CH65 3EX |
| CH65 2BZ CH65 2DA CH65 2DB CH65 2HQ CH66 1UQ |
Transport near Westminster
-
Ellesmere Port Station
-
Overpool Station
-
Little Sutton Station
-
Capenhurst Station
-
Stanlow and Thornton Station
- FAQ
- Price Paid By Year
- Property Type Price
Frequently asked questions about Westminster
What is the average price for a property for sale in Westminster?
The average price for a property for sale in Westminster is £226,420. This amount is 9% higher than the average price in Ellesmere Port. There are 705 property listings for sale in Westminster.
What streets have the most expensive properties for sale in Westminster?
The streets with the most expensive properties for sale in Westminster are Firenza Avenue at an average of £274,485, Grayling Avenue at an average of £273,571 and Rockling Street at an average of £242,500.
What streets have the most affordable properties for sale in Westminster?
The streets with the most affordable properties for sale in Westminster are Lower Mersey Street at an average of £117,500, Lamprey Road at an average of £166,915 and Longbank Court at an average of £181,500.
Which train stations are available in or near Westminster?
Some of the train stations available in or near Westminster are Ellesmere Port, Overpool and Little Sutton.
Property Price Paid in Westminster by Year
The average sold property price by year was:
| Year | Average Sold Price | Price Change |
Sold Properties
|
|---|---|---|---|
| 2025 | £213,409 | -9% |
24 Properties |
| 2024 | £233,677 | 1% |
25 Properties |
| 2023 | £230,507 | 26% |
32 Properties |
| 2022 | £171,559 | -6% |
27 Properties |
| 2021 | £181,363 | 1% |
26 Properties |
| 2020 | £179,450 | 5% |
63 Properties |
| 2019 | £170,287 | 2% |
106 Properties |
| 2018 | £167,610 | 40% |
91 Properties |
| 2017 | £100,000 | -28% |
1 Property |
| 2016 | £127,500 | 11% |
2 Properties |
| 2015 | £113,928 | -11% |
14 Properties |
| 2014 | £126,500 | -19% |
2 Properties |
| 2008 | £150,000 | 63% |
1 Property |
| 2003 | £55,000 | -231% |
1 Property |
| 2000 | £181,995 | - |
1 Property |
Property Price per Property Type in Westminster
Here you can find historic sold price data in order to help with your property search.
The average Property Paid Price for specific property types in the last three years are:
| Property Type | Average Sold Price | Sold Properties |
|---|---|---|
| Semi Detached House | £213,478.00 | 13 Semi Detached Houses |
| Detached House | £272,781.00 | 33 Detached Houses |
| Terraced House | £204,523.00 | 28 Terraced Houses |
| Flat | £119,482.00 | 7 Flats |

