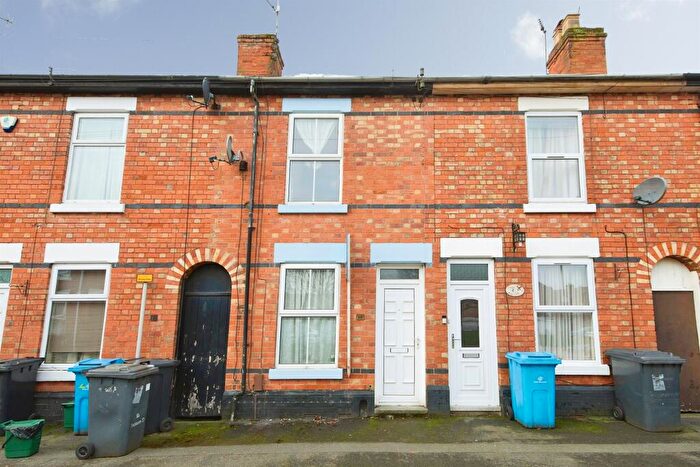
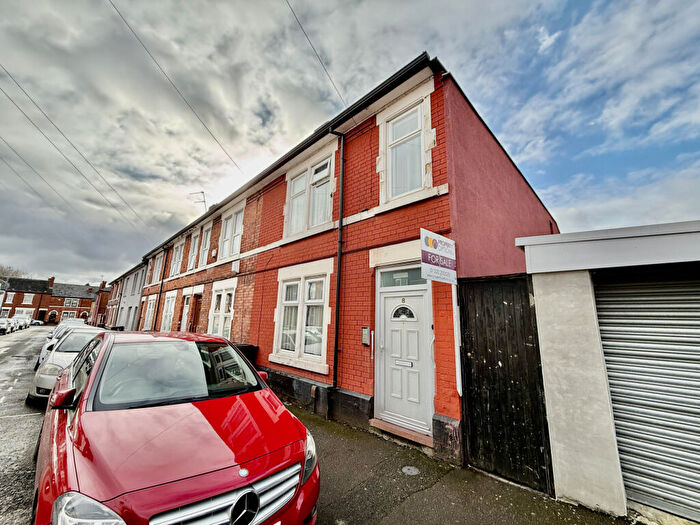
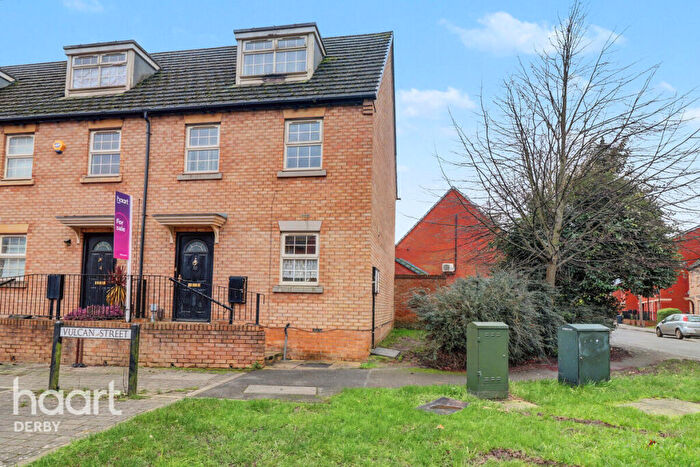
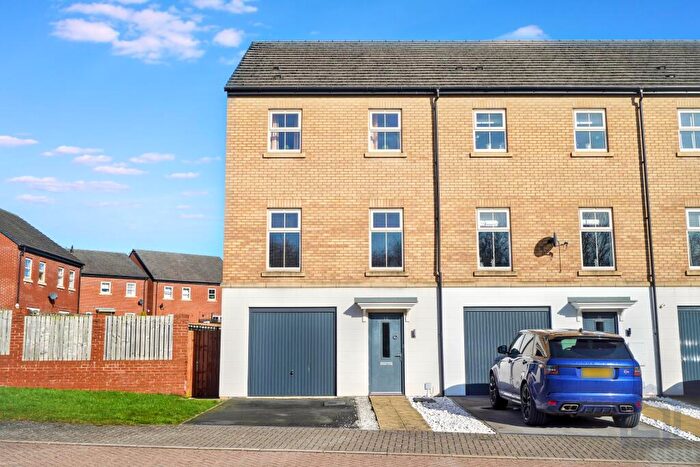
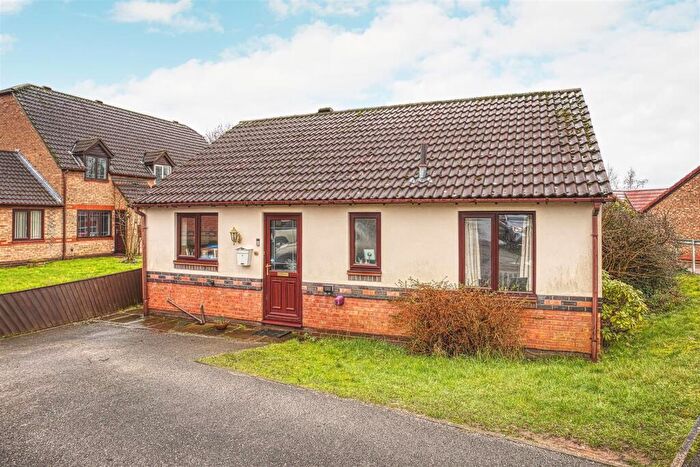
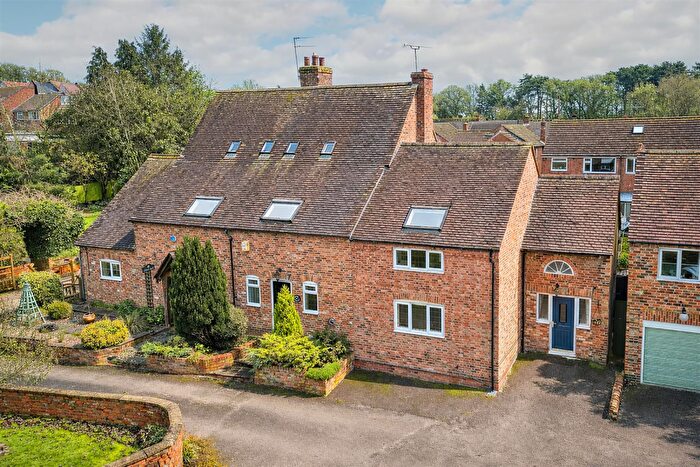
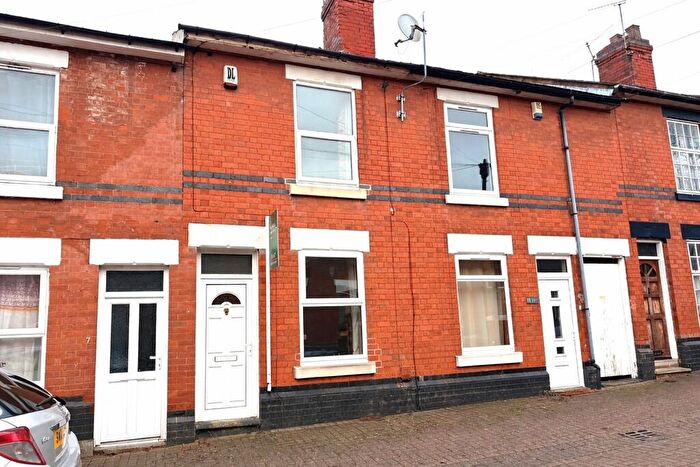
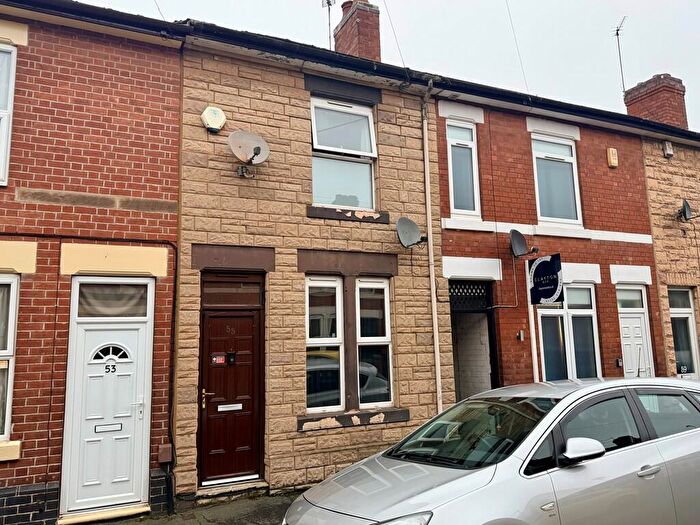
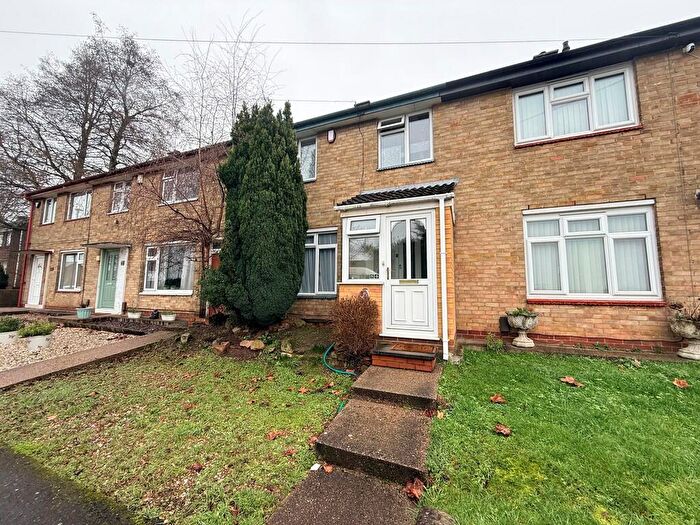
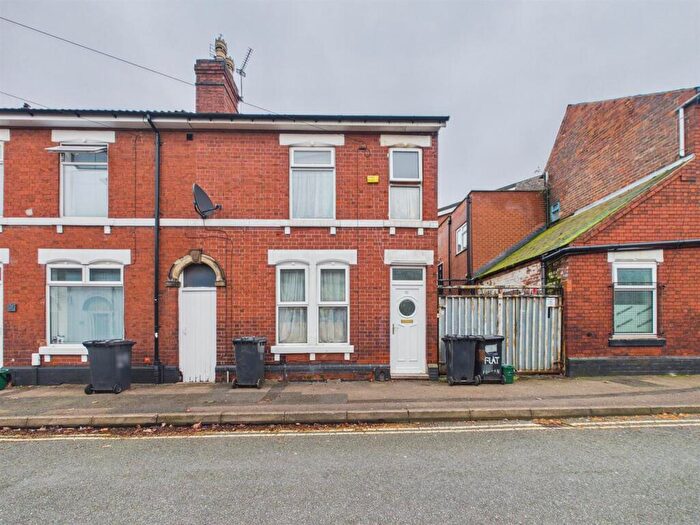
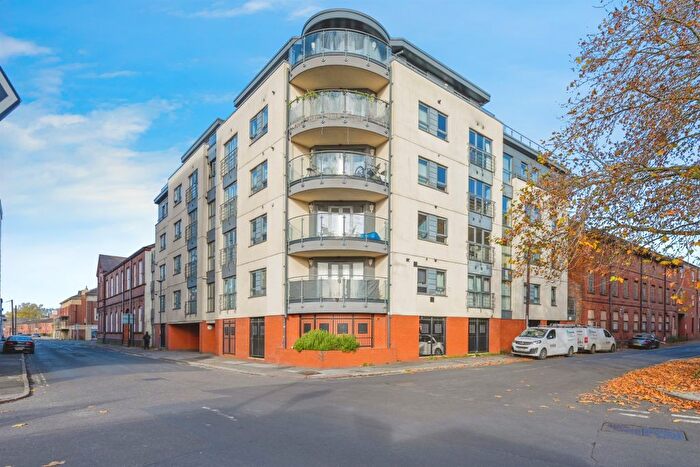
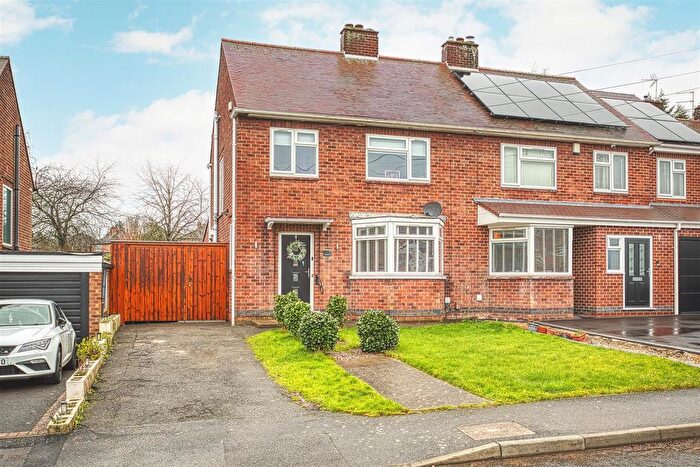
Houses for sale & to rent in Derby, City of Derby
House Prices in Derby
Properties in Derby have an average house price of £219,169.00 and had 8,577 Property Transactions within the last 3 years.¹
Derby is an area in City of Derby with 98,730 households², where the most expensive property was sold for £1,888,027.00.
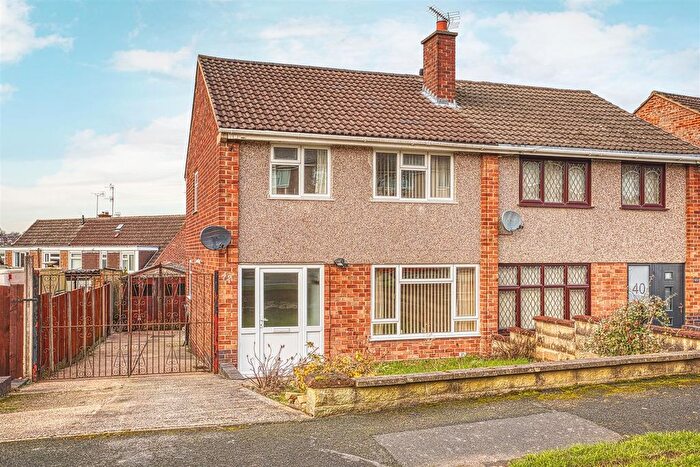
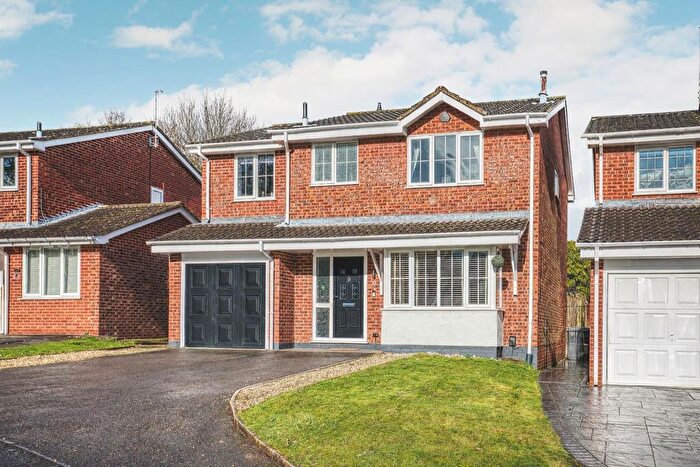
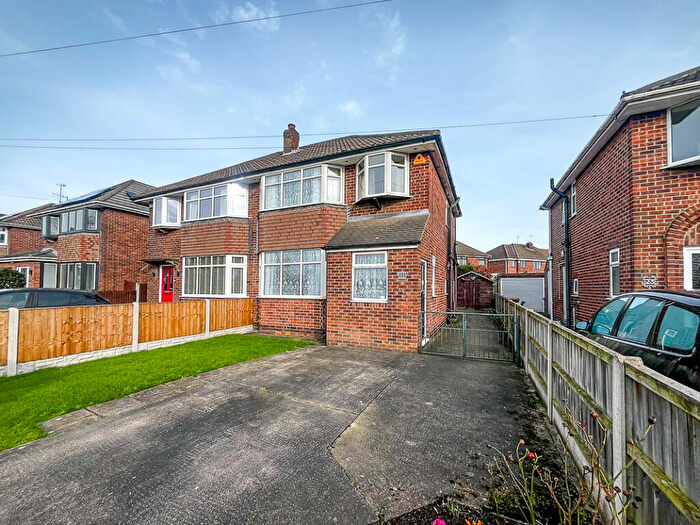
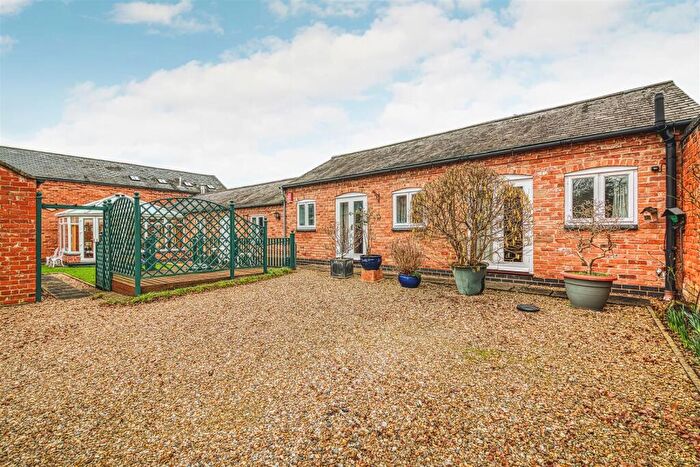
Properties for sale in Derby
Neighbourhoods in Derby
Navigate through our locations to find the location of your next house in Derby, City of Derby for sale or to rent.
Transport in Derby
Please see below transportation links in this area:
- FAQ
- Price Paid By Year
- Property Type Price
Frequently asked questions about Derby
What is the average price for a property for sale in Derby?
The average price for a property for sale in Derby is £219,169. There are more than 10,000 property listings for sale in Derby.
What locations have the most expensive properties for sale in Derby?
The locations with the most expensive properties for sale in Derby are Allestree at an average of £329,536, Littleover at an average of £313,566 and Willington and Findern at an average of £283,609.
What locations have the most affordable properties for sale in Derby?
The locations with the most affordable properties for sale in Derby are Normanton at an average of £149,763, Arboretum at an average of £155,219 and Sinfin at an average of £164,526.
Which train stations are available in or near Derby?
Some of the train stations available in or near Derby are Derby, Peartree and Spondon.
Property Price Paid in Derby by Year
The average sold property price by year was:
| Year | Average Sold Price | Price Change |
Sold Properties
|
|---|---|---|---|
| 2025 | £227,421 | 3% |
2,537 Properties |
| 2024 | £219,815 | 4% |
3,111 Properties |
| 2023 | £211,334 | -4% |
2,929 Properties |
| 2022 | £219,363 | 8% |
3,537 Properties |
| 2021 | £200,904 | 6% |
4,373 Properties |
| 2020 | £189,803 | 4% |
3,169 Properties |
| 2019 | £181,333 | 4% |
3,700 Properties |
| 2018 | £174,838 | 4% |
3,931 Properties |
| 2017 | £168,315 | 4% |
3,884 Properties |
| 2016 | £161,441 | 4% |
3,810 Properties |
| 2015 | £155,666 | 4% |
3,805 Properties |
| 2014 | £149,705 | 2% |
3,959 Properties |
| 2013 | £146,394 | 3% |
3,222 Properties |
| 2012 | £141,526 | 4% |
2,708 Properties |
| 2011 | £136,297 | -4% |
2,915 Properties |
| 2010 | £141,493 | 1% |
2,839 Properties |
| 2009 | £139,581 | -2% |
2,680 Properties |
| 2008 | £142,810 | -5% |
2,985 Properties |
| 2007 | £150,429 | 3% |
5,405 Properties |
| 2006 | £146,034 | 6% |
5,605 Properties |
| 2005 | £136,977 | 6% |
4,592 Properties |
| 2004 | £128,919 | 19% |
5,133 Properties |
| 2003 | £104,701 | 20% |
5,346 Properties |
| 2002 | £83,558 | 16% |
5,922 Properties |
| 2001 | £70,028 | 12% |
5,497 Properties |
| 2000 | £61,319 | 8% |
4,787 Properties |
| 1999 | £56,264 | 7% |
4,847 Properties |
| 1998 | £52,443 | 6% |
4,369 Properties |
| 1997 | £49,284 | 3% |
4,369 Properties |
| 1996 | £47,802 | 2% |
3,859 Properties |
| 1995 | £46,877 | - |
3,366 Properties |
Property Price per Property Type in Derby
Here you can find historic sold price data in order to help with your property search.
The average Property Paid Price for specific property types in the last three years are:
| Property Type | Average Sold Price | Sold Properties |
|---|---|---|
| Semi Detached House | £211,264.00 | 3,380 Semi Detached Houses |
| Terraced House | £163,152.00 | 2,534 Terraced Houses |
| Detached House | £332,256.00 | 2,070 Detached Houses |
| Flat | £108,844.00 | 593 Flats |

