
Houses for sale & to rent in City of Derby, England
House Prices in City of Derby
Properties in City of Derby have
an average house price of
£220k
and had 9,254 Property Transactions
within the last 3 years.¹
City of Derby is a location in
England with
98,730 households², where the most expensive property was sold for £2.29M.
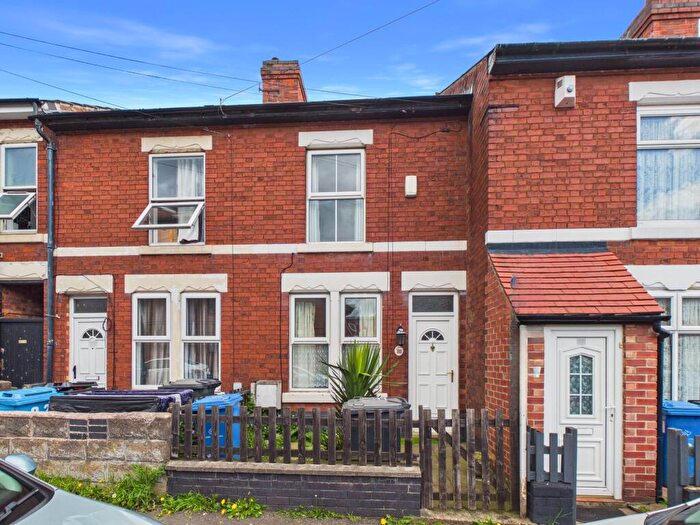
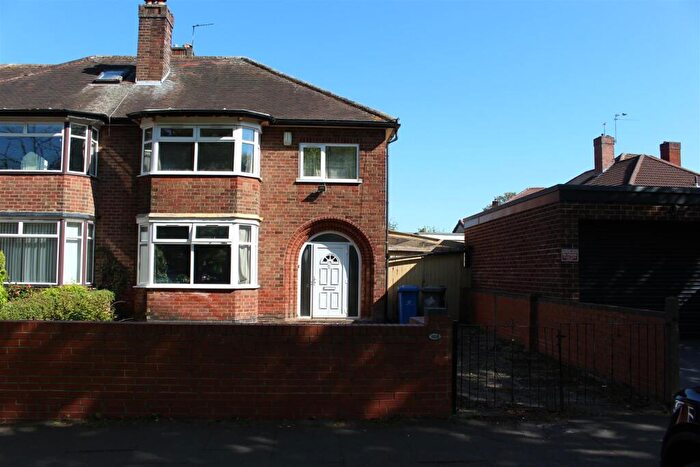
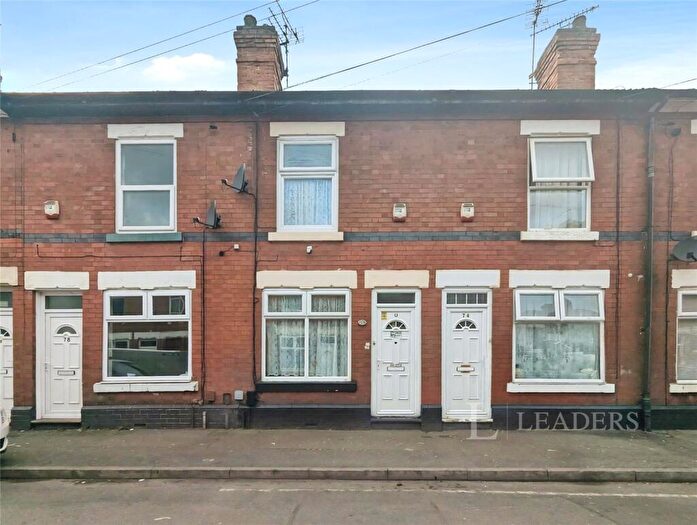
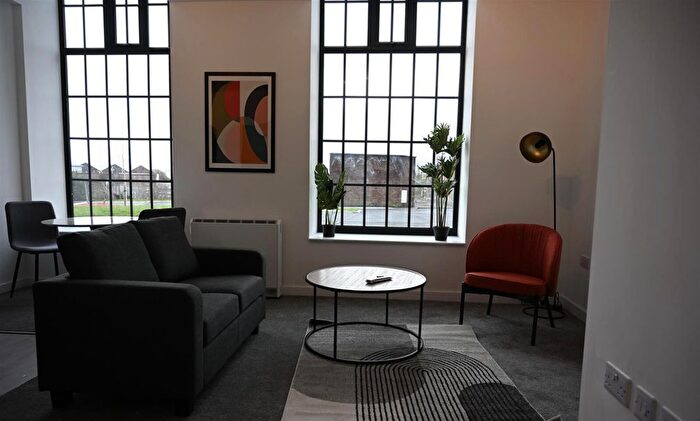
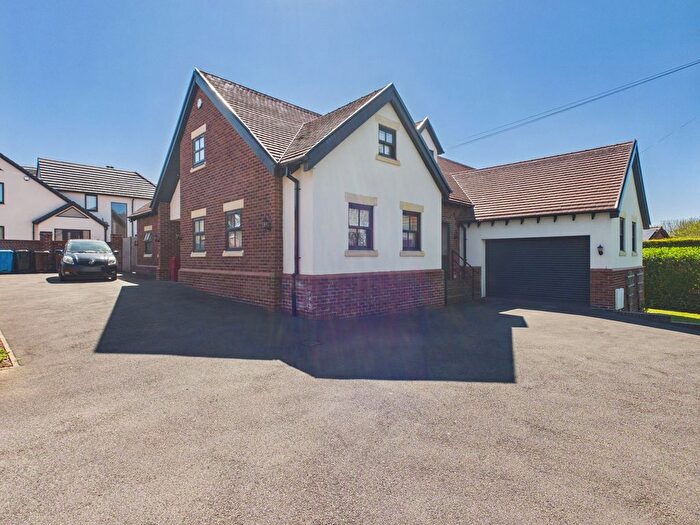
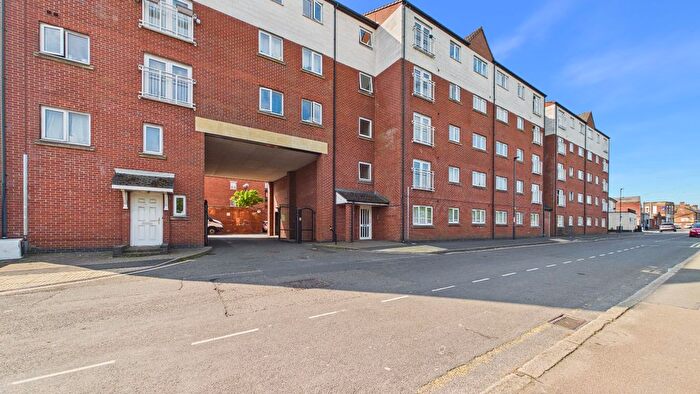
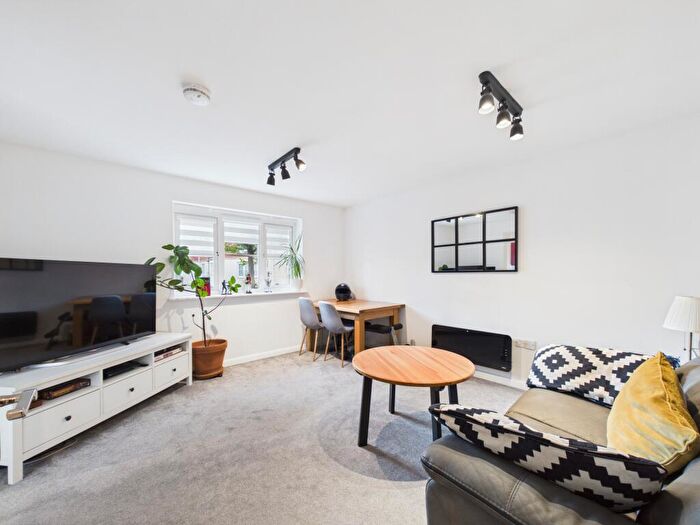
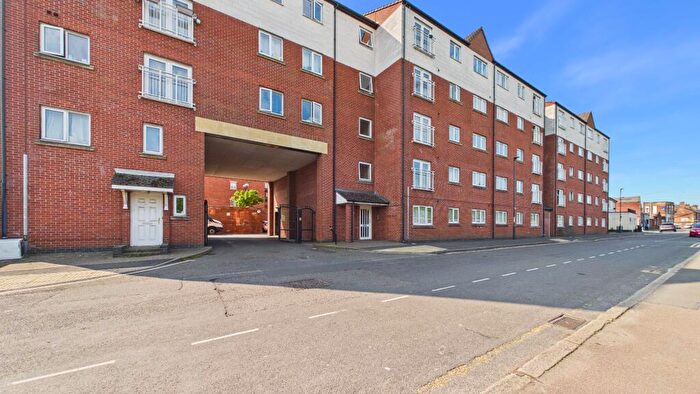
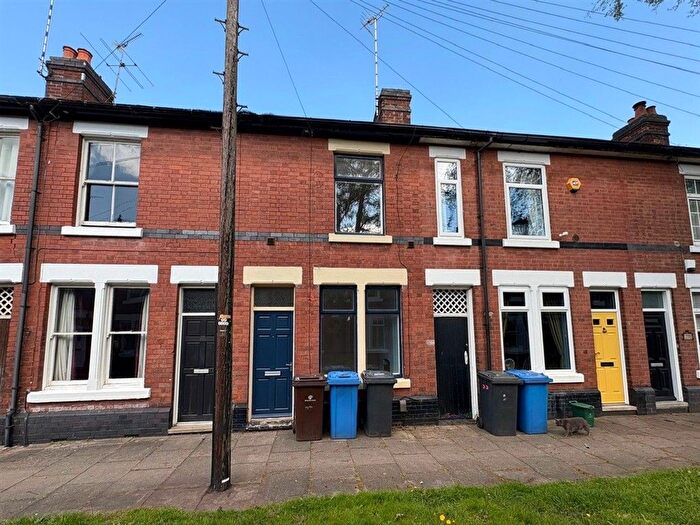
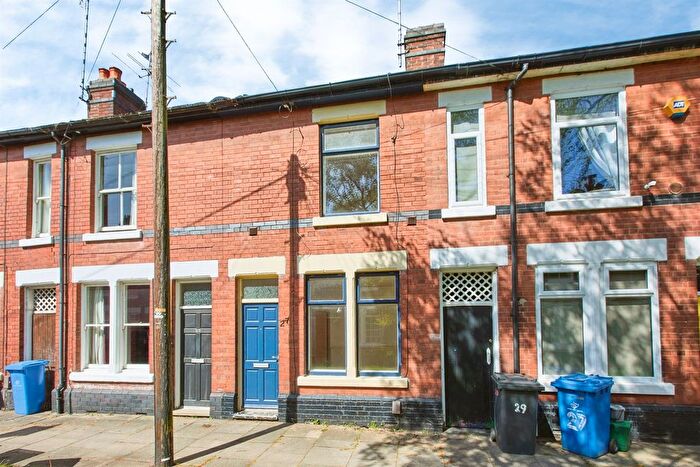
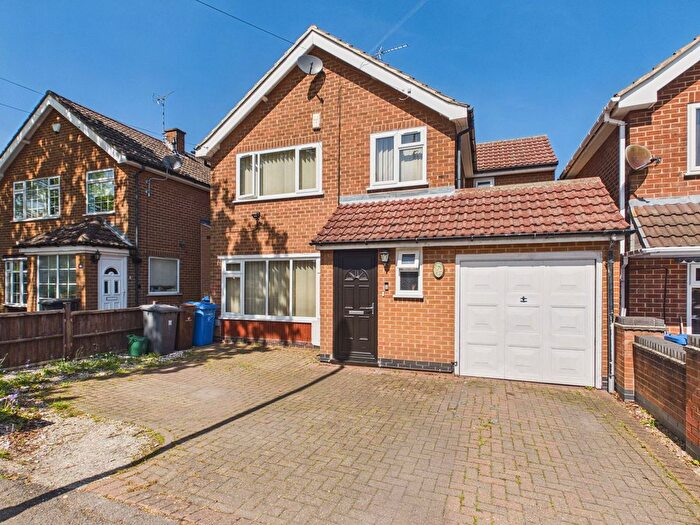
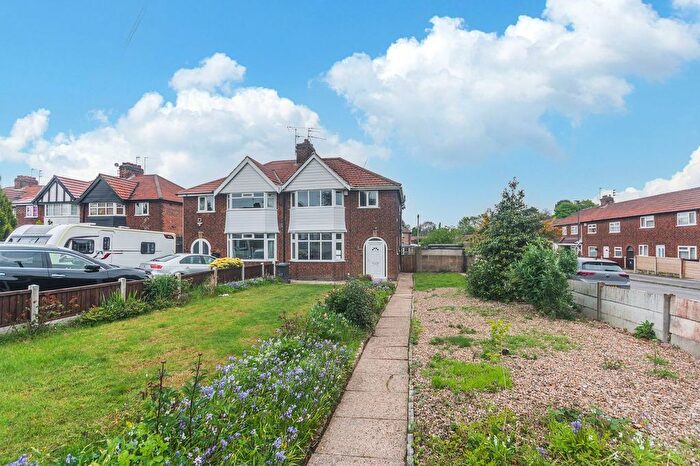
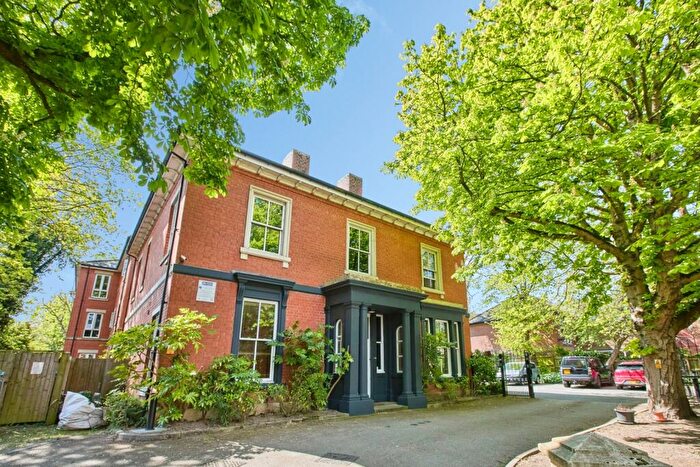
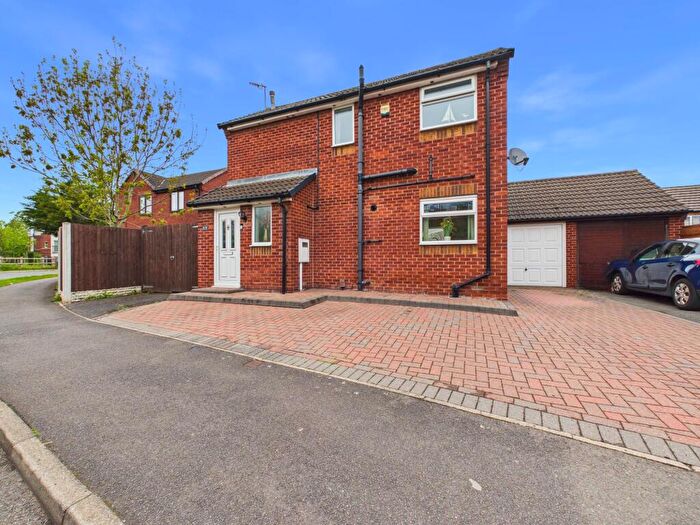
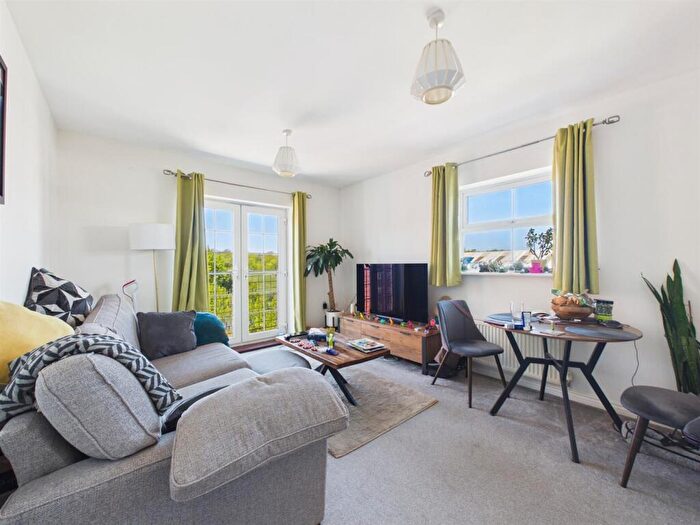
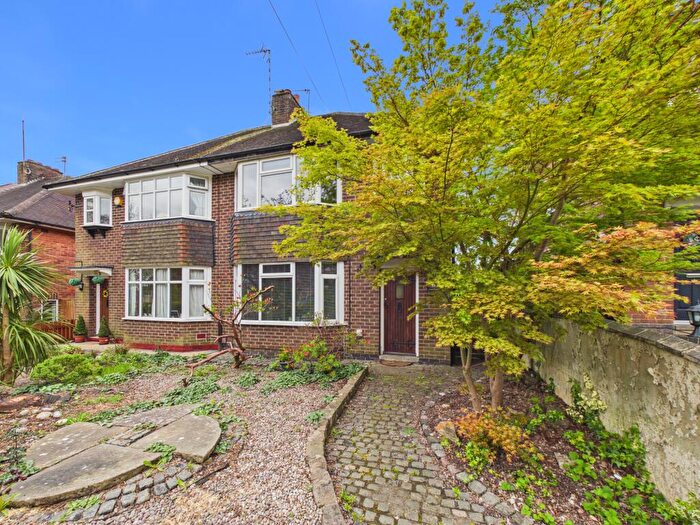
Properties for sale in City of Derby
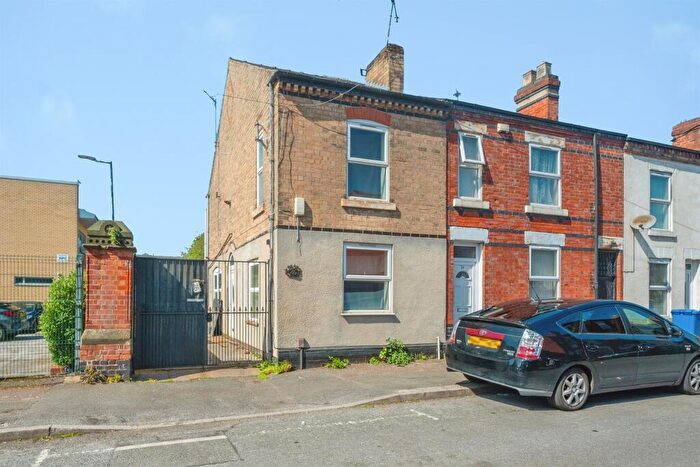
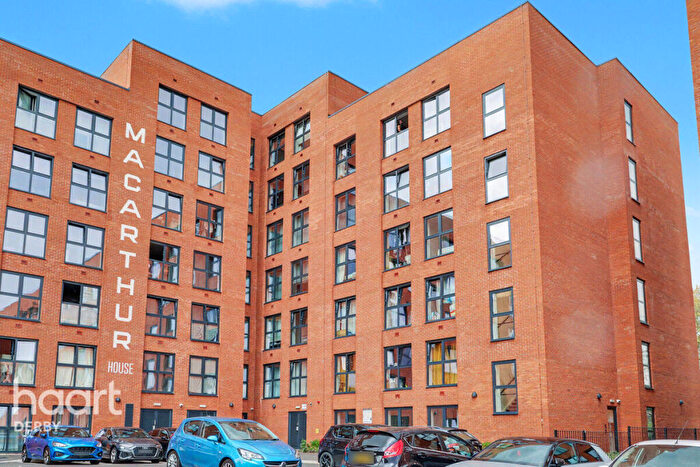
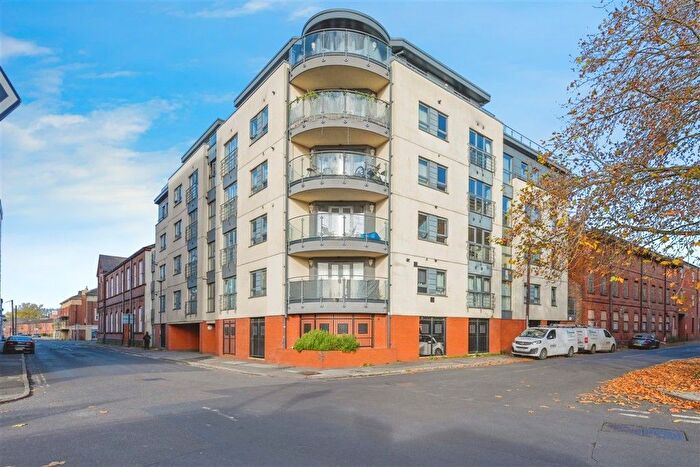
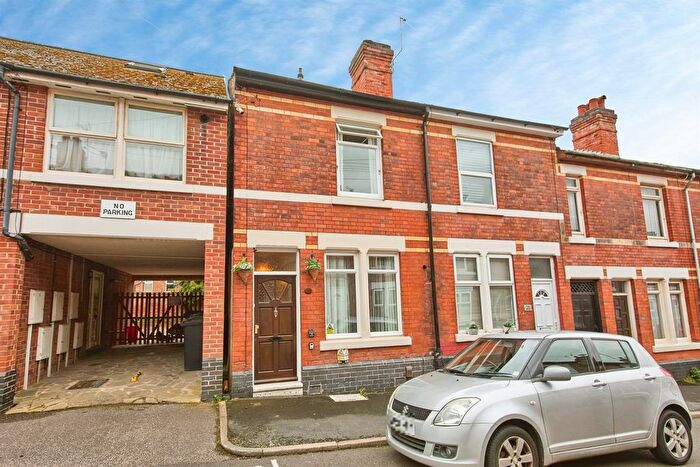
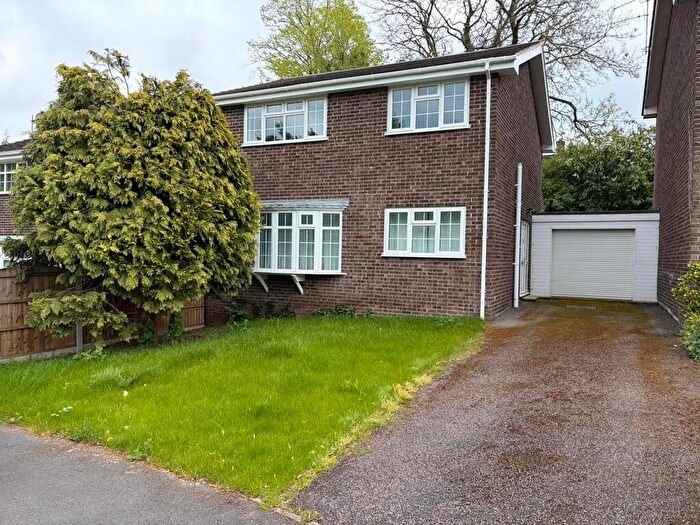
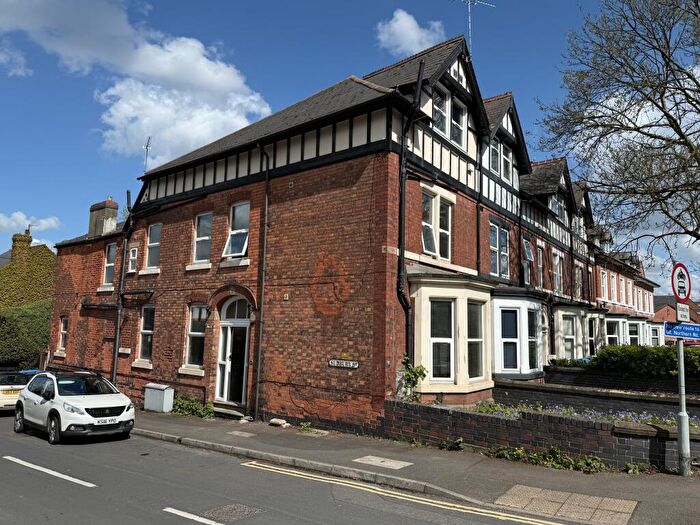
![]()
If you are looking to sell your house, let it out, or receive a property valuation, an expert can help you.
Click the button below to get started.


Towns in City of Derby
Navigate through our locations to find the location of your next house in City of Derby, England for sale or to rent.
Transport in City of Derby
Please see below transportation links in this area:

- FAQ
- Price Paid By Year
- Property Type Price
Frequently asked questions about City of Derby
What is the average price for a property for sale in City of Derby?
The average price for a property for sale in City of Derby is £220,093. This amount is 39% lower than the average price in England. There are more than 10,000 property listings for sale in City of Derby.
Which train stations are available in or near City of Derby?
Some of the train stations available in or near City of Derby are Derby, Peartree and Spondon.
Property Price Paid in City of Derby by Year
The average sold property price by year was:
| Year | Average Sold Price | Price Change |
Sold Properties
|
|---|---|---|---|
| 2026 | £219,316 | -4% |
229 Properties |
| 2025 | £229,180 | 4% |
2,980 Properties |
| 2024 | £219,738 | 4% |
3,115 Properties |
| 2023 | £211,290 | -4% |
2,930 Properties |
| 2022 | £219,363 | 8% |
3,537 Properties |
| 2021 | £200,944 | 5% |
4,374 Properties |
| 2020 | £189,905 | 5% |
3,171 Properties |
| 2019 | £181,333 | 4% |
3,700 Properties |
| 2018 | £174,838 | 4% |
3,931 Properties |
| 2017 | £168,315 | 4% |
3,884 Properties |
| 2016 | £161,422 | 4% |
3,811 Properties |
| 2015 | £155,648 | 4% |
3,806 Properties |
| 2014 | £149,705 | 2% |
3,959 Properties |
| 2013 | £146,394 | 3% |
3,222 Properties |
| 2012 | £141,526 | 4% |
2,708 Properties |
| 2011 | £136,297 | -4% |
2,915 Properties |
| 2010 | £141,493 | 1% |
2,839 Properties |
| 2009 | £139,581 | -2% |
2,680 Properties |
| 2008 | £142,810 | -5% |
2,985 Properties |
| 2007 | £150,429 | 3% |
5,405 Properties |
| 2006 | £146,034 | 6% |
5,605 Properties |
| 2005 | £136,977 | 6% |
4,592 Properties |
| 2004 | £128,919 | 19% |
5,133 Properties |
| 2003 | £104,701 | 20% |
5,346 Properties |
| 2002 | £83,558 | 16% |
5,922 Properties |
| 2001 | £70,028 | 12% |
5,497 Properties |
| 2000 | £61,319 | 8% |
4,787 Properties |
| 1999 | £56,264 | 7% |
4,847 Properties |
| 1998 | £52,443 | 6% |
4,369 Properties |
| 1997 | £49,284 | 3% |
4,369 Properties |
| 1996 | £47,802 | 2% |
3,859 Properties |
| 1995 | £46,877 | - |
3,366 Properties |
Property Price per Property Type in City of Derby
Here you can find historic sold price data in order to help with your property search.
The average Property Paid Price for specific property types in the last three years are:
| Property Type | Average Sold Price | Sold Properties |
|---|---|---|
| Semi Detached House | £211,825.00 | 3,655 Semi Detached Houses |
| Terraced House | £163,255.00 | 2,721 Terraced Houses |
| Detached House | £334,062.00 | 2,243 Detached Houses |
| Flat | £108,672.00 | 635 Flats |