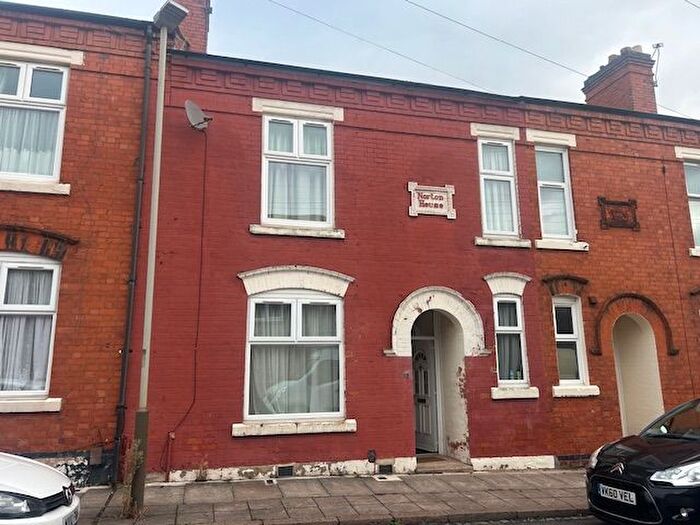
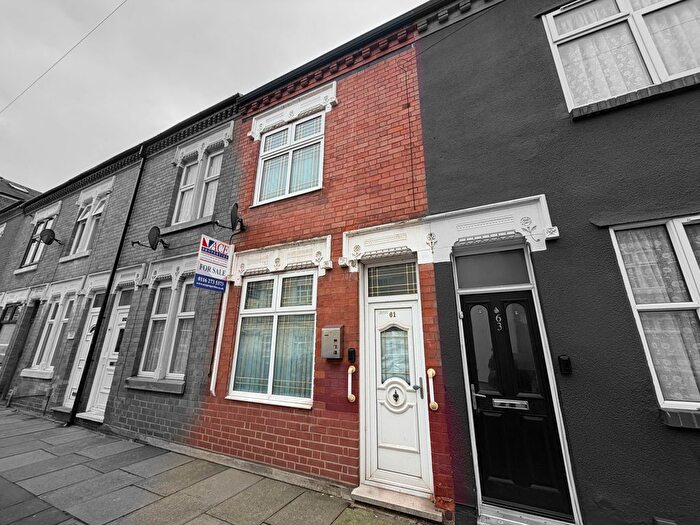
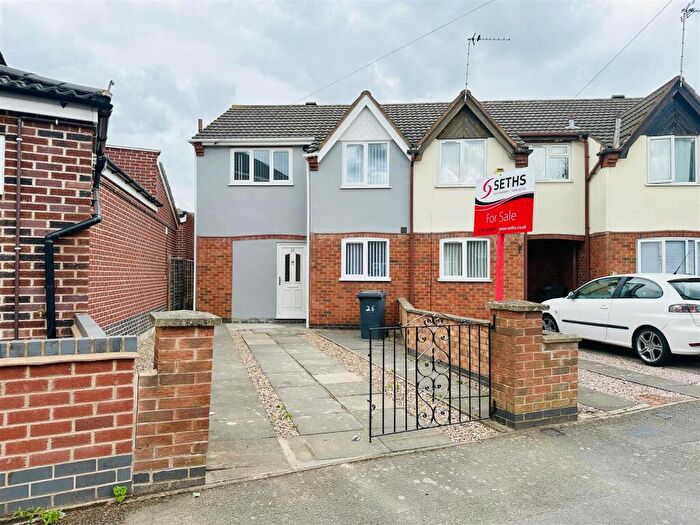
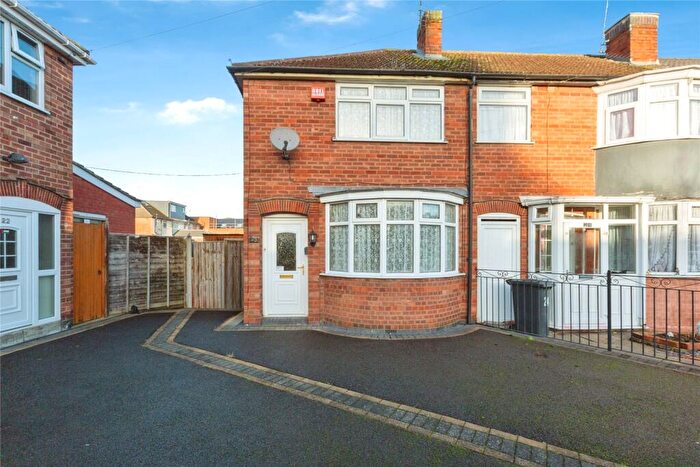
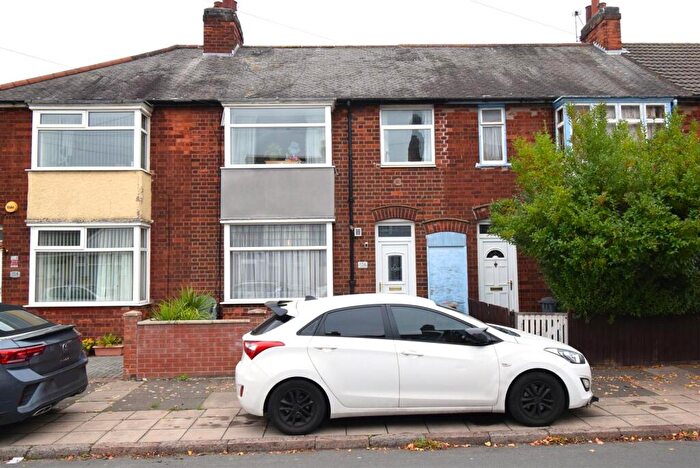
Houses for sale & to rent in Charnwood, Leicester
House Prices in Charnwood
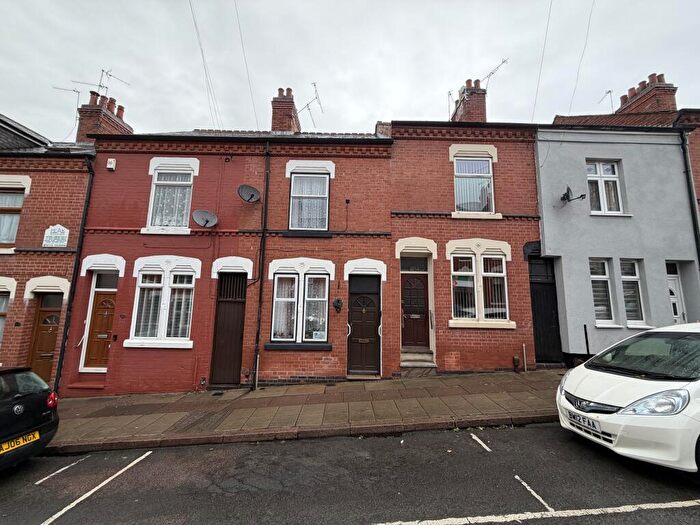
Properties in Charnwood have an average house price of £226,112.00 and had 257 Property Transactions within the last 3 years¹.
Charnwood is an area in Leicester, City of Leicester with 4,259 households², where the most expensive property was sold for £390,000.00.
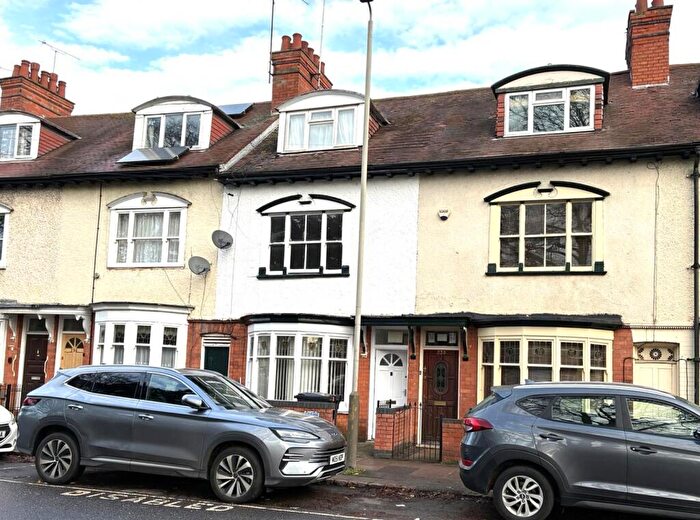
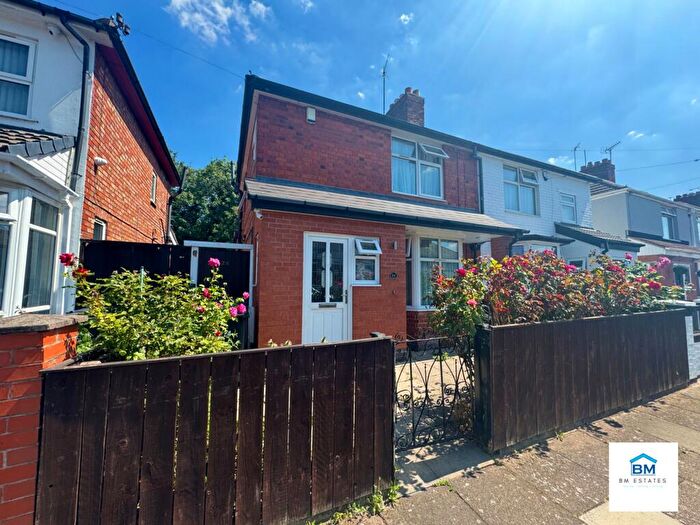
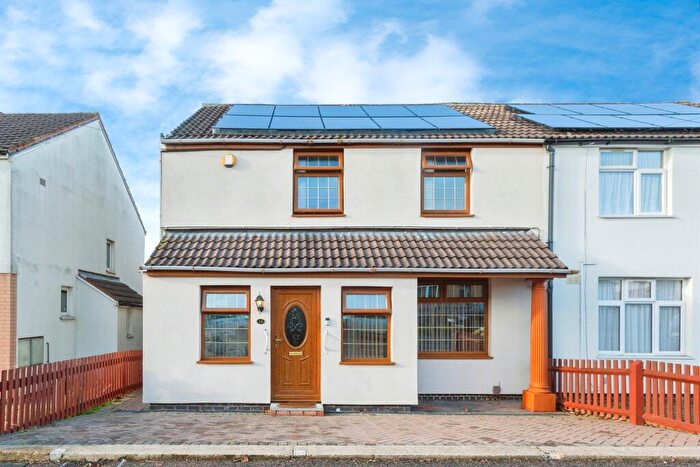
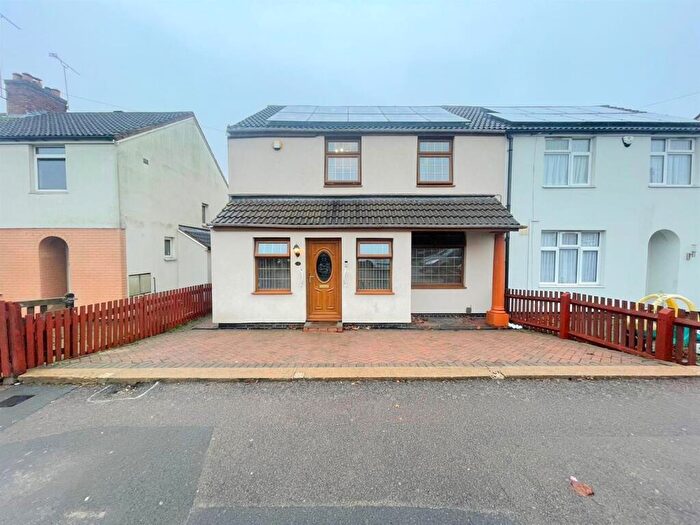
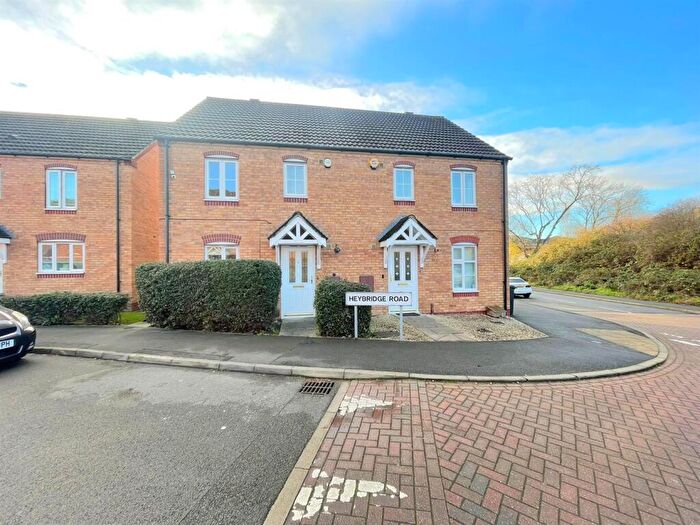
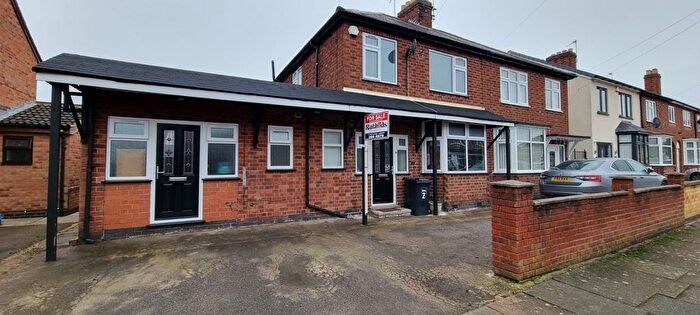
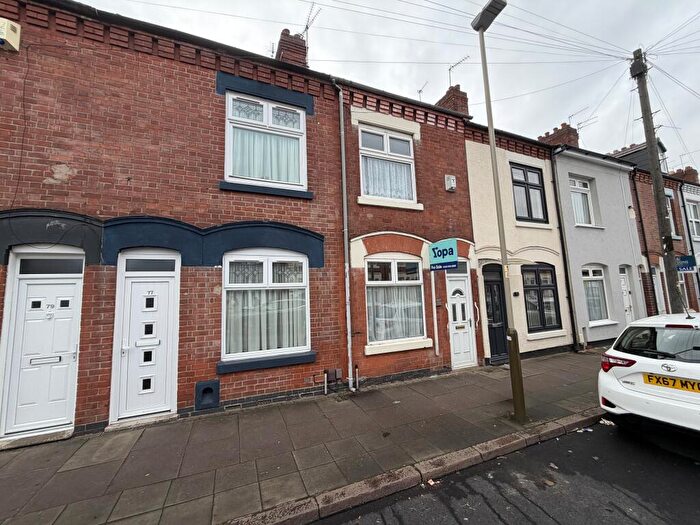
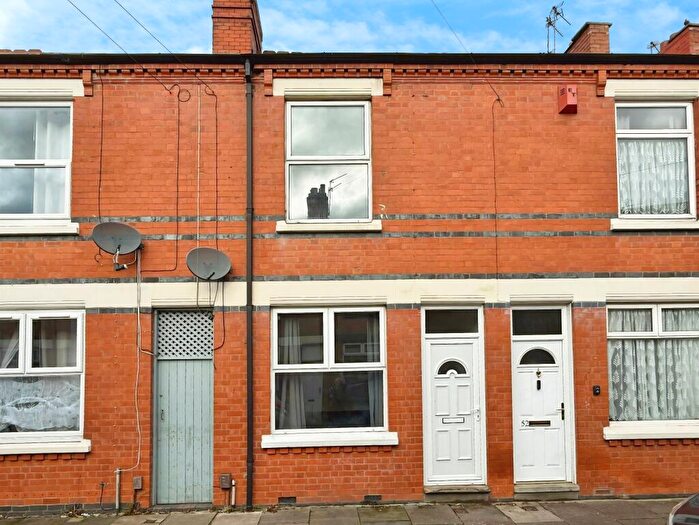
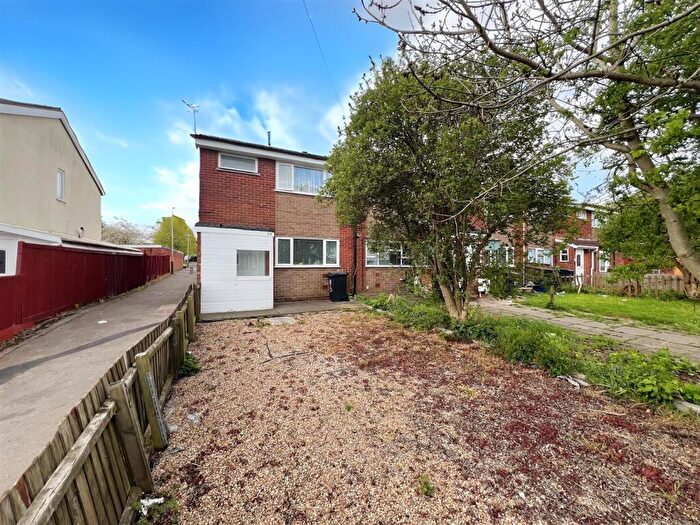
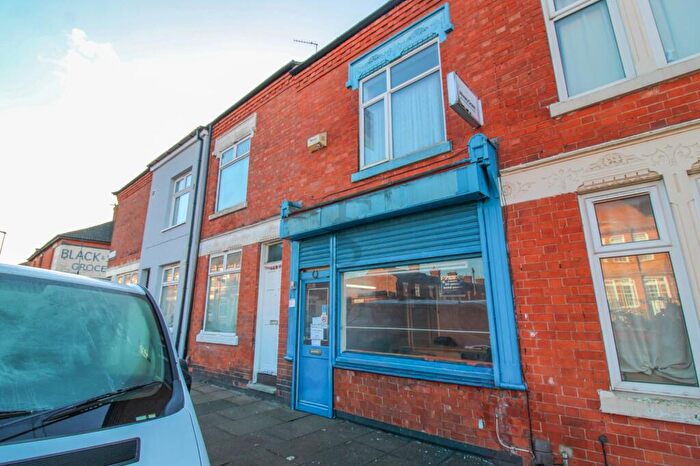
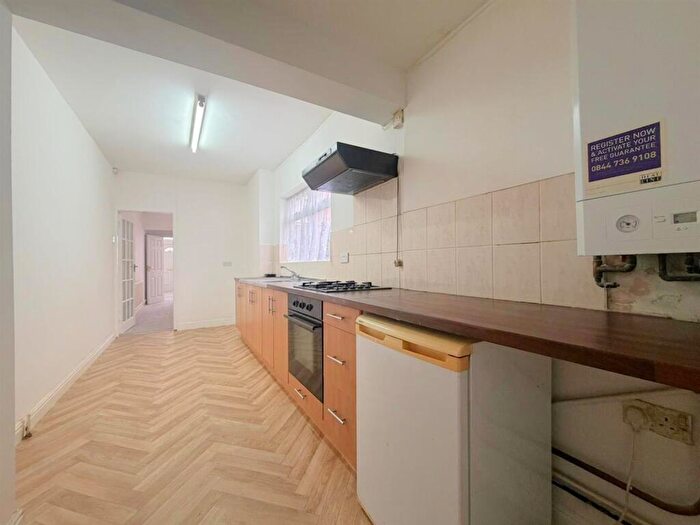
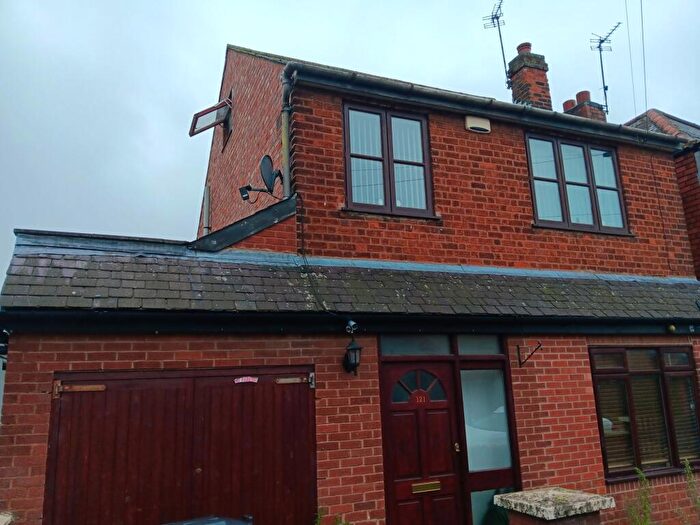
Properties for sale in Charnwood
Roads and Postcodes in Charnwood
Navigate through our locations to find the location of your next house in Charnwood, Leicester for sale or to rent.
| Streets | Postcodes |
|---|---|
| Aneford Road | LE4 9BA LE4 9BB |
| Attingham Close | LE4 9UQ |
| Bale Road | LE4 9BD LE4 9BE LE4 9BF LE4 9BG |
| Barker Street | LE5 3LF |
| Beckett Road | LE5 0HE LE5 0HF |
| Berrington Close | LE5 0NL |
| Birch Close | LE4 9UH |
| Blaise Grove | LE4 9UP |
| Blickling Walk | LE5 0NF |
| Brackley Close | LE4 9BH |
| Bramall Road | LE5 0PE LE5 0PF |
| Brambling Road | LE5 3HL |
| Braybrooke Road | LE4 9BJ LE4 9BL LE4 9BN LE4 9BP LE4 9BQ |
| Brighton Road | LE5 0HA |
| Buckland Road | LE5 0NT |
| Burnaby Avenue | LE5 3QX |
| Buscot Close | LE4 9TY |
| Bushby Road | LE5 0DE |
| Capesthorne Close | LE5 0NN |
| Carpe Road | LE4 9BS |
| Cedarwood Close | LE4 9UL |
| Claydon Road | LE5 0PL LE5 0PN |
| Clevedon Crescent | LE4 9BT |
| Cottesmore Road | LE5 3LJ LE5 3LN LE5 3LP |
| Culham Avenue | LE5 0NR |
| Curlew Walk | LE5 3FD |
| Dunholme Road | LE4 9BW |
| Dunlin Road | LE5 3FP |
| Farnham Street | LE5 3FL LE5 3HU |
| Farringdon Street | LE5 0EA LE5 0EB |
| Fern Bank | LE5 3HD |
| Fernie Road | LE5 3LS |
| Forest Road | LE5 0DT LE5 0DU LE5 0DW |
| Frewin Street | LE5 0PA |
| Frisby Road | LE5 0DL LE5 0DN LE5 0DP LE5 0DQ |
| Galby Street | LE5 0ED |
| Gipsy Lane | LE4 9DD LE4 9UA |
| Green Lane Road | LE5 3TH LE5 3TJ LE5 3TN |
| Hammercliffe Road | LE5 0EN |
| Harewood Street | LE5 3LU LE5 3LW LE5 3LX LE5 3LY |
| Hastings Road | LE5 0LJ |
| Holkham Avenue | LE4 9US |
| Houghton Street | LE5 0EE LE5 0EF |
| Humberstone Road | LE5 0EG LE5 0SA LE5 3DF |
| Ickworth Close | LE5 0NG |
| Iliffe Road | LE4 9DG |
| Kestrel Close | LE5 3FR |
| Larch Street | LE5 0ER LE5 0ES |
| Leveric Road | LE5 0HN |
| Litelmede | LE5 0PB LE5 0PD |
| Lombardy Rise | LE5 0FQ |
| Longcliffe Road | LE5 0EP |
| Longleat Close | LE5 0NQ |
| Mallory Place | LE5 0HS |
| Martival | LE5 0PG LE5 0PH LE5 0PJ |
| Mellerstain Walk | LE5 0ND |
| Mere Road | LE5 3HQ LE5 3HR LE5 3HS LE5 3HT |
| Mereworth Close | LE5 0NS |
| Mornington Street | LE5 3NF LE5 3NG |
| Mount Avenue | LE5 3RN |
| Mount Road | LE5 3DJ |
| Northfield Road | LE4 9DH LE4 9DJ |
| Oak Street | LE5 0ET LE5 0EU |
| Overton Road | LE5 0JA LE5 0JB |
| Parry Street | LE5 3NL LE5 3NN |
| Peake Road | LE4 9DN LE4 9DP |
| Pembroke Street | LE5 0FA |
| Percival Street | LE5 3NP LE5 3NQ LE5 3NR LE5 3NS |
| Prestwold Road | LE5 0EW LE5 0EX LE5 0EY LE5 0EZ |
| Prospect Hill | LE5 3RS LE5 3RT |
| Prospect Road | LE5 3RR |
| Quenby Street | LE5 0FB |
| Redwood Walk | LE5 0FN LE5 0FP |
| Rushford Close | LE4 9UG |
| Rushford Drive | LE4 9UF |
| Sandpiper Close | LE5 3FT |
| Sherrard Road | LE5 3DQ LE5 3DR LE5 3DS LE5 3DT |
| Smedmore Road | LE5 0NH |
| Spinney Hill Road | LE5 3GG |
| St Saviours Road | LE5 3GE LE5 3HW |
| Stockton Road | LE4 9DS |
| Stroud Road | LE5 3NX |
| Sulgrave Road | LE5 0LA LE5 0LH |
| Swainson Road | LE4 9DQ LE4 9DR |
| Sylvan Avenue | LE5 3SN |
| Tailby Avenue | LE5 0JP LE5 0JQ |
| The Portwey | LE5 0PS LE5 0PT |
| Thornville Close | LE4 9DT |
| Thurlby Road | LE5 3PD LE5 3PE |
| Tomlin Road | LE4 9DU LE4 9DW |
| Tunstall Crescent | LE4 9DX |
| Turnstone Walk | LE5 3FH |
| Uppingham Road | LE5 0QD LE5 0QE LE5 0QF LE5 0QG |
| Victoria Road East | LE5 0LF LE5 0LG LE5 0LL |
| Whinchat Road | LE5 3FA |
| Willow Brook Road | LE5 0FE LE5 0FF LE5 0FG LE5 0FH |
| Winchendon Close | LE5 0NE |
| Wood Hill | LE5 3JB LE5 3SP |
| Woodgreen Road | LE4 9UB LE4 9UD LE4 9UE |
| Woodgreen Walk | LE4 9UN |
| Woodside Close | LE4 9UJ |
| Wycombe Road | LE5 0PP LE5 0PQ LE5 0PR |
Transport near Charnwood
- FAQ
- Price Paid By Year
- Property Type Price
Frequently asked questions about Charnwood
What is the average price for a property for sale in Charnwood?
The average price for a property for sale in Charnwood is £226,112. This amount is 6% lower than the average price in Leicester. There are 1,068 property listings for sale in Charnwood.
What streets have the most expensive properties for sale in Charnwood?
The streets with the most expensive properties for sale in Charnwood are Leveric Road at an average of £313,500, Carpe Road at an average of £295,000 and Woodside Close at an average of £288,250.
What streets have the most affordable properties for sale in Charnwood?
The streets with the most affordable properties for sale in Charnwood are Lombardy Rise at an average of £66,131, St Saviours Road at an average of £120,000 and Capesthorne Close at an average of £122,593.
Which train stations are available in or near Charnwood?
Some of the train stations available in or near Charnwood are Leicester, Syston and South Wigston.
Property Price Paid in Charnwood by Year
The average sold property price by year was:
| Year | Average Sold Price | Price Change |
Sold Properties
|
|---|---|---|---|
| 2025 | £235,795 | 5% |
46 Properties |
| 2024 | £224,979 | -0,2% |
49 Properties |
| 2023 | £225,356 | 1% |
67 Properties |
| 2022 | £222,540 | 5% |
95 Properties |
| 2021 | £212,010 | 13% |
109 Properties |
| 2020 | £185,118 | 13% |
72 Properties |
| 2019 | £161,469 | -3% |
91 Properties |
| 2018 | £166,290 | 11% |
90 Properties |
| 2017 | £147,608 | 9% |
119 Properties |
| 2016 | £134,366 | 5% |
94 Properties |
| 2015 | £128,247 | 11% |
112 Properties |
| 2014 | £114,249 | 4% |
92 Properties |
| 2013 | £110,136 | 2% |
73 Properties |
| 2012 | £108,280 | 2% |
62 Properties |
| 2011 | £106,623 | -2% |
66 Properties |
| 2010 | £108,557 | 11% |
82 Properties |
| 2009 | £97,078 | -15% |
64 Properties |
| 2008 | £111,748 | -1% |
78 Properties |
| 2007 | £113,080 | 6% |
148 Properties |
| 2006 | £105,783 | 3% |
191 Properties |
| 2005 | £102,605 | 7% |
150 Properties |
| 2004 | £95,831 | 23% |
174 Properties |
| 2003 | £74,105 | 22% |
217 Properties |
| 2002 | £57,918 | 29% |
210 Properties |
| 2001 | £41,406 | 22% |
201 Properties |
| 2000 | £32,344 | 0,3% |
166 Properties |
| 1999 | £32,240 | 7% |
132 Properties |
| 1998 | £30,052 | 10% |
113 Properties |
| 1997 | £27,122 | -22% |
103 Properties |
| 1996 | £32,982 | 6% |
82 Properties |
| 1995 | £30,876 | - |
113 Properties |
Property Price per Property Type in Charnwood
Here you can find historic sold price data in order to help with your property search.
The average Property Paid Price for specific property types in the last three years are:
| Property Type | Average Sold Price | Sold Properties |
|---|---|---|
| Flat | £88,417.00 | 15 Flats |
| Semi Detached House | £258,213.00 | 40 Semi Detached Houses |
| Terraced House | £229,830.00 | 201 Terraced Houses |
| Detached House | £260,000.00 | 1 Detached House |

