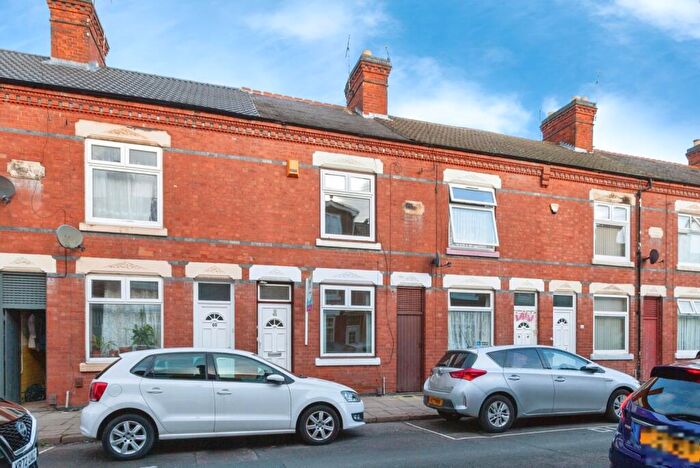
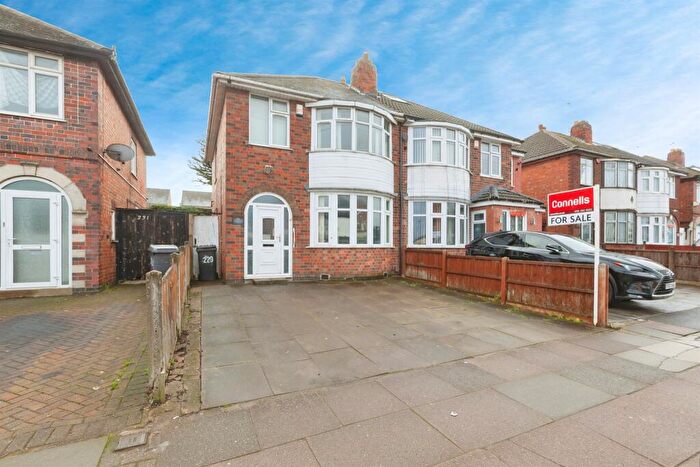
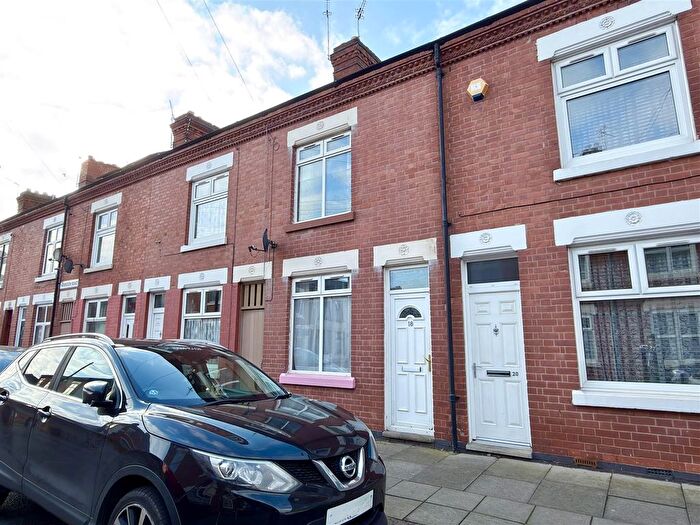
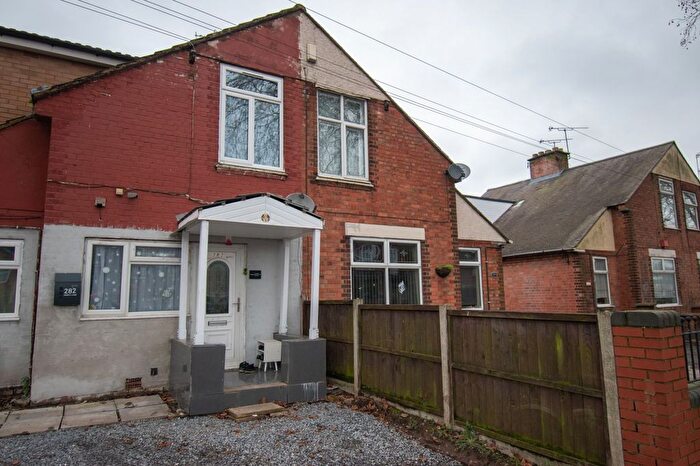
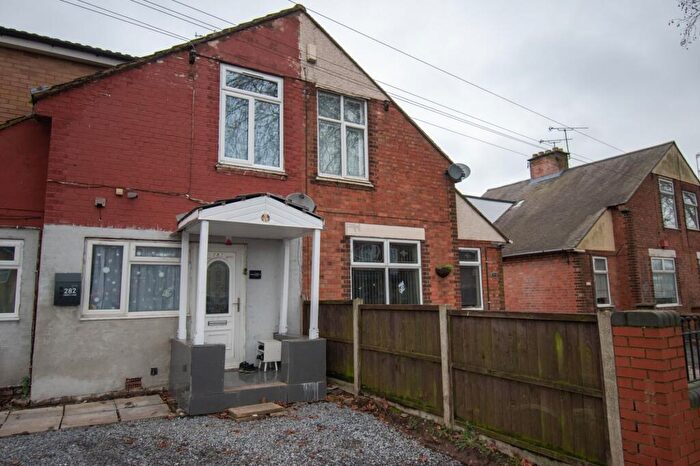
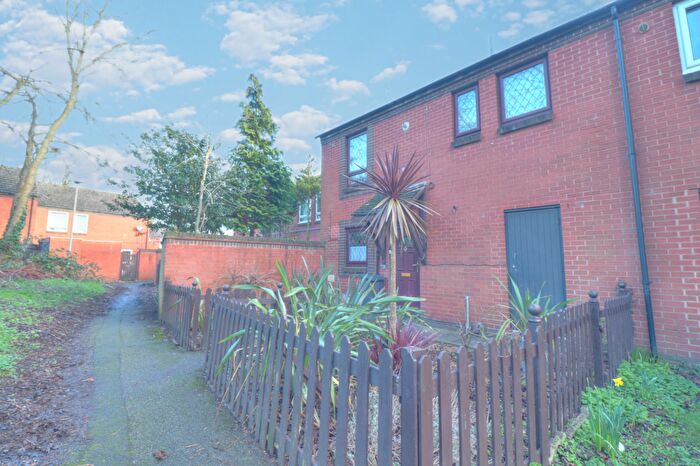
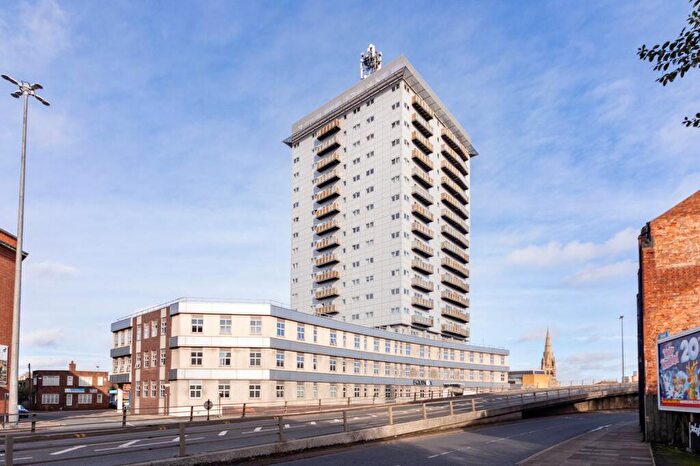
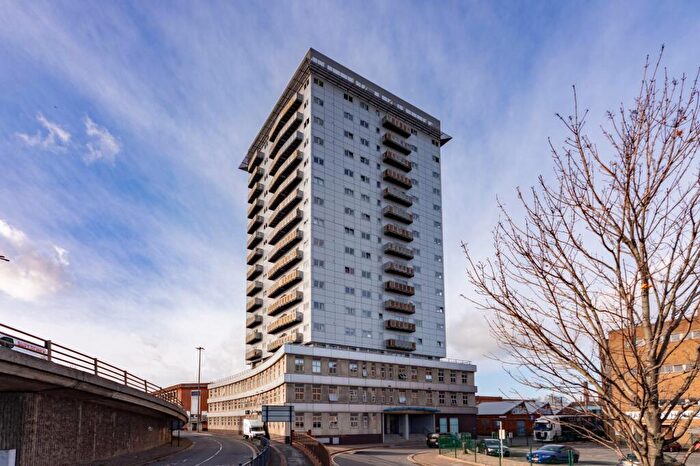
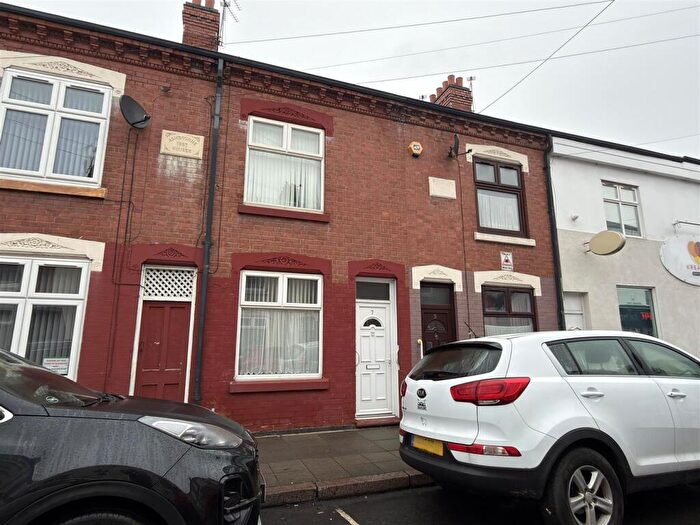
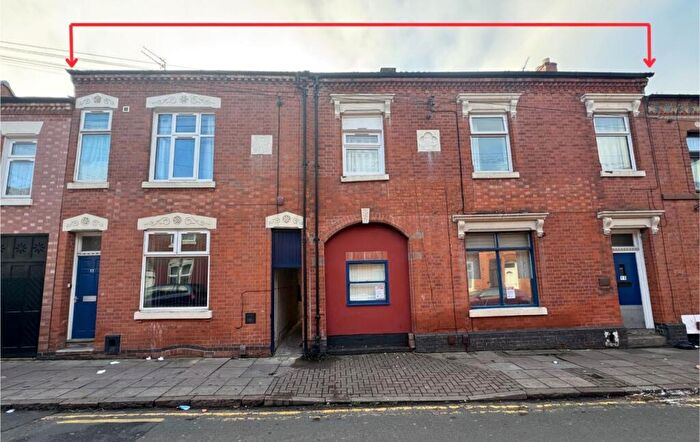
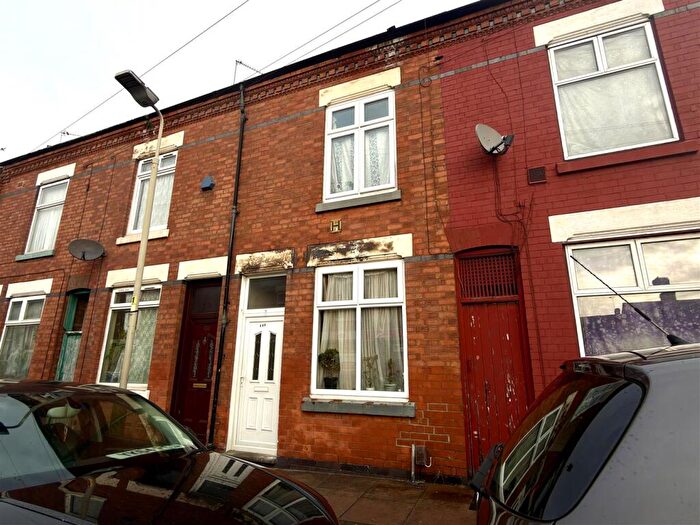
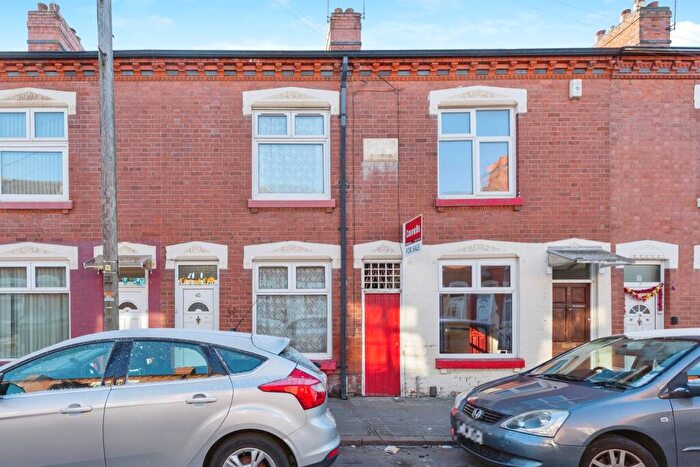
Houses for sale & to rent in Belgrave, Leicester
House Prices in Belgrave
Properties in Belgrave have an average house price of £262,625.00 and had 8 Property Transactions within the last 3 years¹.
Belgrave is an area in Leicester, Leicestershire with 274 households², where the most expensive property was sold for £352,000.00.
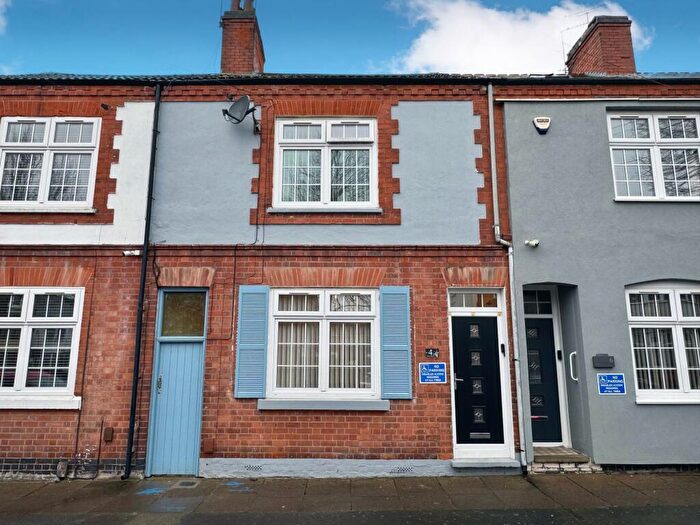
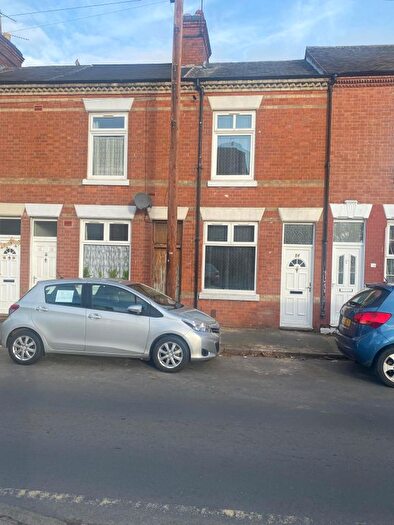
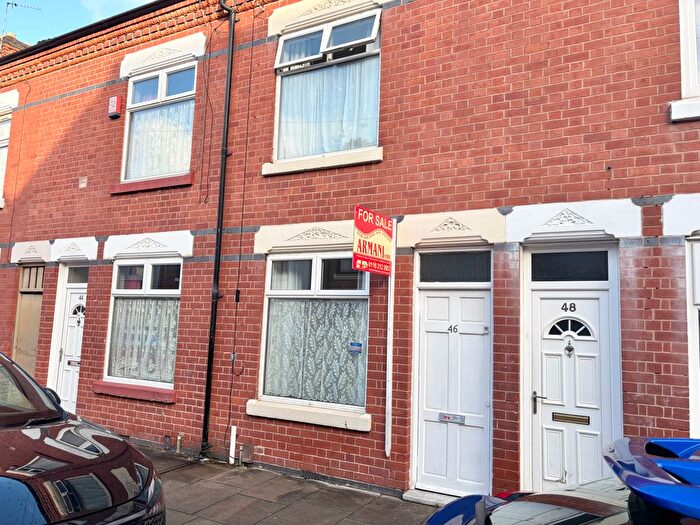
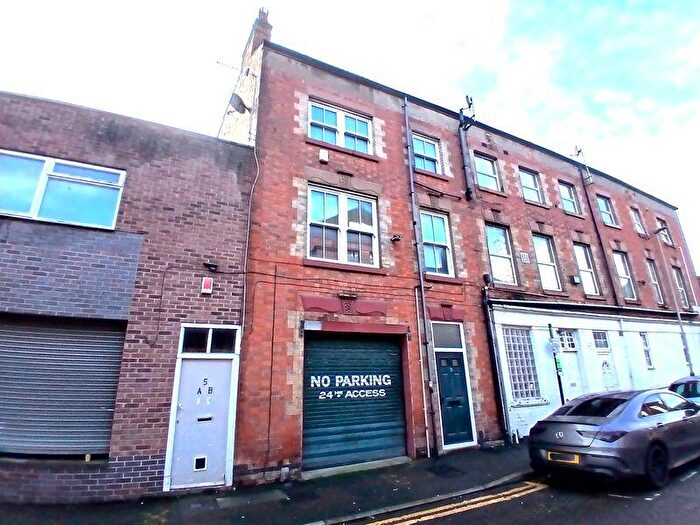
Properties for sale in Belgrave
Roads and Postcodes in Belgrave
Navigate through our locations to find the location of your next house in Belgrave, Leicester for sale or to rent.
| Streets | Postcodes |
|---|---|
| Abbey Park Street | LE4 5AF LE4 5AG |
| Allington Street | LE4 6AB |
| Baseball Walk | LE4 5HB LE4 5HX |
| Belgrave Road | LE4 5AU LE4 5AX LE4 6AR |
| Brogue Street | LE4 5HS LE4 5HY |
| Charles Bennion Walk | LE4 5FF LE4 5FG |
| Checketts Road | LE4 5EP |
| Church Road | LE4 5PE |
| Claremont Street | LE4 7QG |
| Cobden Street | LE1 2LB |
| Curzon Street | LE1 2HH |
| Dorset Street | LE4 6BL |
| Dysart Way | LE1 2JY |
| Ferrous Close | LE4 6EJ |
| Freehold Street | LE1 2LX |
| Haramead Business Centre | LE1 2LH |
| Hathaway Close | LE4 6BZ |
| Hildyard Road | LE4 5GG |
| Jackson Street | LE4 5JG |
| Latimer Place | LE4 6DH |
| Laundry Lane | LE4 5JH |
| Little Avenue | LE4 5EN |
| Loughborough Road | LE4 5HQ LE4 5LG LE4 5LQ LE4 5PR |
| Mckay Avenue | LE4 5FD |
| Mill Hill | LE4 5JL |
| Moccasin Avenue | LE4 5HT |
| Orchardson Avenue | LE4 6AD LE4 6DP |
| Pearson Avenue | LE4 5JE |
| Portsmouth Road | LE4 5DY |
| Rawsthorne Walk | LE4 6BJ |
| Ross Walk | LE4 5AW LE4 5HA LE4 5FT |
| Roughton Street | LE4 5JQ |
| Sahara Close | LE4 5EJ |
| Somerscales Walk | LE4 6DY |
| St Bernard Street | LE4 5JR |
| Syston Street East | LE1 2JW |
| Syston Street West | LE1 2JU |
| Talbot Street | LE4 5PP |
| Ulverscroft Road | LE4 6BW LE4 6BY |
| LE4 5LE |
Transport near Belgrave
- FAQ
- Price Paid By Year
- Property Type Price
Frequently asked questions about Belgrave
What is the average price for a property for sale in Belgrave?
The average price for a property for sale in Belgrave is £262,625. This amount is 16% lower than the average price in Leicester. There are 891 property listings for sale in Belgrave.
What streets have the most expensive properties for sale in Belgrave?
The streets with the most expensive properties for sale in Belgrave are Mckay Avenue at an average of £345,000, Moccasin Avenue at an average of £305,000 and Charles Bennion Walk at an average of £266,000.
What streets have the most affordable properties for sale in Belgrave?
The streets with the most affordable properties for sale in Belgrave are Loughborough Road at an average of £144,000 and Church Road at an average of £230,000.
Which train stations are available in or near Belgrave?
Some of the train stations available in or near Belgrave are Leicester, Syston and South Wigston.
Property Price Paid in Belgrave by Year
The average sold property price by year was:
| Year | Average Sold Price | Price Change |
Sold Properties
|
|---|---|---|---|
| 2025 | £321,000 | 30% |
2 Properties |
| 2024 | £224,750 | -25% |
4 Properties |
| 2023 | £280,000 | 12% |
2 Properties |
| 2022 | £245,216 | -29% |
6 Properties |
| 2021 | £317,500 | 58% |
2 Properties |
| 2020 | £134,000 | -5% |
1 Property |
| 2019 | £141,142 | -23% |
7 Properties |
| 2018 | £174,267 | -29% |
17 Properties |
| 2017 | £225,289 | 12% |
41 Properties |
| 2016 | £198,033 | 8% |
24 Properties |
| 2014 | £182,885 | 23% |
6 Properties |
| 2009 | £140,000 | 35% |
1 Property |
| 2003 | £90,500 | 66% |
2 Properties |
| 2002 | £30,750 | -50% |
1 Property |
| 2001 | £46,000 | -30% |
1 Property |
| 2000 | £60,000 | 42% |
1 Property |
| 1999 | £35,000 | 61% |
1 Property |
| 1997 | £13,500 | - |
1 Property |
Property Price per Property Type in Belgrave
Here you can find historic sold price data in order to help with your property search.
The average Property Paid Price for specific property types in the last three years are:
| Property Type | Average Sold Price | Sold Properties |
|---|---|---|
| Terraced House | £274,428.00 | 7 Terraced Houses |
| Flat | £180,000.00 | 1 Flat |

