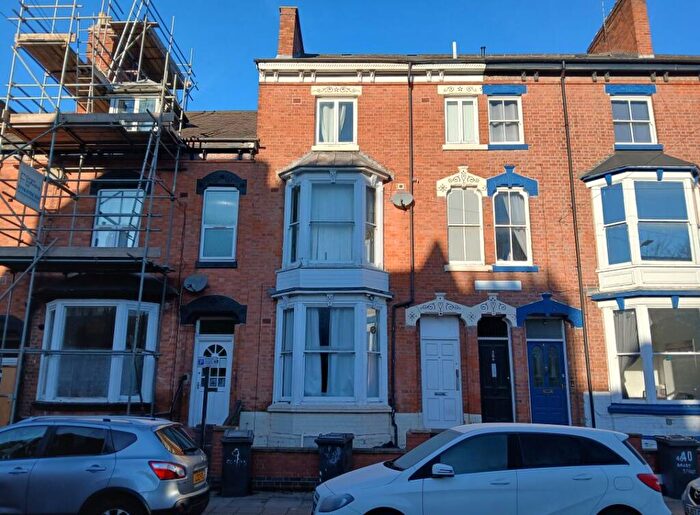
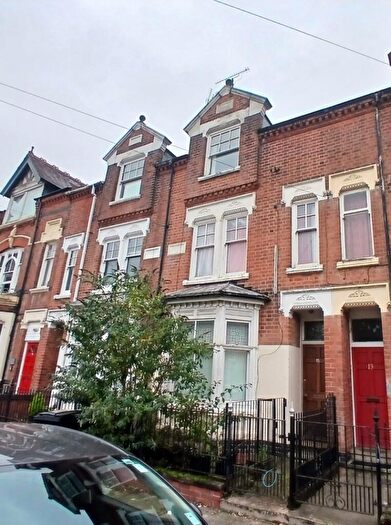
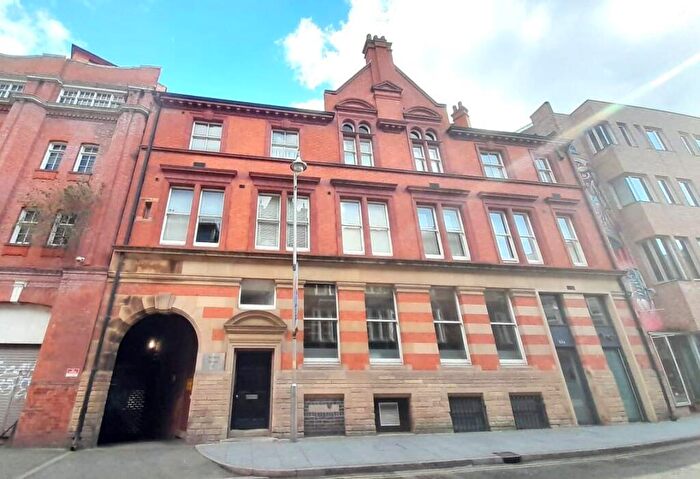
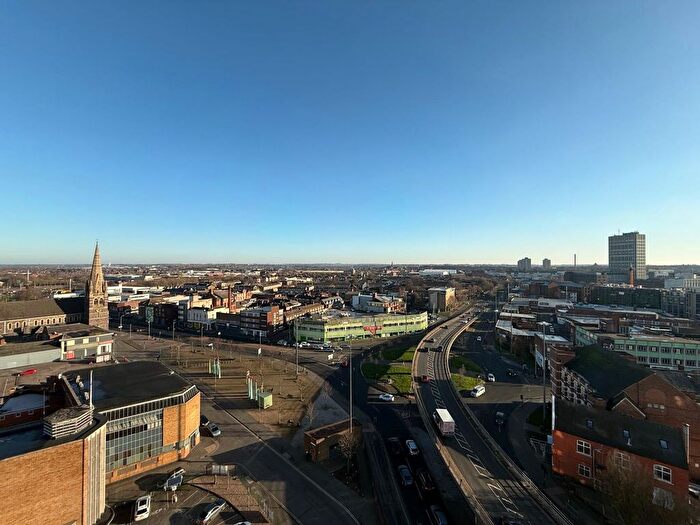
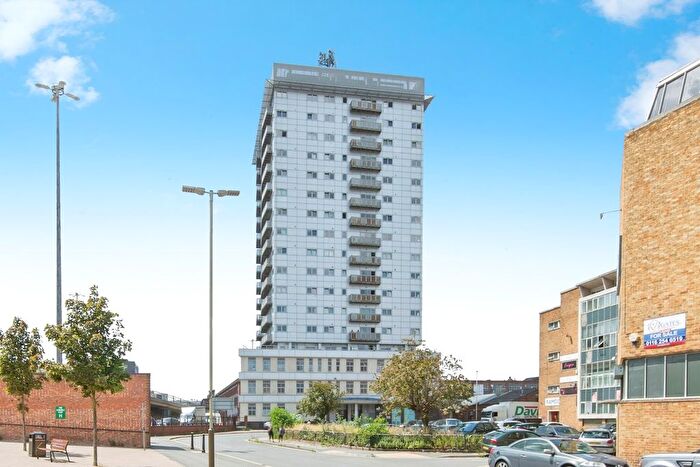
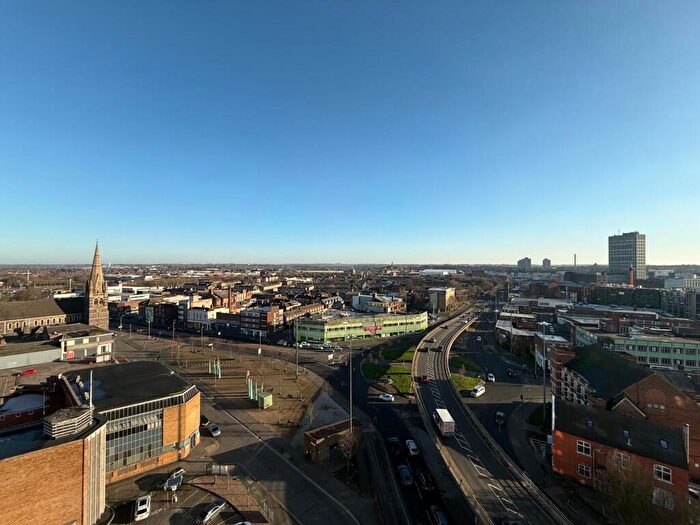
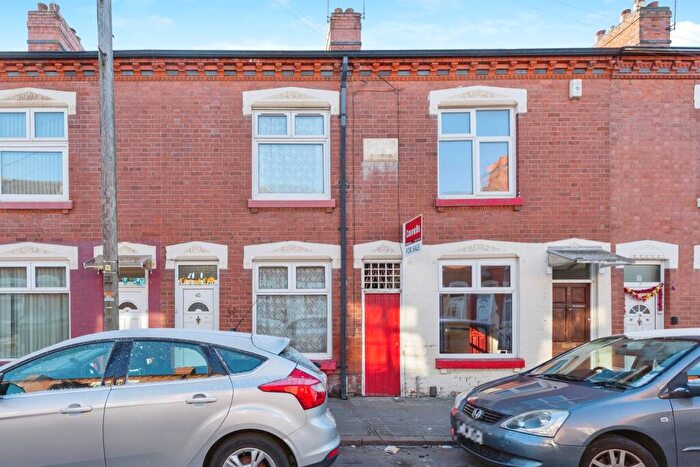
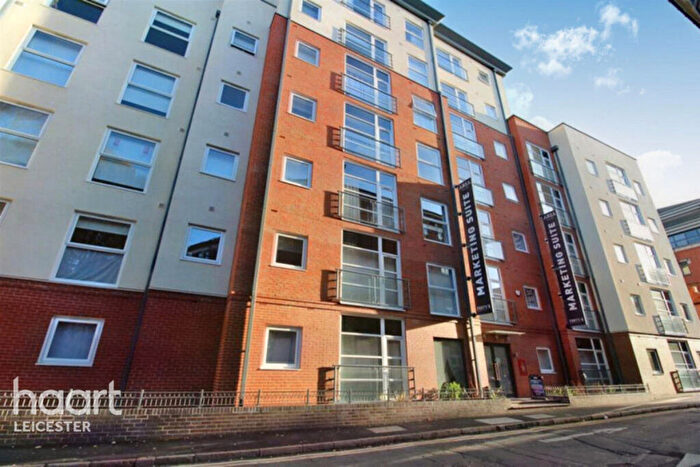
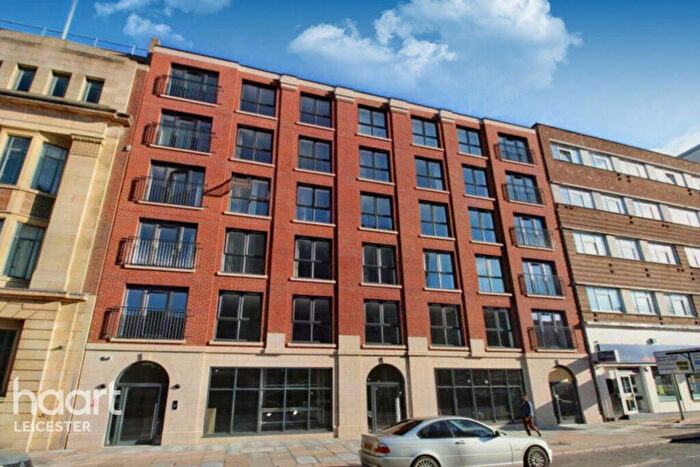
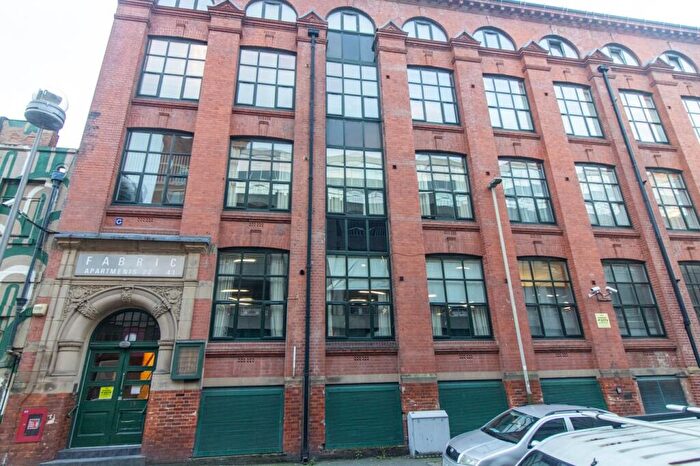
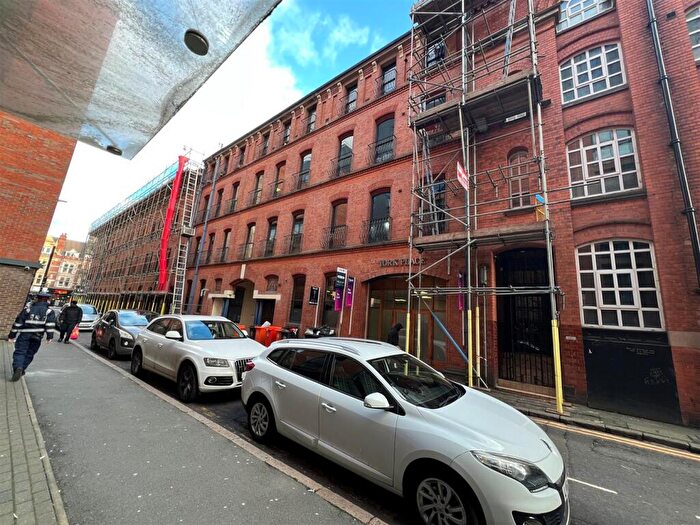
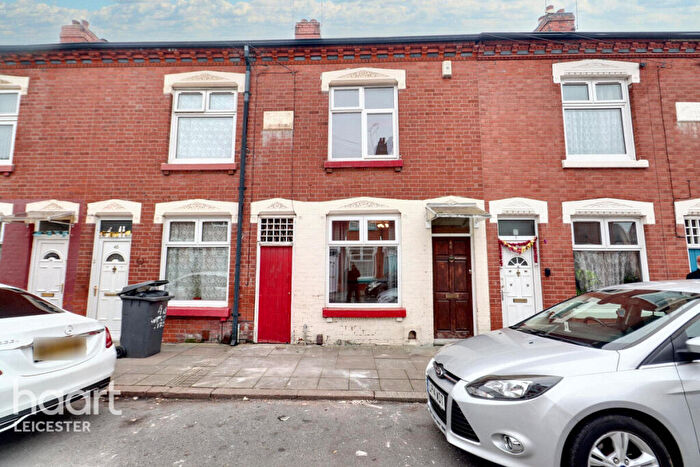
Houses for sale & to rent in Wycliffe, Leicester
House Prices in Wycliffe
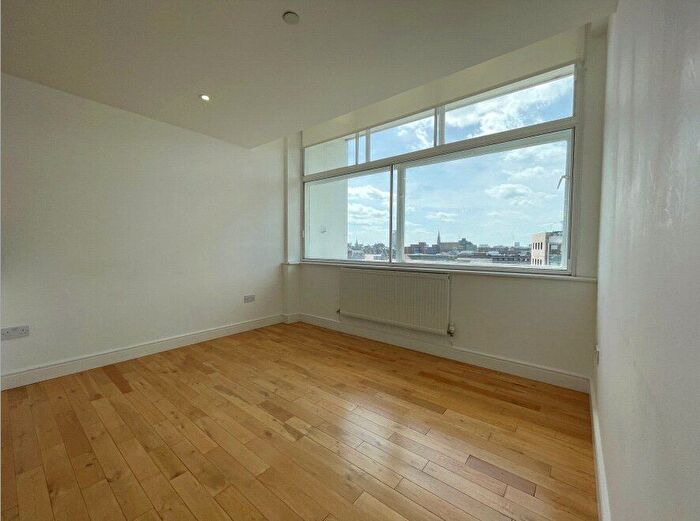
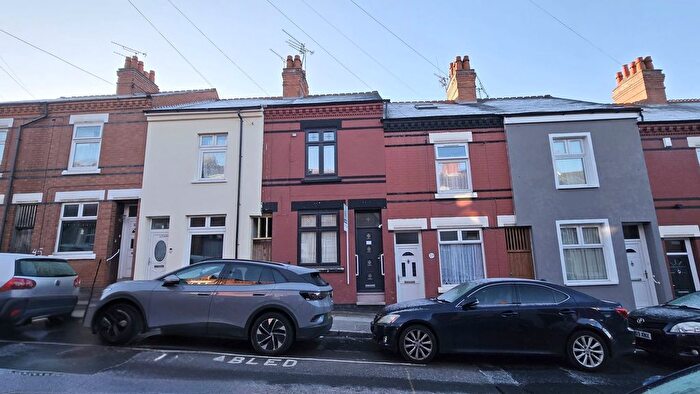
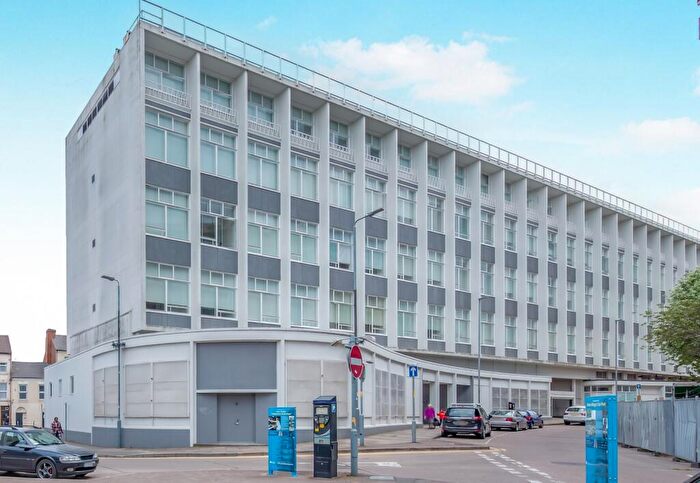
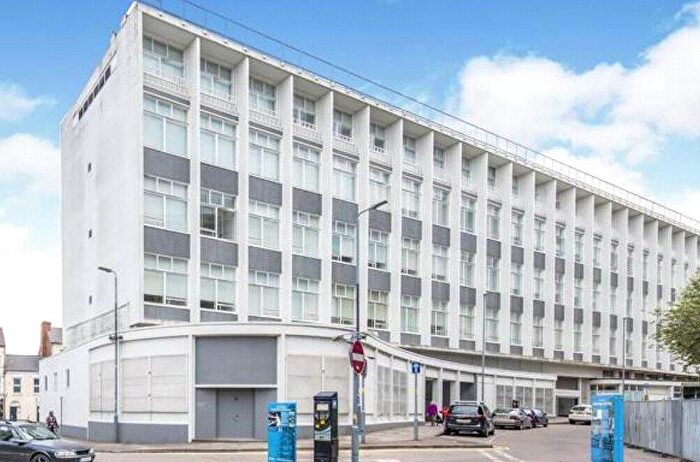
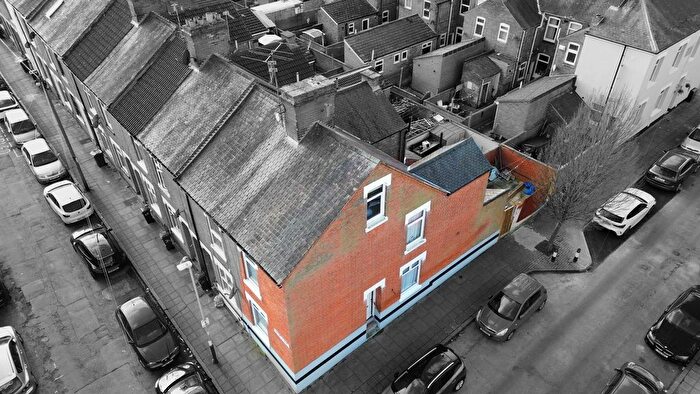
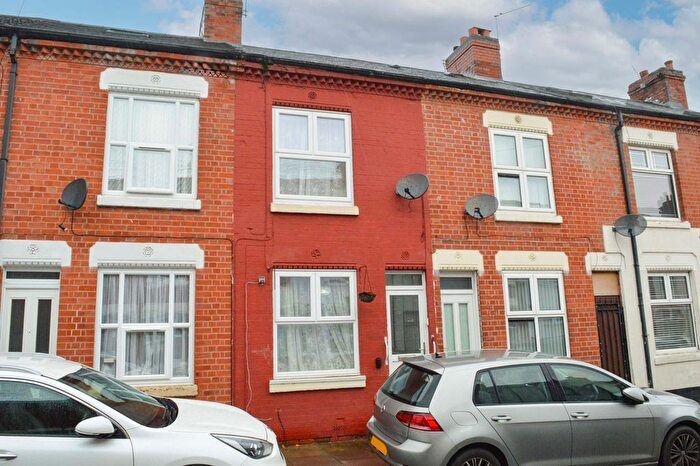
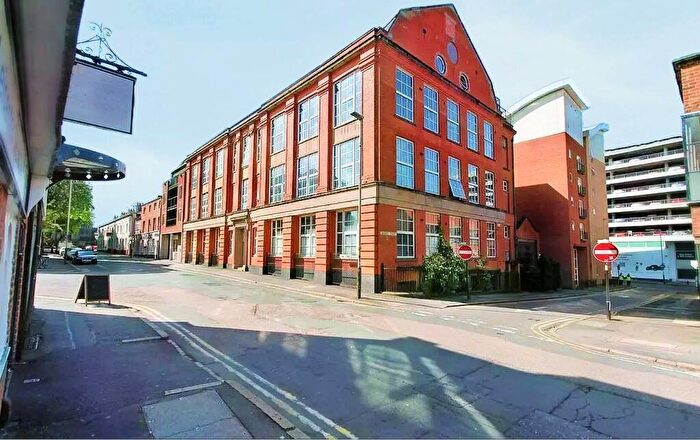
Properties in Wycliffe have an average house price of £142,100.00 and had 20 Property Transactions within the last 3 years¹.
Wycliffe is an area in Leicester, City of Leicester with 1,670 households², where the most expensive property was sold for £223,000.00.
Properties for sale in Wycliffe
Roads and Postcodes in Wycliffe
Navigate through our locations to find the location of your next house in Wycliffe, Leicester for sale or to rent.
| Streets | Postcodes |
|---|---|
| Apollo Close | LE2 0UF |
| Arnold Street | LE1 2LA |
| Atlas Close | LE2 0UG |
| Barnard Close | LE2 0UZ |
| Bedford Street North | LE1 3JE |
| Belgrave Gate | LE1 3HT LE1 3HU |
| Bell Lane | LE5 3BA |
| Berners Street | LE2 0AG |
| Britannia Street | LE1 3LE |
| Brougham Street | LE1 2BA |
| Brunswick Street | LE1 2LP |
| Calgary Road | LE1 2HA LE1 2HB |
| Chester Close | LE1 2GY LE1 2GZ |
| Christow Street | LE1 2GL |
| Constitution Hill | LE1 1PL |
| Cradock Street | LE5 3AW |
| Crafton Street East | LE1 2DG |
| Edmonton Road | LE1 2FA LE1 2FB |
| Everest Court | LE1 2PP |
| Fraser Close | LE1 2GG |
| Graham Street | LE5 3BB |
| Grosvenor Street | LE1 3LR |
| Humberstone Road | LE5 0AT LE5 0AU LE5 3AD LE5 3AF LE5 3AJ LE5 3AP LE5 3AQ |
| Hutchinson Street | LE2 0BD |
| Hydra Walk | LE2 0UY |
| Junction Road | LE1 2HS |
| Jupiter Close | LE2 0US |
| Kamloops Crescent | LE1 2HW LE1 2HX |
| Kashmir Road | LE1 2NA LE1 2NB LE1 2ND LE1 2NG LE1 2NH LE1 2NJ LE1 2NL |
| Kent Street | LE2 0AY LE5 3BD LE5 3BE |
| Lethbridge Close | LE1 2EA LE1 2EB |
| Lower Willow Street | LE1 2HP |
| Mackenzie Way | LE1 2FP |
| Madras Road | LE1 2LT |
| Maidstone Road | LE2 0TU LE2 0TW |
| Malabar Road | LE1 2LG LE1 2NZ LE1 2PA LE1 2PB LE1 2PD |
| Manitoba Road | LE1 2FT LE1 2FU LE1 2FW LE1 2FX |
| Melbourne Road | LE2 0DS |
| Melton Street | LE1 3NB |
| Monckton Close | LE1 2JJ |
| Montreal Road | LE1 2GR LE1 2GS |
| Murray Street | LE2 0AT |
| Nedham Street | LE2 0HA LE2 0HD LE2 0HE |
| Neptune Close | LE2 0UP |
| Ontario Close | LE1 2JE |
| Ottawa Road | LE1 2EH LE1 2EJ LE1 2EL LE1 2EP |
| Pluto Close | LE2 0UW |
| Polaris Close | LE2 0UQ |
| Quebec Road | LE1 2FH |
| Samuel Street | LE1 1RU |
| Sheldon Street | LE5 3AR |
| Sparkenhoe Street | LE2 0TA LE2 0TH LE2 0TL LE2 0TN |
| St Georges Retail Park | LE1 1SG |
| St Georges Way | LE1 1SP |
| St Marks Street | LE1 3AQ |
| St Peters Road | LE2 1AQ |
| Sussex Street | LE5 3BF |
| Taurus Close | LE2 0UN |
| Taylor Road | LE1 2JP |
| Trading Estate | LE2 0UB |
| Upper Charnwood Street | LE2 0BE |
| Upper George Street | LE1 3LQ |
| Vulcan Road | LE5 3EA |
| Wanlip Street | LE1 2JS |
| William Street | LE1 1RW |
| Willow Court | LE2 0TR |
| Willow Street | LE1 2HR |
| Yukon Way | LE1 2AF |
Transport near Wycliffe
- FAQ
- Price Paid By Year
- Property Type Price
Frequently asked questions about Wycliffe
What is the average price for a property for sale in Wycliffe?
The average price for a property for sale in Wycliffe is £142,100. This amount is 41% lower than the average price in Leicester. There are 1,798 property listings for sale in Wycliffe.
What streets have the most expensive properties for sale in Wycliffe?
The streets with the most expensive properties for sale in Wycliffe are Malabar Road at an average of £195,000, Fraser Close at an average of £125,000 and Chester Close at an average of £125,000.
What streets have the most affordable properties for sale in Wycliffe?
The streets with the most affordable properties for sale in Wycliffe are Kamloops Crescent at an average of £90,000, Edmonton Road at an average of £117,500 and Willow Street at an average of £120,000.
Which train stations are available in or near Wycliffe?
Some of the train stations available in or near Wycliffe are Leicester, South Wigston and Syston.
Property Price Paid in Wycliffe by Year
The average sold property price by year was:
| Year | Average Sold Price | Price Change |
Sold Properties
|
|---|---|---|---|
| 2024 | £132,857 | -7% |
7 Properties |
| 2023 | £142,666 | -6% |
6 Properties |
| 2022 | £150,857 | 40% |
7 Properties |
| 2021 | £90,000 | 4% |
1 Property |
| 2020 | £86,625 | 23% |
4 Properties |
| 2019 | £67,000 | -4% |
2 Properties |
| 2016 | £69,750 | 7% |
4 Properties |
| 2015 | £65,000 | -12% |
1 Property |
| 2014 | £72,500 | -53% |
2 Properties |
| 2008 | £111,000 | -116% |
1 Property |
| 2006 | £240,000 | -3% |
3 Properties |
| 2005 | £248,000 | 27% |
1 Property |
| 2004 | £182,000 | 30% |
2 Properties |
| 2003 | £128,000 | 63% |
1 Property |
| 2001 | £48,000 | -77% |
1 Property |
| 2000 | £85,000 | -41% |
1 Property |
| 1999 | £120,000 | -192% |
1 Property |
| 1997 | £350,000 | 56% |
1 Property |
| 1996 | £153,250 | 45% |
2 Properties |
| 1995 | £85,000 | - |
1 Property |
Property Price per Property Type in Wycliffe
Here you can find historic sold price data in order to help with your property search.
The average Property Paid Price for specific property types in the last three years are:
| Property Type | Average Sold Price | Sold Properties |
|---|---|---|
| Flat | £142,100.00 | 20 Flats |

