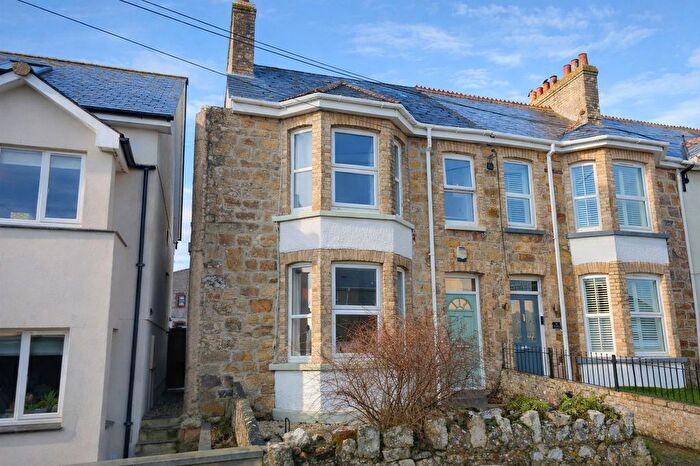
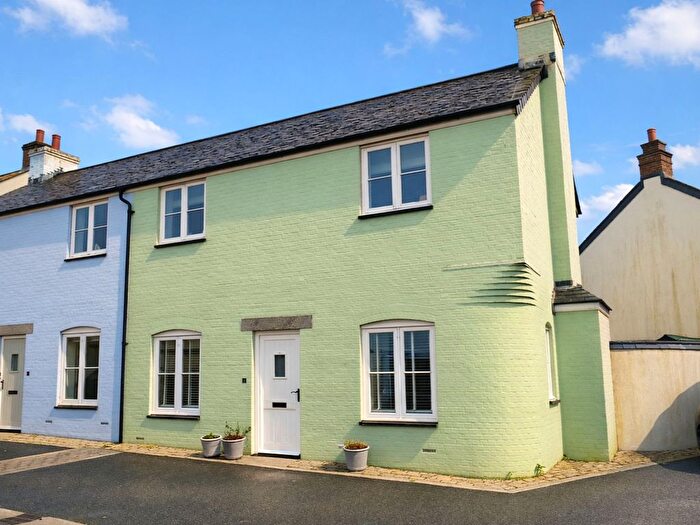
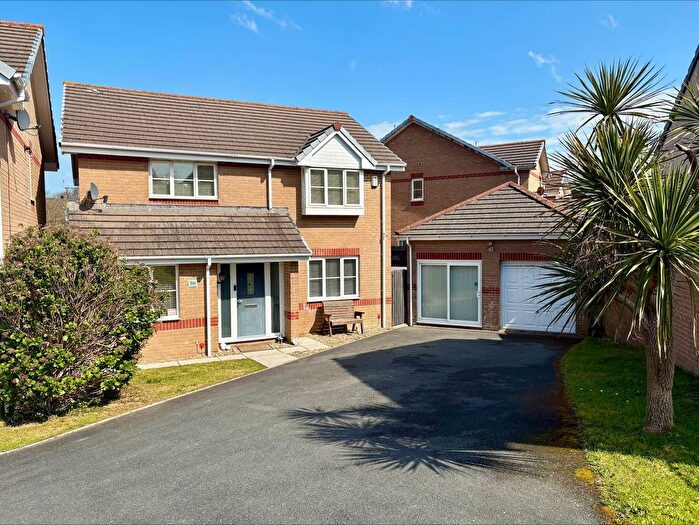
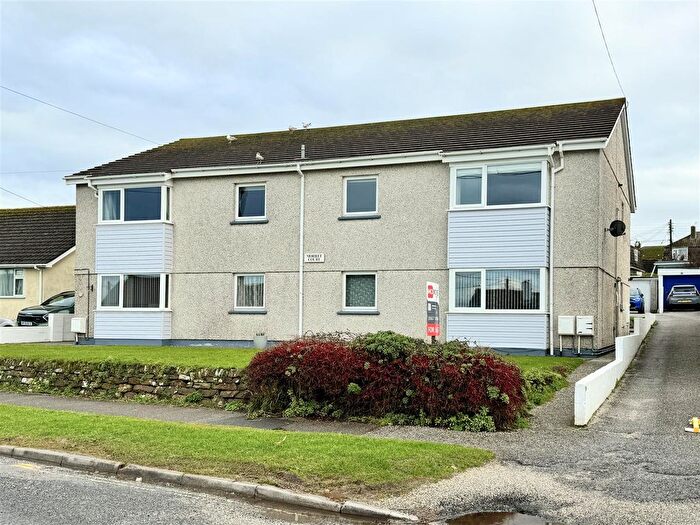
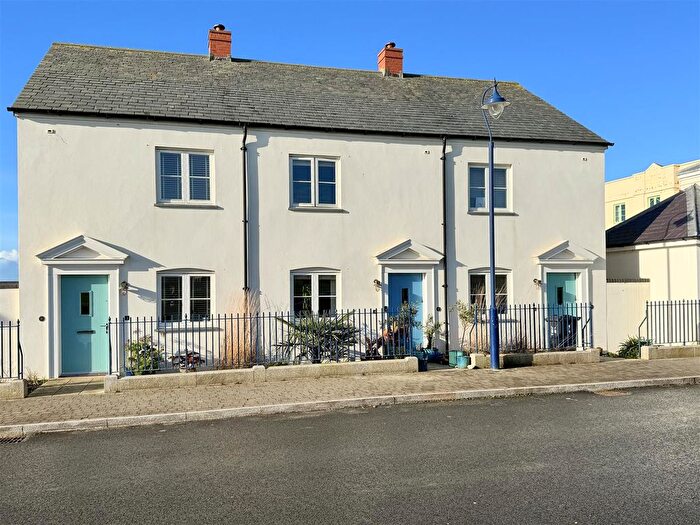
Houses for sale & to rent in Newquay Treviglas, Newquay
House Prices in Newquay Treviglas
Properties in Newquay Treviglas have an average house price of £333,407.00 and had 212 Property Transactions within the last 3 years¹.
Newquay Treviglas is an area in Newquay, Cornwall with 1,808 households², where the most expensive property was sold for £870,000.00.
Properties for sale in Newquay Treviglas
Previously listed properties in Newquay Treviglas
Roads and Postcodes in Newquay Treviglas
Navigate through our locations to find the location of your next house in Newquay Treviglas, Newquay for sale or to rent.
| Streets | Postcodes |
|---|---|
| Alexandra Court | TR7 3NJ |
| Alexandra Road | TR7 3ND TR7 3RU |
| Alldritt Close | TR7 3HR |
| Arundel Way | TR7 3AG TR7 3BB |
| Ashton Court | TR7 3HS |
| Aylwin Close | TR7 3EF |
| Beach Road | TR7 3DR TR7 3FG TR7 3LN TR7 3NE TR7 3NF TR7 3NQ TR7 3NG |
| Beach View Close | TR7 3LE |
| Beach Walk | TR7 3NP |
| Bolowthas Way | TR7 3DB |
| Bonython Road | TR7 3AL TR7 3DF |
| Bradley Road | TR7 3JN TR7 3JA |
| Calshot Close | TR7 3HL |
| Century Court | TR7 3JP |
| Christian Way | TR7 3LA |
| Church Lane | TR7 3HA |
| Church Street | TR7 3EP TR7 3ES TR7 3ET TR7 3EX TR7 3EY TR7 3EZ |
| Chylan Crescent | TR7 3EG |
| Coronation Way | TR7 3JL |
| Cross Close | TR7 3LB TR7 3LD |
| Duchy Avenue | TR7 3LG |
| Felixstowe Avenue | TR7 3HN |
| Godolphin Way | TR7 3BU |
| Greenbank Crescent | TR7 3JX TR7 3JY |
| Gregory Court | TR7 3LF |
| Gyles Court | TR7 3ER |
| Henver Road | TR7 3DG TR7 3DH TR7 3DJ TR7 3DL TR7 3DN TR7 3DP TR7 3DQ TR7 3DT TR7 3DW TR7 3EH TR7 3EJ TR7 3EL TR7 3EQ |
| Henwood Crescent | TR7 3HG |
| Leader Road | TR7 3HJ TR7 3HQ TR7 3HH |
| Lewarne Crescent | TR7 3JW |
| Lewarne Road | TR7 3JR TR7 3JS TR7 3JT TR7 3JU |
| Manewas Way | TR7 3AJ TR7 3AT |
| Mount Batten Close | TR7 3HP |
| Parkenbutts | TR7 3HE |
| Parkland Close | TR7 3EB TR7 3ED |
| Pembroke Road | TR7 3HW |
| Penhallow Road | TR7 3BY TR7 3BZ TR7 3DA |
| Penwartha Close | TR7 3JQ |
| Place Parc | TR7 3HY |
| Porth Bean Road | TR7 3EW TR7 3JB TR7 3JD TR7 3JE TR7 3JF TR7 3JG TR7 3LJ TR7 3LQ TR7 3LT TR7 3LU |
| Porth Parade | TR7 3JZ |
| Porth Way | TR7 3BD TR7 3LH TR7 3LP TR7 3LW TR7 3NL TR7 3NN TR7 3NR |
| Praze Road | TR7 3AF TR7 3DD TR7 3DE |
| Priory Road | TR7 3HX TR7 3HD |
| Quintrell Court | TR7 3BE |
| Quintrell Road | TR7 3DX TR7 3DZ |
| Rialton Heights | TR7 3HU |
| Rialton Road | TR7 3EA |
| Roma Court | TR7 3JH |
| Stafford Close | TR7 3HT |
| Stanharver Close | TR7 3EE |
| Stanways Road | TR7 3HF |
| The Square | TR7 3HB |
| The Strand | TR7 3FS |
| Tolcrows Court | TR7 3BQ |
| Treviglas Close | TR7 3JJ |
| Veor Road | TR7 3BX |
| Well Way | TR7 3LR TR7 3LS |
Transport near Newquay Treviglas
- FAQ
- Price Paid By Year
- Property Type Price
Frequently asked questions about Newquay Treviglas
What is the average price for a property for sale in Newquay Treviglas?
The average price for a property for sale in Newquay Treviglas is £333,407. This amount is 9% lower than the average price in Newquay. There are 963 property listings for sale in Newquay Treviglas.
What streets have the most expensive properties for sale in Newquay Treviglas?
The streets with the most expensive properties for sale in Newquay Treviglas are Arundel Way at an average of £651,250, Alexandra Court at an average of £648,000 and Beach Walk at an average of £625,000.
What streets have the most affordable properties for sale in Newquay Treviglas?
The streets with the most affordable properties for sale in Newquay Treviglas are Gregory Court at an average of £93,000, Quintrell Court at an average of £142,500 and Alexandra Road at an average of £162,475.
Which train stations are available in or near Newquay Treviglas?
Some of the train stations available in or near Newquay Treviglas are Newquay, Quintrell Downs and St.Columb Road.
Property Price Paid in Newquay Treviglas by Year
The average sold property price by year was:
| Year | Average Sold Price | Price Change |
Sold Properties
|
|---|---|---|---|
| 2025 | £307,861 | -14% |
61 Properties |
| 2024 | £350,158 | 4% |
83 Properties |
| 2023 | £335,877 | -8% |
68 Properties |
| 2022 | £362,518 | 8% |
65 Properties |
| 2021 | £333,343 | 18% |
80 Properties |
| 2020 | £272,142 | -1% |
62 Properties |
| 2019 | £275,331 | 11% |
74 Properties |
| 2018 | £243,771 | -20% |
68 Properties |
| 2017 | £291,844 | 22% |
83 Properties |
| 2016 | £226,659 | 2% |
77 Properties |
| 2015 | £221,139 | 5% |
92 Properties |
| 2014 | £210,312 | 11% |
85 Properties |
| 2013 | £187,438 | 4% |
56 Properties |
| 2012 | £180,067 | -4% |
57 Properties |
| 2011 | £187,794 | -8% |
87 Properties |
| 2010 | £202,956 | 0,5% |
86 Properties |
| 2009 | £201,982 | -10% |
62 Properties |
| 2008 | £222,066 | -1% |
51 Properties |
| 2007 | £224,582 | 7% |
87 Properties |
| 2006 | £209,935 | 12% |
92 Properties |
| 2005 | £185,059 | -3% |
68 Properties |
| 2004 | £190,718 | 18% |
92 Properties |
| 2003 | £156,271 | 19% |
103 Properties |
| 2002 | £126,166 | 25% |
97 Properties |
| 2001 | £94,431 | 11% |
93 Properties |
| 2000 | £84,318 | 11% |
89 Properties |
| 1999 | £75,147 | 9% |
92 Properties |
| 1998 | £68,371 | 13% |
80 Properties |
| 1997 | £59,735 | -3% |
76 Properties |
| 1996 | £61,819 | 11% |
76 Properties |
| 1995 | £55,189 | - |
58 Properties |
Property Price per Property Type in Newquay Treviglas
Here you can find historic sold price data in order to help with your property search.
The average Property Paid Price for specific property types in the last three years are:
| Property Type | Average Sold Price | Sold Properties |
|---|---|---|
| Semi Detached House | £324,091.00 | 56 Semi Detached Houses |
| Detached House | £475,614.00 | 63 Detached Houses |
| Terraced House | £279,794.00 | 53 Terraced Houses |
| Flat | £193,510.00 | 40 Flats |

