
Houses for sale & to rent in Newquay Treloggan, Newquay
House Prices in Newquay Treloggan
Properties in Newquay Treloggan have an average house price of £301k and had 202 Property Transactions within the last 3 years¹.
Newquay Treloggan is an area in Newquay, Cornwall with 1,735 households², where the most expensive property was sold for £865k.
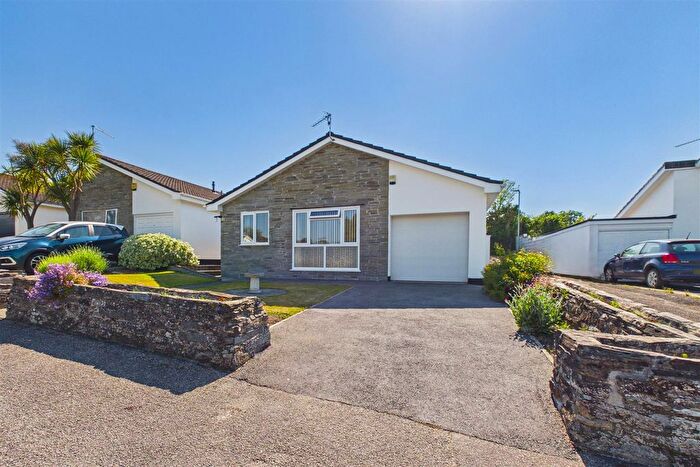
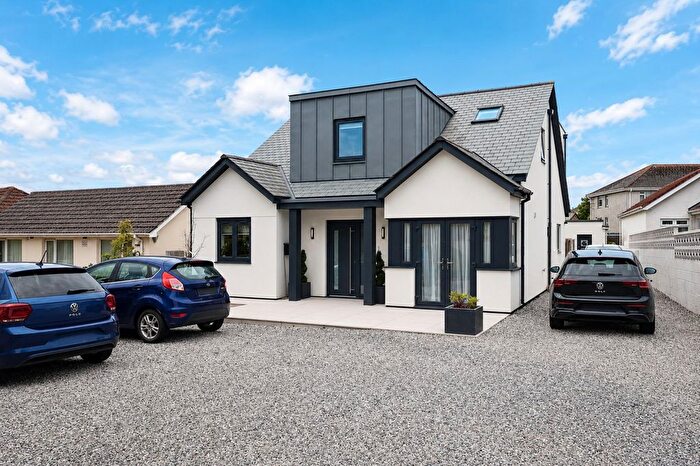
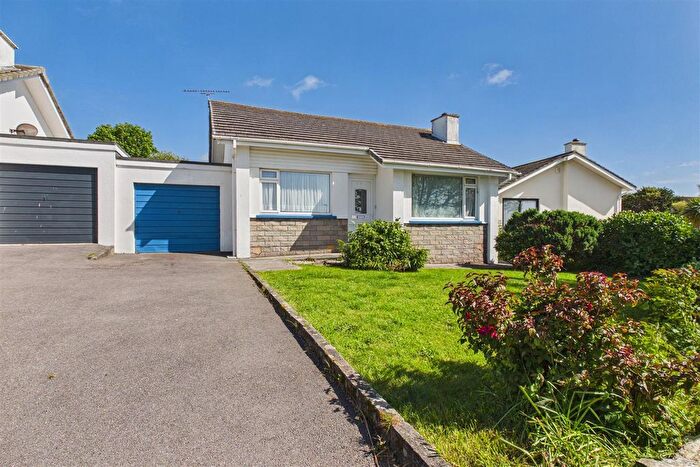
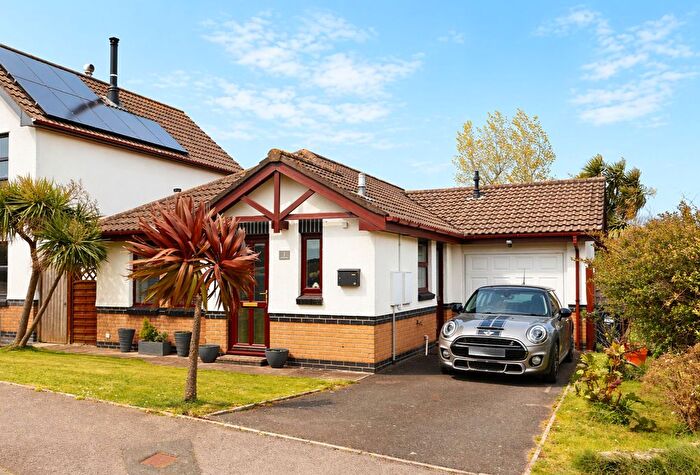
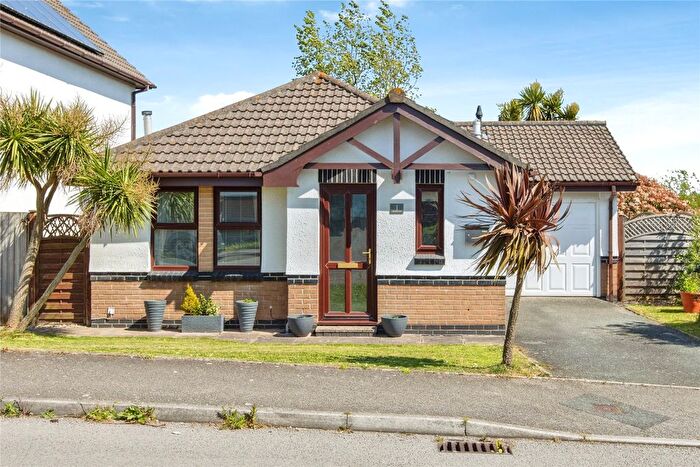
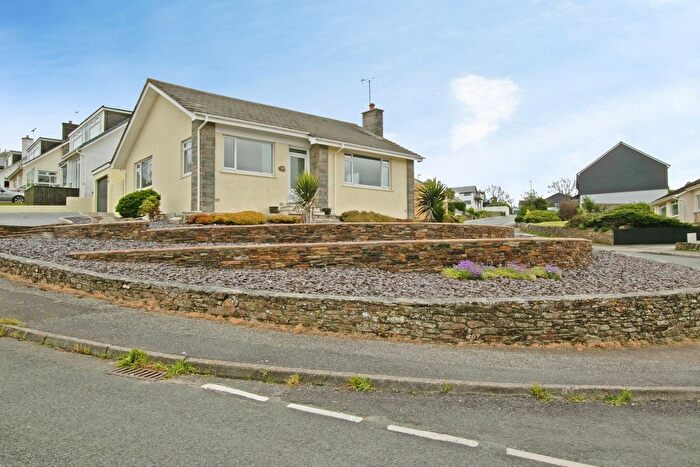
Properties for sale in Newquay Treloggan
![]()
If you are looking to sell your house, let it out, or receive a property valuation, an expert can help you.
Click the button below to get started.
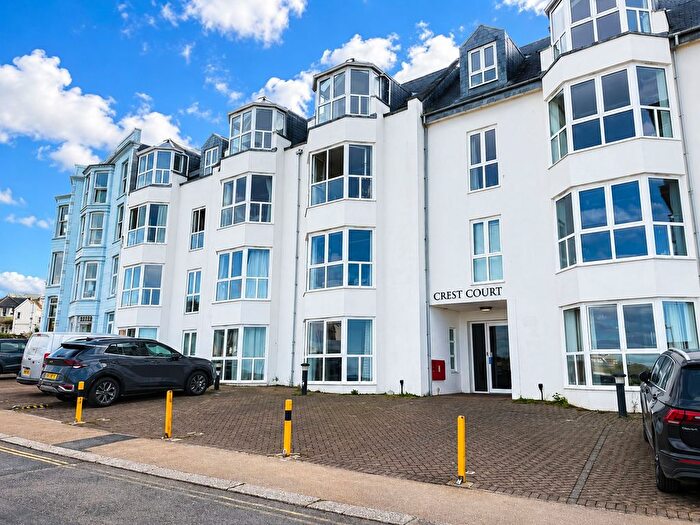
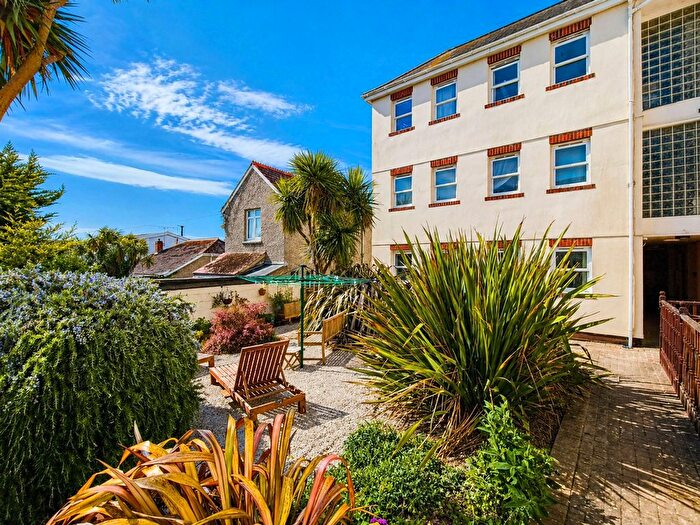
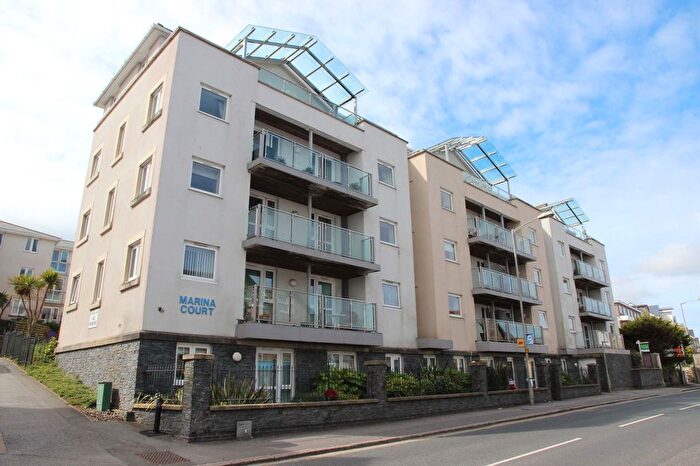
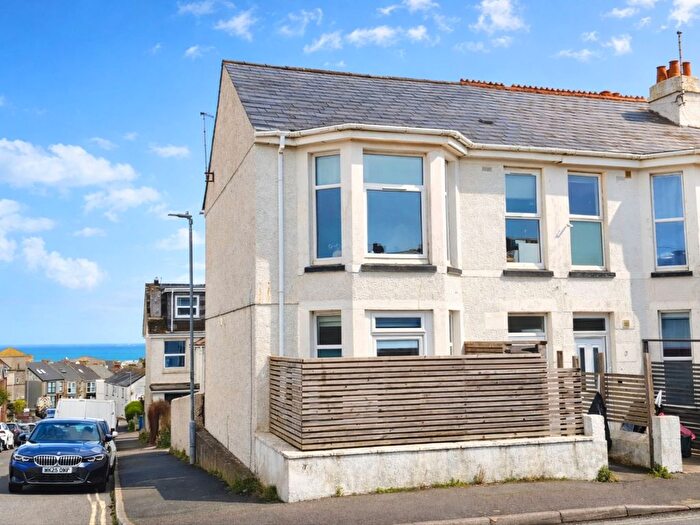
Previously listed properties in Newquay Treloggan
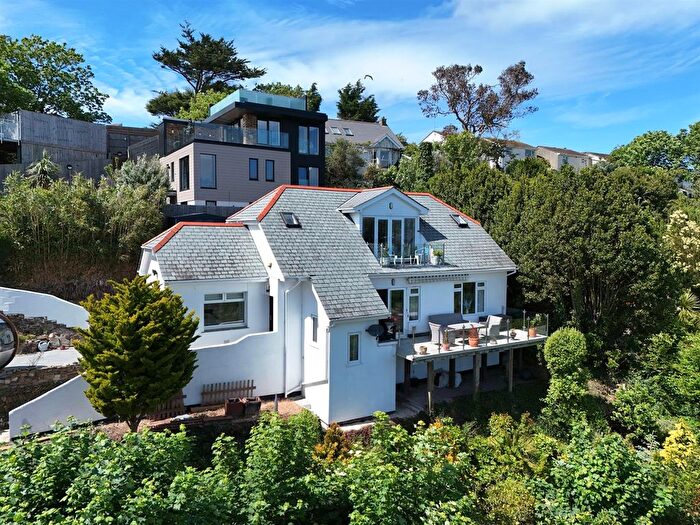
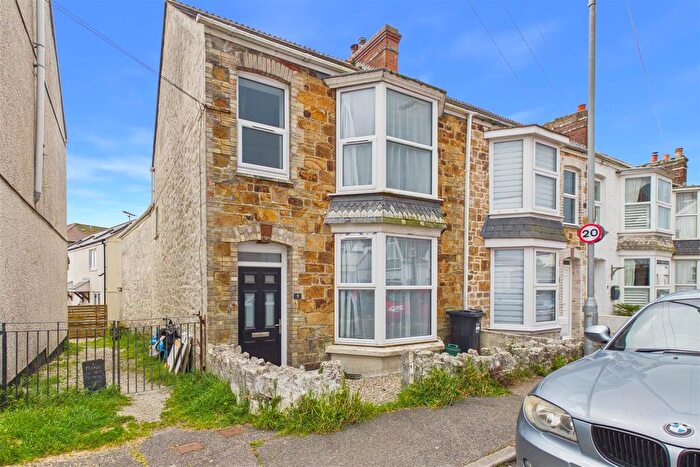
![]()
If you are looking to sell your house, let it out, or receive a property valuation, an expert can help you.
Click the button below to get started.
Roads and Postcodes in Newquay Treloggan
Navigate through our locations to find the location of your next house in Newquay Treloggan, Newquay for sale or to rent.
| Streets | Postcodes |
|---|---|
| Abbey Mews | TR7 2DJ |
| Agar Road | TR7 2EP TR7 2ER TR7 2EW TR7 2LP |
| Bramble Close | TR7 2SU |
| Bridge Close | TR7 2JJ |
| Cheviot Road | TR7 2EF TR7 2EG TR7 2EQ |
| Chichester Crescent | TR7 2LD |
| Chynance Drive | TR7 2DY |
| Clifden Close | TR7 2EZ |
| Crown Close | TR7 2TR |
| Dale Close | TR7 2TL |
| Dale Road | TR7 2ST TR7 2TQ |
| Downside Close | TR7 2TD |
| Elm Close | TR7 2LN |
| Gannel Road | TR7 2AG |
| Gannel Rock Close | TR7 2FL |
| Goonvrea Close | TR7 2JZ |
| Gorse Close | TR7 2TP |
| Gresham Close | TR7 2LF |
| Hawkins Road | TR7 2EA TR7 2EB TR7 2ED TR7 2EE |
| Headleigh Road | TR7 2HJ |
| Higher Well Close | TR7 2JR |
| Kew Close | TR7 2JB |
| Linden Avenue | TR7 2ES |
| Linden Crescent | TR7 2HA |
| Listry Road | TR7 2DS TR7 2DT |
| Little Down Park | TR7 2TH |
| Luxland View | TR7 2FJ |
| Luxon Drive | TR7 2HE |
| Mayfield Road | TR7 2DG TR7 2DQ |
| Meadow Close | TR7 2JL |
| Meadowside | TR7 2LJ TR7 2TW |
| Mellanvrane Lane | TR7 2LB |
| Middleton Crescent | TR7 2LG |
| Mowhay Close | TR7 2RJ |
| Pendragon Crescent | TR7 2SS TR7 2SY |
| Penina Avenue | TR7 2LE |
| Penmur Road | TR7 2LY |
| Polwhele Road | TR7 2LW TR7 2SJ TR7 2SZ TR7 2TN |
| Pras Lowgan | TR7 2NA |
| Rawley Lane | TR7 2EH TR7 2ET TR7 2EU TR7 2EX TR7 2HT |
| Sweet Briar Crescent | TR7 2JP |
| Tamarisk Lane | TR7 2JW |
| Tredour Road | TR7 2EY |
| Treforda Road | TR7 2LH |
| Trelawney Road | TR7 2DP TR7 2DW |
| Treloggan Industrial Estate | TR7 2SX |
| Treloggan Lane | TR7 2JN TR7 2FP |
| Treloggan Road | TR7 2FH TR7 2JF TR7 2JQ TR7 2JT |
| Trenance Avenue | TR7 2HH TR7 2HQ |
| Trenance Caravan Park | TR7 2JY |
| Trenance Lane | TR7 2HX TR7 2HY TR7 2HU |
| Trenance Road | TR7 2HL TR7 2HN TR7 2LU TR7 2LX TR7 2HW |
| Treninnick Hill | TR7 2JS TR7 2JU TR7 2JX TR7 2SR |
| Trevemper Road | TR7 2HR TR7 2HS |
| Trevithick Close | TR7 2LA |
| Vivian Close | TR7 2DN |
| Wheatfield Crescent | TR7 2JG TR7 2JH |
| Wych Hazel Way | TR7 2LL |
| TR7 2LQ |
Transport near Newquay Treloggan

- FAQ
- Price Paid By Year
- Property Type Price
Frequently asked questions about Newquay Treloggan
What is the average price for a property for sale in Newquay Treloggan?
The average price for a property for sale in Newquay Treloggan is £300,727. This amount is 18% lower than the average price in Newquay. There are 935 property listings for sale in Newquay Treloggan.
What streets have the most expensive properties for sale in Newquay Treloggan?
The streets with the most expensive properties for sale in Newquay Treloggan are Trevemper Road at an average of £539,990, Penina Avenue at an average of £427,500 and Trenance Road at an average of £425,000.
What streets have the most affordable properties for sale in Newquay Treloggan?
The streets with the most affordable properties for sale in Newquay Treloggan are Pras Lowgan at an average of £127,500, Higher Well Close at an average of £175,000 and Penmur Road at an average of £210,000.
Which train stations are available in or near Newquay Treloggan?
Some of the train stations available in or near Newquay Treloggan are Newquay, Quintrell Downs and St.Columb Road.
Property Price Paid in Newquay Treloggan by Year
The average sold property price by year was:
| Year | Average Sold Price | Price Change |
Sold Properties
|
|---|---|---|---|
| 2026 | £250,100 | -23% |
4 Properties |
| 2025 | £307,798 | 2% |
68 Properties |
| 2024 | £300,152 | 1% |
72 Properties |
| 2023 | £296,644 | -11% |
58 Properties |
| 2022 | £329,466 | 12% |
60 Properties |
| 2021 | £289,220 | 11% |
64 Properties |
| 2020 | £257,971 | 14% |
70 Properties |
| 2019 | £222,360 | 2% |
80 Properties |
| 2018 | £218,468 | 10% |
94 Properties |
| 2017 | £197,489 | -1% |
85 Properties |
| 2016 | £199,989 | 4% |
57 Properties |
| 2015 | £192,557 | 12% |
66 Properties |
| 2014 | £168,982 | -5% |
94 Properties |
| 2013 | £176,710 | -3% |
81 Properties |
| 2012 | £181,810 | 3% |
60 Properties |
| 2011 | £176,558 | -8% |
41 Properties |
| 2010 | £190,956 | 15% |
51 Properties |
| 2009 | £162,146 | -11% |
66 Properties |
| 2008 | £179,308 | -15% |
34 Properties |
| 2007 | £206,493 | 16% |
96 Properties |
| 2006 | £173,029 | 5% |
117 Properties |
| 2005 | £165,187 | 1% |
89 Properties |
| 2004 | £163,672 | 12% |
92 Properties |
| 2003 | £144,278 | 25% |
120 Properties |
| 2002 | £107,537 | 23% |
93 Properties |
| 2001 | £83,280 | 11% |
109 Properties |
| 2000 | £74,018 | 12% |
100 Properties |
| 1999 | £64,870 | 18% |
98 Properties |
| 1998 | £53,491 | -2% |
90 Properties |
| 1997 | £54,822 | 10% |
110 Properties |
| 1996 | £49,394 | 3% |
117 Properties |
| 1995 | £47,704 | - |
77 Properties |
Property Price per Property Type in Newquay Treloggan
Here you can find historic sold price data in order to help with your property search.
The average Property Paid Price for specific property types in the last three years are:
| Property Type | Average Sold Price | Sold Properties |
|---|---|---|
| Semi Detached House | £309,422.00 | 59 Semi Detached Houses |
| Detached House | £419,091.00 | 48 Detached Houses |
| Terraced House | £243,916.00 | 80 Terraced Houses |
| Flat | £190,760.00 | 15 Flats |